NQ1! – Bearish Descending Channel, Short Setup Active Nasdaq 100 futures remain trapped inside a bearish descending channel on the 4H chart after failing to reclaim the 25,500 zone.
Key points: Series of lower highs along the blue upper trendline
Strong rejection every time price touches the channel top
Support cluster 25,000–24,800 tested multiple times but showing weakening bounces
RSI slipping toward oversold, but momentum still favors sellers
Bearish plan
Current price rejecting the upper channel again around 25,300–25,320
→ Short entry zone 25,280–25,320
Target 1: 25,000
Target 2: 24,800 (lower channel boundary)
Target 3: 24,500 (channel breakdown target)
Stop-loss above 25,450 (clear invalidation)
Risk/Reward → 1:1.8 average Bullish reversal only on strong break and close above 25,400–25,450 with volume (then first target 25,800). As long as we stay inside this channel, bias is short. Holiday-thinned liquidity can accelerate the move on Friday open.
Short setup live.
Trade ideas

Nasdaq 100 (NQ): Hyper-Extended Momentum – Breakout or Exhaust
Category: Trend Analysis / Support & Resistance
Ticker: NQ1! (CME)
Analysis:
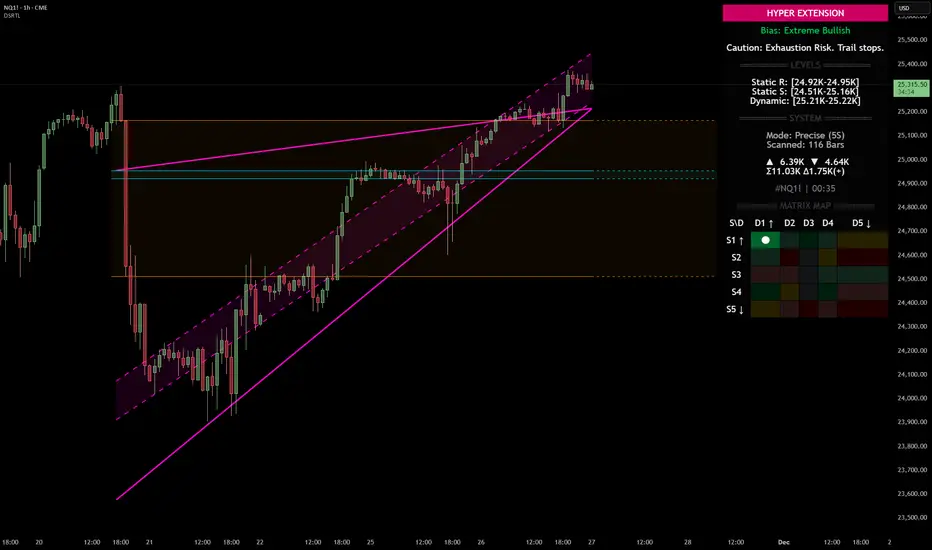
We are looking at the Nasdaq 100 Futures (NQ1!) on the 1H timeframe using the Dynamic Support & Resistance (DSRTL) system. The market is currently displaying a textbook example of a high-momentum breakout that has pushed into statistical extremes.
Here is the breakdown of the current technical landscape based on the indicator's Matrix Logic:
1. The "Hyper Extension" State (S1 / D1)
The indicator’s dashboard has triggered a "HYPER EXTENSION" alert. This specific state occurs when two conditions are met simultaneously:
• Static Breakout (S1): Price has cleared the horizontal resistance structures (indicated by the volume clusters).
• Dynamic Overextension (D1): Price has pierced above the upper limit of the dynamic trend channel (the purple trendlines).
2. Bias: Extreme Bullish
The current bias is rated as "Extreme Bullish". The trend is undeniably strong, confirmed by the positive Volume Delta (+965) shown on the dashboard. The price action is aggressive, creating a steep angle of ascent that has moved away from the mean.
3. The Warning Signal: Exhaustion Risk
While the trend is up, the system issues a cautionary note: "Exhaustion Risk. Trail stops."
In technical terms, when price action moves into "D1" (Dynamic Overextension), it indicates that the asset is trading significantly above its standard deviation or channel geometry. Historically, markets often seek mean reversion or consolidation after such rapid expansions to sustain the trend.
Key Levels to Watch:
• Dynamic Support (Immediate): The top of the purple channel (approx. 25,220) acts as the first layer of defense. A retest of this level is common after a breakout.
• Static Support (Structural): The breakdown level of the previous resistance, now turning into support around the 24.95K region.
Scenario Conclusion:
This is a pure momentum play. Traders should be aware that while the path of least resistance is up, the probability of a "snap-back" or consolidation increases the further price stretches above the dynamic channel. This is not a signal to short the trend immediately, but rather a signal to manage risk tightly on existing long positions.
Disclaimer: This analysis is for educational purposes only and explains the logic of the DSRTL technical indicator. It does not constitute financial advice.
Potential short setup on NQ
I am still learning but looking to me like a potential short setup from that daily inverted fair value gap targeting the next sell side liquidity zone.
Please let me know in the comments if my bias is wrong and why.
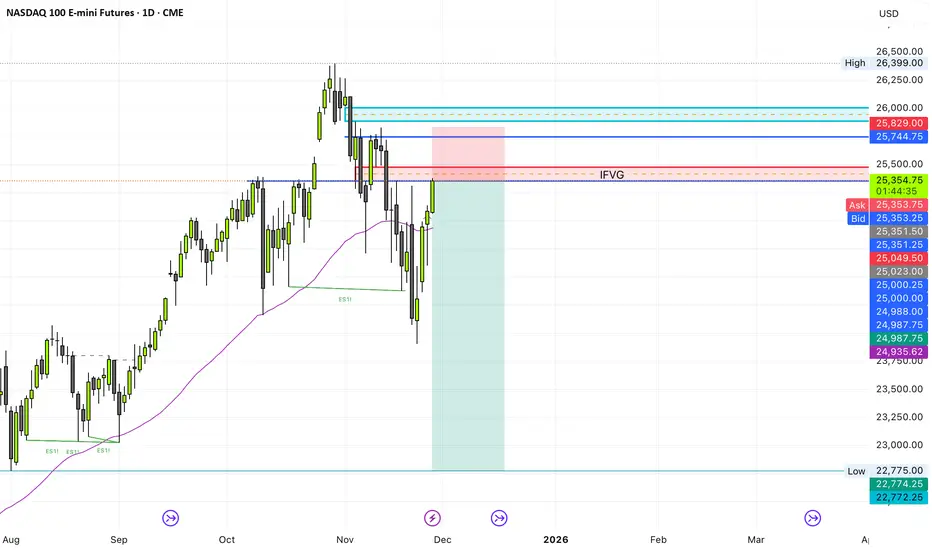
NasdaQ BiasDAILY CHART
1. Expecting lower prices if we stay below that balanced price range just above the 50% level.
2. If the balanced price range fails to hold price the market might look to explore that in the last premium quadrant and possibly all time highs.

NQ Targets (11-24-25)The downtrend is on and will play inside the Diablo's (red diagonal lines) until breakout. 24,600 to 24,056 is Churn Zone and 24,708 and 24,226 are KL's to watch for opposite direction trades 1st and follow through 2nd. NAZ did come close to -10% level in the overnight, popped back up on a Friday (typical). The original Short call was aiming at all the O/N gaps up from prior Rig lift (from O/N), these have been cleaned out. The NDX chart will show these that started on 10/24 through 10/29. Note, from here the math gets interesting and can be illustrated on the NDX chart. We may see heavier selling in the O/N as 11/20 was an outside day reversal close. Notice on the NDX chart that the recent 58% lift can erased will only a 37% drop and the YTD 24% high is erased will only a 19% drop. Heavy volume lower after light volume (off session) lift. Keep in mind that the O/N has a new limit down of -7% (old was -5%). Keep in mind the drawdown math effect = pain. Unless we see a retest that can get above NDX Danger Zone and get back above the Upper TZ or long term trendline (orange, 25,095). NDX 25,095 - 23,233 is Churn Zone until breakout. NQ - NDX differential is about 200 points.
NDX Chart

Loss on modelSelling below the low was probably a mistake, once those REL's had been taken I should've been patient, lesson learnt.

Monastic System live // LONG NQEntry: 25,215 → TP : 24,560 (+700 pts)
→ +74R to be filled
One setup. One plan. Zero noise.

NQ Power Range Report with FIB Ext - 11/26/2025 SessionCME_MINI:NQZ2025
- PR High: 25094.00
- PR Low: 25061.25
- NZ Spread: 73.25
Key scheduled economic events:
08:30 | Durable Goods Orders
- GDP
- Initial Jobless Claims
10:00 | Core PCE Price Index (MoM|YoY)
- New Home Sales
Session Open Stats (As of 12:15 AM)
- Session Open ATR: 532.12
- Volume: 27K
- Open Int: 291K
- Trend Grade: Long
- From BA ATH: -4.6% (Rounded)
Key Levels (Rounded - Think of these as ranges)
- Long: 26636
- Mid: 25410
- Short: 23426
Keep in mind this is not speculation or a prediction. Only a report of the Power Range with Fib extensions for target hunting. Do your DD! You determine your risk tolerance. You are fully capable of making your own decisions.
BA: Back Adjusted
BuZ/BeZ: Bull Zone / Bear Zone
NZ: Neutral Zone
NQ - Week 48 updatedI added some levels that were not on the last chart.
T.A. is explained on the other chart.

NQ on Major Support Target 36,490Nasdaq 100 index is on major support since September. This is the area you want to buy and as it goes up take some profits if you want for a potential check back into support around early 2027 (green path).
There's the alternative scenario (orange path) that we just trend right up to 36,490 resistance and then have a major pullback to the long term trend. This one is less likely, but possible.
Either way if you sell some of your position (like shorter term options) in the middle of the range you're likely to be in a better position than holding the entire time as eventually that lower trend should get hit and that's a lot of time decay to ruin your positions.
Good luck!

NQ1 Sell ideaNasdaq has just entered a zone of interest, Point of Control in a heavy sell volume area. Going to wait for a bearish reversal confirmation candle, then enter targeting previous lows.

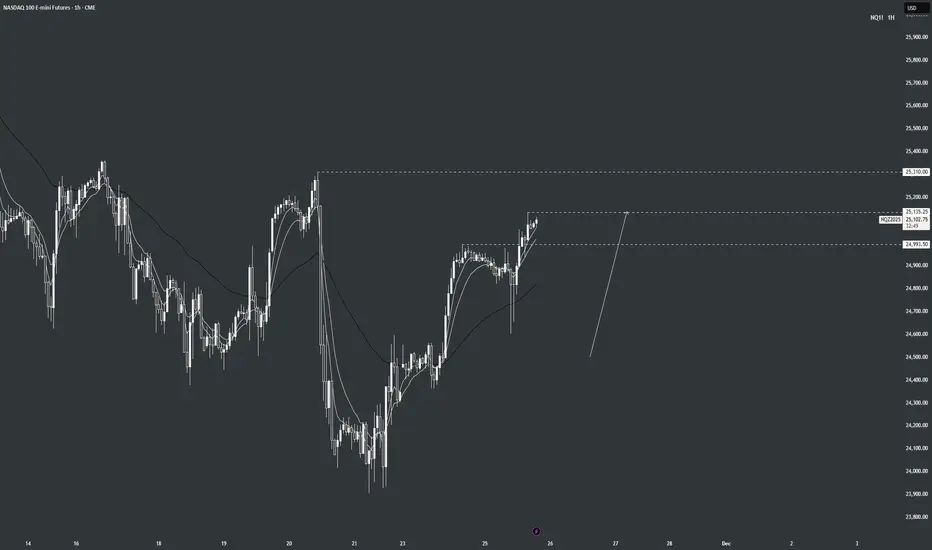
NQ Daily Outlook | November 25, 2025NQ had a very nice push higher NY session. Buyers in control early this week as the 1hr timeframe is pushing higher towards 25310.00!
Bias: Continue to push higher BULLISH
10K Account2000+% AROI.
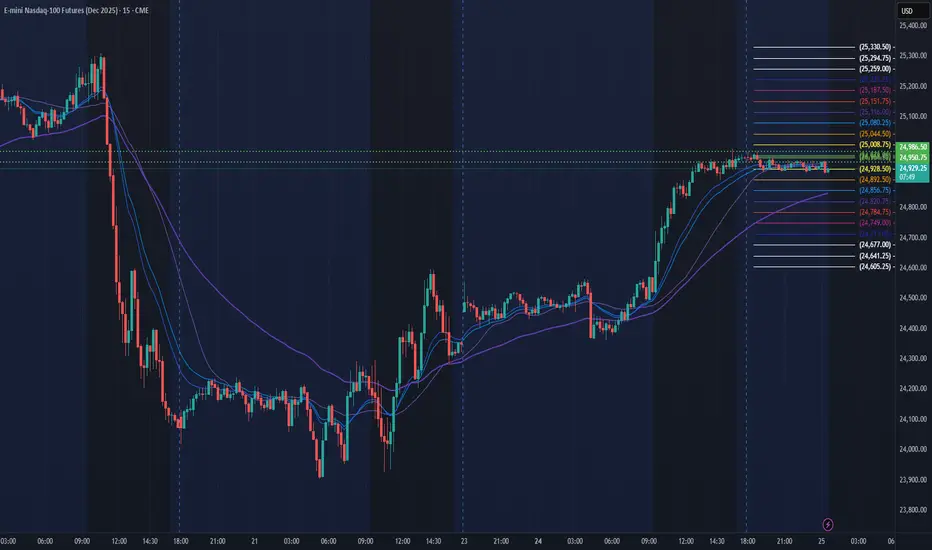
1.Bedrock Support: 24625.
2.08:30 AM report: Core inflation cooled. This increases the chance of an interest rate cut at the Fed's next meeting, 12/10.
3.Historic Bull Market, pull back and bounce.
4.Prior day close: 24948.25
5.Strong Resistance: 25000
At 09:00 AM when you looked at the chart this is what you saw. The price was just below the prior day's close. You have a 10K account. What would you do? How would you trade this?
You need to play it safe. You want a very high probability win rate.
You have many options. The most obvious is to buy the bedrock support, 24625. Let's make this as easy as possible and say you bot 1MNQ @ 24625. Now what? You have the above 5 reasons in favor of this trade. The prior day's close will act as a price magnet therefore you should aim for that as your target.
It's not good to leave $ on the table, therefore you will trade a Ladder. Every 20 points or so you will sell that contract and immediately buy another.
With a bigger account you would buy 2 or more contracts @ 24625 and ladder those up decreasing the quantity as you get closer to your target.
Your author regrets he could not publish this before 09:00 AM for your benefit. He traded this as described above. Had you traded this with 1MNQ contract you would have made 2000 - 3000+% AROI.
This is part of our series on becoming one of the best Nasdaq-100 futures day traders on the planet.

5 trades 5 winsUsing my model again, a daily repeatable model with time and price confluences. I mixed up bullish and bearish a few times listening back ha.

MNQ SHORT TERM BUYS INTO SELLSI see MNQ opening with sells then buying up to the 88.6 zone and rejecting to continue downward

Pre open Heads Up. Index NSYECME_MINI:NQ1!
Looking for bearish prices on the Index triads for this NYO while the overall thought process is bullish on the HTF

NQ Power Range Report with FIB Ext - 11/25/2025 SessionCME_MINI:NQZ2025
- PR High: 24986.50
- PR Low: 24950.75
- NZ Spread: 79.75
Key scheduled economic events:
08:30 | Retail Sales (Core|MoM)
- PPI
10:00 | CB Consumer Confidence
Session Open Stats (As of 12:25 AM)
- Session Open ATR: 529.65
- Volume: 28K
- Open Int: 296K
- Trend Grade: Long
- From BA ATH: -7.4% (Rounded)
Key Levels (Rounded - Think of these as ranges)
- Long: 26636
- Mid: 25410
- Short: 24039
Keep in mind this is not speculation or a prediction. Only a report of the Power Range with Fib extensions for target hunting. Do your DD! You determine your risk tolerance. You are fully capable of making your own decisions.
BA: Back Adjusted
BuZ/BeZ: Bull Zone / Bear Zone
NZ: Neutral Zone

Nasdaq 100, USD Index: Thanksgiving PerformanceToday I’m digging into my Excel data to see how the Nasdaq and the US Dollar Index performed across the three trading days either side of Thanksgiving.
Matt Simpson, Market Analyst at City Index.

Will December Rate Cut Save the Market?Is Rate Cut Probability up a Short-Term Bounce or continuation of the downtrends?

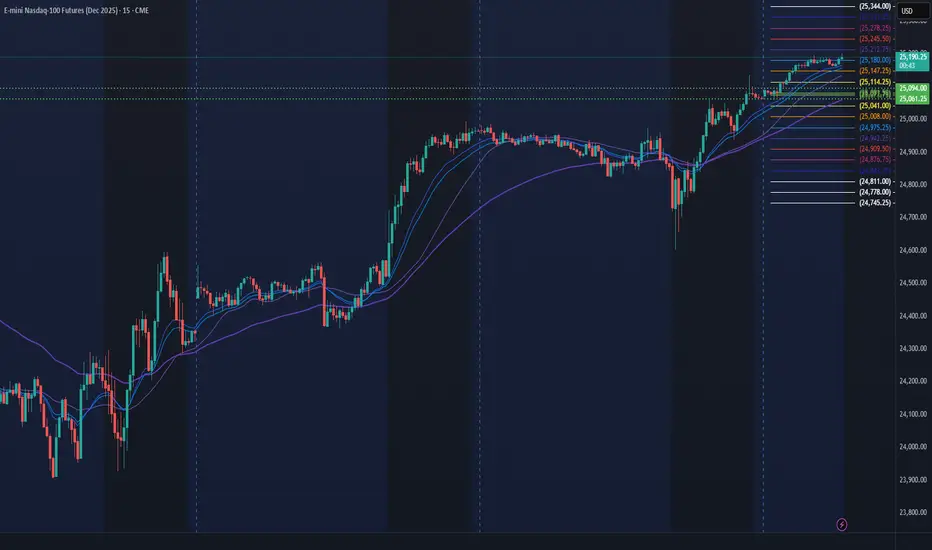
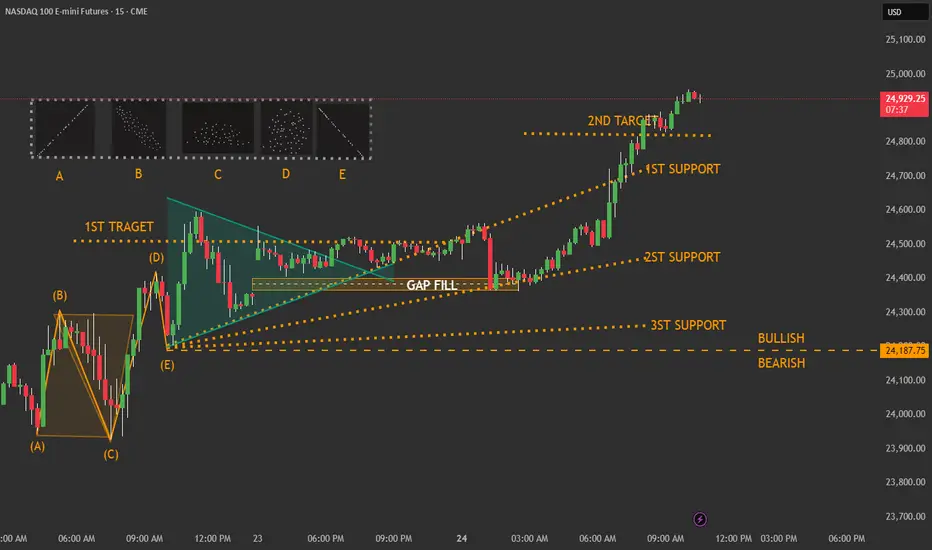
nq 15 min update Overall Idea
(Not financial advice)
The chart shows a price pattern forming after a strong move upward and downward, followed by a consolidation phase. The diagram highlights targets, supports, and a gap fill area, helping determine bullish vs. bearish scenarios.
Wave Structure (A → E)
(Not financial advice)
On the left side, there's a labeled price swing (A–B–C–D–E).
This represents a sequence of higher-lows and lower-highs, ending at point (E).
Point (E) acts as the base from which the next structure begins.
Triangle Wedge Pattern
(Not financial advice)
Right after point (E), the market forms a tightening triangular structure
Upper descending line seller pressure
Lower ascending line buyer pressure
This pattern shows compression before a larger movement.
Gap Fill Area
(Not financial advice)
The GAP FILL zone inside the triangle marks an area where price previously skipped quickly.
Price often returns to such zones, creating
temporary support
or a magnet before continuation
Price Targets
(Not financial advice)
1ST TARGET
Primary upside objective if price breaks above the triangle.
2ND TARGET
A farther target indicating strong bullish expansion.
Support Levels
(Not financial advice)
1ST SUPPORT
Closest support maintains bullish structure.
2ND SUPPORT
A deeper structural support.
3ST SUPPORT
Strongest support and major turning point.
Bullish vs. Bearish Line
(Not financial advice)
The dashed horizontal line at the bottom marks the key boundary
Above → bullish
Below → bearish
NQ, Will History Really Repeat, or Is This a Trap?The chart lays out a familiar rhythm: expansion, consolidation, distribution, and the pullback into heavy demand. We’ve seen this movie before — literally. Prior cycles followed almost the same path, pausing at the same magnet zones and washing into the same liquidity pockets before the next leg.
But here’s the real question:
Is the market lining up for another classic reset, or is this where the fractal breaks?
We’re already seeing early echoes of previous cycles — the topping structure at 25,000, buyers getting tired at the highs, and price starting to drift into the same zones that produced powerful reversals in the past. Two 3-month FVGs sit directly underneath price, and historically, markets don’t just ignore imbalances this size. They come back to clean them up.
But the bigger picture isn’t identical. Index composition is heavier, liquidity conditions are different, and macro flows aren’t the same as 2020–2021. So while the structure rhymes, the environment doesn’t fully match.
Which forces the real tension here:
Does NQ repeat its old playbook and drift toward the 0.5 or even the 0.618…
or does the weight of new-cycle dynamics break the fractal entirely and push us somewhere new?
The market is sitting right at that inflection point.
Hold above the 0.382 → cycle repeat stays alive.
Lose 24,500 → market likely revisits the first FVG.
Reject 25,000 again → deeper rotation becomes the higher-probability path.
This week is where the fractal either confirms… or gets thrown out.

