NQ Premarket UpdateES and RTY filled the Sunday gap, NQ didn't quite fill, left a 3.5 pt gap. So small, I'm not sure if it matters.
In any case though, MFI is quickly approaching overbought, so it'll probably go down Tues or Wed anyways.
Trade ideas

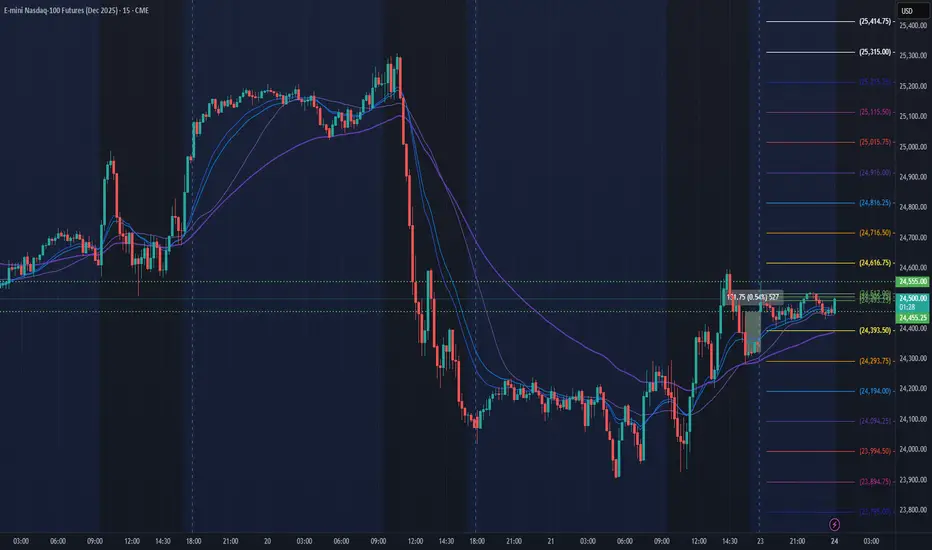
NQ 25,155: Heavy-Volume Resistance + FVG Short SetupNQ is forming a strong resistance at 25,155, sitting at the start of a heavy-volume zone created during a sharp selloff. This is where sellers previously built short positions and are likely to defend again. A bearish Fair Value Gap aligns perfectly with the same level, strengthening the zone. A pullback into 25,155 offers a clean short opportunity.

Factors That Can Affect the Global Market1. Economic Indicators and Growth Rates
Economic performance is one of the biggest factors influencing the global market. Key indicators such as GDP growth, inflation, employment rates, and industrial output shape expectations about a country’s economic stability.
Strong economic growth increases foreign investment, boosts trade volumes, and encourages risk-taking in global markets.
Weak or negative growth leads to reduced consumer spending, falling demand for imports, and declining stock markets.
Inflation also plays a crucial role. High inflation reduces purchasing power and forces central banks to raise interest rates, slowing down economic activity. Conversely, low and stable inflation creates a favorable business environment.
2. Monetary Policy and Interest Rates
Central banks—such as the US Federal Reserve, European Central Bank, Reserve Bank of India, and Bank of Japan—heavily impact the global market through monetary policy decisions.
Interest rate hikes make borrowing expensive and strengthen the country’s currency. This can reduce stock prices, lower commodity demand, and slow global economic activity.
Interest rate cuts stimulate spending and investment, often pushing global markets upward.
When the US Federal Reserve changes interest rates, the effects ripple across the entire world because the US dollar is the dominant currency in global trade and investment.
3. Geopolitical Tensions and International Conflicts
Geopolitics is a major source of uncertainty in global markets. Conflicts such as US-China tensions, Middle East instability, or Russia-Ukraine conflict affect oil prices, supply chains, trade agreements, and investor confidence.
Wars and conflicts disrupt production and trade routes.
Sanctions limit access to markets and resources.
Political instability causes capital flight and currency devaluation.
Geopolitical risk is especially influential in the energy market, since oil and gas supplies are concentrated in politically sensitive regions.
4. Global Trade Policies and Agreements
Changes in trade relationships between nations strongly affect the global market. Trade agreements promote economic cooperation, while trade wars disrupt supply chains and increase costs.
Tariffs raise the price of goods, reducing demand and affecting corporate profits.
Free trade agreements (FTAs) encourage cross-border business and lead to market expansion.
Import/export restrictions can disrupt sectors that rely on global sourcing.
For example, restrictions in semiconductor exports can impact global electronics, automotive, and technology markets.
5. Technological Advancements and Innovation
Technology drives global market growth by improving efficiency, reducing production costs, and creating new industries. Major technological breakthroughs—such as AI, automation, blockchain, electric vehicles, and biotechnology—reshape sector dynamics worldwide.
Companies adopting new technologies gain competitive advantages.
Older industries may decline due to technological disruption.
Tech-heavy stock markets, like NASDAQ, influence global investor sentiment.
Digitalization has also globalized financial markets through faster trading platforms, online banking, and the growth of cryptocurrencies.
6. Currency Fluctuations and Exchange Rates
Foreign exchange (forex) markets play a pivotal role in global trade. Currency appreciation or depreciation affects international competitiveness.
A strong currency makes exports expensive and imports cheaper.
A weak currency boosts exports but increases the cost of imported goods.
For multinational companies, exchange rate volatility can significantly impact revenue and profitability. Investors also shift capital towards countries with stable or strengthening currencies.
7. Commodity Prices (Oil, Gold, Metals, Agriculture)
Commodity markets deeply influence global economic conditions. Key commodities include crude oil, natural gas, gold, silver, iron ore, wheat, and soybeans.
Oil prices affect transportation, manufacturing, and energy sectors worldwide. Rising oil prices increase inflation and production costs.
Gold prices act as a safe-haven indicator; during global uncertainty, investors buy gold, raising its price.
Agricultural commodities influence food prices and inflation.
Commodity exporters benefit from high prices, while import-dependent nations face economic pressure.
8. Supply Chain Disruptions
Global supply chains are highly interconnected. Events like pandemics, natural disasters, port congestion, and logistical shortages disrupt the flow of goods.
Disruptions lead to:
Higher transportation costs
Delays in production
Shortages of essential components
Increased inflation globally
The COVID-19 pandemic was a major example of how supply chain disruption can destabilize markets for years.
9. Corporate Performance and Market Sentiment
Global markets are influenced by the performance of major corporations. Earnings reports, product launches, mergers, and acquisitions impact investor sentiment and stock indices.
Positive earnings push markets upward.
Weak performance causes sell-offs.
Large multinational companies—like Apple, Amazon, Google, and Tesla—have global customer bases, so their performance influences markets worldwide.
10. Environmental Changes and Climate Risks
Climate change is increasingly shaping global markets. Extreme weather events—such as floods, droughts, and hurricanes—affect agriculture, energy supply, insurance costs, and infrastructure.
Renewable energy investments are rising.
High carbon-emission sectors face regulatory pressure.
Climate events disrupt commodity supply and productivity.
Global markets now price in climate risks as part of long-term investment decisions.
11. Global Health Crises and Pandemics
Health emergencies like pandemics create widespread market disruptions:
Industries like travel, tourism, aviation, and hospitality decline sharply.
Healthcare, pharmaceuticals, e-commerce, and technology see rapid growth.
Consumer behavior shifts dramatically.
The global impact of COVID-19 highlighted how health crises can slow economic growth and trigger global recessions.
12. Investor Psychology and Market Trends
Human behavior and sentiment also affect the global market. Fear, greed, and expectations drive short-term price movements.
Key psychological phenomena include:
Panic selling during crises
Speculative bubbles
Trends created by social media or news
Market sentiment often amplifies economic or geopolitical events.
Conclusion
The global market is influenced by a complex network of factors—economic performance, political stability, technological innovation, currency movements, natural disasters, and investor sentiment. Each factor interacts with others, creating a constantly shifting environment. Understanding these drivers helps traders, businesses, and policymakers anticipate global trends, manage risks, and make informed decisions. Whether it is a change in interest rates, a geopolitical conflict, or a supply chain disruption, every event sends waves across the global economy, shaping the future of world markets.

NQ 15 MIN Overall Idea
(Not financial advice)
The chart shows a price pattern forming after a strong move upward and downward, followed by a consolidation phase. The diagram highlights targets, supports, and a gap fill area, helping determine bullish vs. bearish scenarios.
Wave Structure (A → E)
(Not financial advice)
On the left side, there's a labeled price swing (A–B–C–D–E).
This represents a sequence of higher-lows and lower-highs, ending at point (E).
Point (E) acts as the base from which the next structure begins.
Triangle Wedge Pattern
(Not financial advice)
Right after point (E), the market forms a tightening triangular structure
Upper descending line seller pressure
Lower ascending line buyer pressure
This pattern shows compression before a larger movement.
Gap Fill Area
(Not financial advice)
The GAP FILL zone inside the triangle marks an area where price previously skipped quickly.
Price often returns to such zones, creating
temporary support
or a magnet before continuation
Price Targets
(Not financial advice)
1ST TARGET
Primary upside objective if price breaks above the triangle.
2ND TARGET
A farther target indicating strong bullish expansion.
Support Levels
(Not financial advice)
1ST SUPPORT
Closest support maintains bullish structure.
2ND SUPPORT
A deeper structural support.
3ST SUPPORT
Strongest support and major turning point.
Bullish vs. Bearish Line
(Not financial advice)
The dashed horizontal line at the bottom marks the key boundary
Above → bullish
Below → bearish

NQ Power Range Report with FIB Ext - 11/24/2025 SessionCME_MINI:NQZ2025
- PR High: 24555.25
- PR Low: 24455.25
- NZ Spread: 223.5
No key scheduled economic events
Low participation expected for short Thanksgiving holiday week
Session Open Stats (As of 12:05 AM)
- Session Open ATR: 533.61
- Volume: 41K
- Open Int: 298K
- Trend Grade: Long
- From BA ATH: -7.4% (Rounded)
Key Levels (Rounded - Think of these as ranges)
- Long: 26636
- Mid: 25410
- Short: 24039
Keep in mind this is not speculation or a prediction. Only a report of the Power Range with Fib extensions for target hunting. Do your DD! You determine your risk tolerance. You are fully capable of making your own decisions.
BA: Back Adjusted
BuZ/BeZ: Bull Zone / Bear Zone
NZ: Neutral Zone
POSSIBLE ROD MAP FOR THE PRICE MNQZ2025 24-28 NOVFor this week do not trade until Wednesday New York close High volatility, Therefore start trading on Thursday better and look for the sales to 23900, the news can manipulate the price be careful.

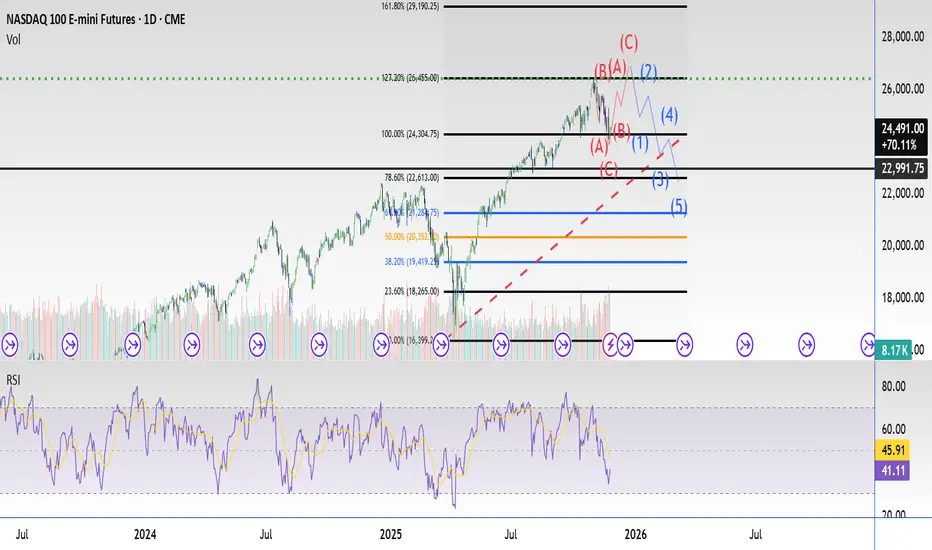
NQ bottom along with tech and crypto.New ATH coming after the recovery, I think this is the bottom of this down move, I don't think we rocket straight back up to ATH but its a great bet to add Long here. You really only get a move like this once every 5 years.
I think we see Crypto continue to move up, lots of good projects are oversold in the ALT world and lots of good projects are still carrying to torch. Showing strength amongst the weakness.
I think HYPE goes on to lead the way of finance onchain. They are only getting started.
I think S / Sonic goes on to be leader of the next defi summer 2.0.
(will make a post about them soon)
So I'm betting on the fastest horses and calling a decent spot to place bets on the overall condition of the market and i think CRYPTOCAP:BTC leads that race.

NQ Daily Outlook | November 23, 2025I am bullish on the NQ. We are pushing above the 50 ema now so we could see a push higher this week.
I will be looking for longs if the 1hr stays above the emas!

Monastic System | Live NQ LongLong 24350
TP 25060
SL 24203
RR 1:4.7
Structure doesn’t lie.
#MonasticSystem


Weekly Market Forecast: Indices Are Weak! Wait For Sells!In this Weekly Market Forecast, we will analyze the S&P 500, NASDAQ, Gold and Silver futures, for the week of Nov 24-29th.
Enjoy!
May profits be upon you.
Leave any questions or comments in the comment section.
I appreciate any feedback from my viewers!
Like and/or subscribe if you want more accurate analysis.
Thank you so much!
Disclaimer:
I do not provide personal investment advice and I am not a qualified licensed investment advisor.
All information found here, including any ideas, opinions, views, predictions, forecasts, commentaries, suggestions, expressed or implied herein, are for informational, entertainment or educational purposes only and should not be construed as personal investment advice. While the information provided is believed to be accurate, it may include errors or inaccuracies.
I will not and cannot be held liable for any actions you take as a result of anything you read here.
Conduct your own due diligence, or consult a licensed financial advisor or broker before making any and all investment decisions. Any investments, trades, speculations, or decisions made on the basis of any information found on this channel, expressed or implied herein, are committed at your own risk, financial or otherwise.

NA$. BearishA brief retracement toward the uptrend line is expected; the outlook remains bearish unless there's a strong breakthrough.

#202547 - priceactiontds - weekly update - nasdaq e-miniGood Evening and I hope you are well.
comment: Neutral. Same reasoning as dax. Here we have a proper bear channel and we are still very low in it. Selling down here is bad because you would be hoping for a break below the lower bear trend line and that’s just not likely. Much more likely is another big bounce for 24600/25000.
current market cycle: bear trend but most likely it’s a trading range 23000 - 26400
key levels for next week: 23800 - 25000
bull case: Bulls are just favored to buy it close to the lower bear trend line. We touched 25200+ last week and there is no reason we can not melt for 25k again from 24300. Reality is, bulls who bought sell spikes made money. The only bulls who lost money are the ones who bought above 25800 and if they scaled in lower, they got out break-even or better. So until we leave behind big bear gaps, this market is not going meaningfully lower.
Invalidation is below 23800
bear case: Below 23800 bears mean business and there is no more support until 23300ish. That’s the bears dream but how likely is it after 6 consecutive bull months? Not very likely. Bears know it. The channel looks pretty amazing and selling down here is a low probability trade. Sure we can get a bear surprise but I would not put my money on it. Above 24606 more bears could cover and wait for 25000+ before shorting again. If bears keep this below 25100 next week, it would surprise me we can expect more downside. Maybe not this year but definitely early Q1 2026.
Invalidation is above 24606
short term: Neutral but more interested in longs close to the lower bear trend line than shorts.
medium-long term - Update from 2024-11-23: 24150 was my latest more realistic bear target for this year and we got 23904. I doubt we can get as low as 23300. At least not with the given environment right now.

Next week NQ BearishNext week’s price outlook appears bearish.
Market structure shows a clear downtrend following the confirmed break of the previous swing low.
Price is expected to retrace into the iFVG before continuing lower toward the downside order block.
The iFVG aligns precisely with the lowest tick of the highest candle of the prior move and sits in the correct position relative to the previous supply zone.
The order block below is a high-probability area, as five liquidity lows are positioned directly above it.

24th Nov- 28th Nov NQ analysisNext week’s price outlook appears bearish.
Market structure shows a clear downtrend following the confirmed break of the previous swing low.
Price is expected to retrace into the iFVG before continuing lower toward the downside order block.
The iFVG aligns precisely with the lowest tick of the highest candle of the prior move and sits in the correct position relative to the previous supply zone.
The order block below is a high-probability area, as five liquidity lows are positioned directly above it.
Also publish a explanation video on this you can check in my profile.
Retracement After Expansion Bearish ~My Idea, Is To retracement NQ Target Is Liquidity Void
Before Expansion Bearish
#Good Look


MONDAY 11-24-25 OUTLOOKBullish outlook to grab higher internal liquidity to fuel the move down. Overall I am still bearish, but I see a push higher being more likely before we continue to sell off. We need a slight pull back to ease the selling pressure in addition to add more fuel to the selling pressure afterwards.

Emini Nasdaq 100. Important Areas to look for and Weekly outlookCME_MINI:NQ1!
Highlighted the important levels. what to look for how we can approach the next week in terms of higher timeframe reference points

NQ Year End Range (11-17-25)Recent price action is looking like what we saw late 2024 into 2025, prior to 26% drop (Feb,25). You can view the Post here:
The lift back up from the 26% drop has been a 60% run up on low volume, including the 10 minute 12% pop from Wash ST. "time to buy" Tweet. NAZ under long term TL (Orange trendline), needs to get above. Yellow line is drop trade and white is drop/pop trade. 294,910 - 25,910 is the Churn Range and look for a breakout. Below 24,910 is drop testing and looking for bounce back up, any lift near 25,910 (during the Overnight) should drop back inside Churn Zone.

NQ Weekly Recap | November 17-21, 2025Weekly Recap – NQ (Nov 17–21, 2025)
Monday (Nov 17)
Price spent the entire NY session under all EMAs. Clean downside.
Tuesday (Nov 18)
Same thing — stayed under every EMA and continued lower. No strength.
Wednesday (Nov 19)
Choppy during NY. No clean direction or follow-through.
Thursday (Nov 20)
Looked bullish before NY, but as soon as the session opened it failed and dumped under the EMAs hard. Cleanest downside day of the week.
Friday (Nov 21)
Weak push down during NY, then the bigger move up happened after the session ended.
Bias:
Overall bearish week. Price stayed under the EMAs for most of the NY sessions except for Friday’s late push up.
NQ heading towards 23,000Path of least resistance is down. Plenty of selling pressure since October 30Th. Had a high volume sell on 11-20 with poor buying today. Short term target 23,000
