1H DIRECTION SHIFT SELLING OPPORTUNITY1. If Direction Shift happens in internal structure, it's a signal of selling oppo.
2. On Base wait for one Hour selling engulf candle enter on retest and sell.
3. TP1 is 3990 and TP2 is bigger till 3790
Trade ideas

Comex Gold As prices seen in a consolidation phase from past 7 sessions. Current Support intact $3900 coincide 50DEMA along 50% fib retracement level, if prices fail sustain above support level, can see towards next support zone $3800--$3600 alien with 61.8% Feb. retracement level.
In other scenario, if prices sustain above support level, above 20DEMA-$4000 prices can will see gaining the strength towards $4200.
Whereas if US-China Trade deal tensions, Fed's unchanged rate, US shutdown can continued to see gold stuck into a long time consolidation phase .

Waiting on the Sweep – ADP Should Provide the CatalystChoppy week so far with price distributing and grinding lower. Last week’s low still hasn’t been taken, so my macro target remains the same. I’m looking for ADP tomorrow during NY session to provide the volatility needed to run liquidity and complete that sweep.
Not predicting direction on the release itself — I’ll be waiting for a liquidity grab and displacement before considering an entry. If price runs stops above today’s Asia high or drives directly into last week’s low, I’ll be watching for the post-news retrace to an FVG/structural level to participate.
Patience here — the move is close, but confirmation > anticipation.

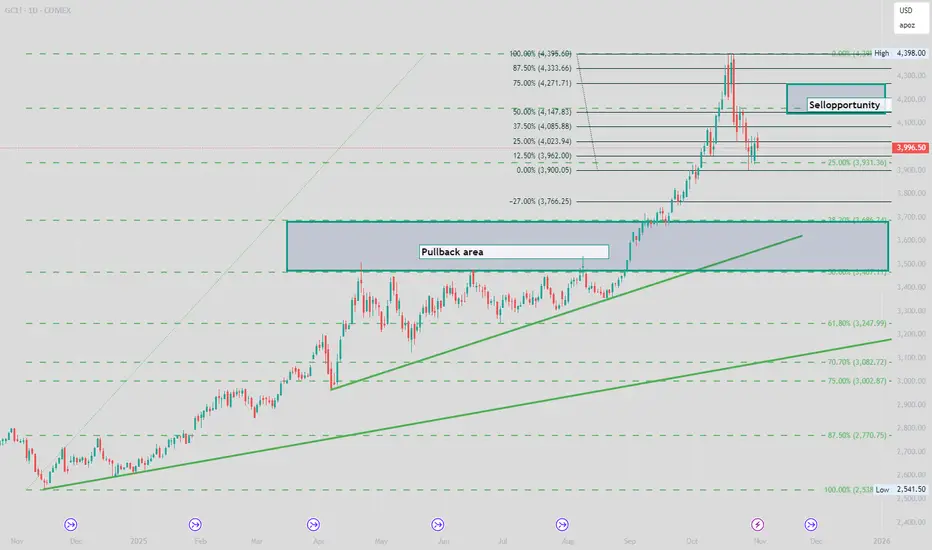
XAUXAUStraight from perplexity - Potential for a Return to $4,200
Gold prices have fluctuated but repeatedly tested the $4,200 level, and the consensus among many experts is that, despite recent corrections, gold could readily revisit or sustain levels near $4,200, depending on global economic events, monetary policy (especially Fed rate decisions), inflation, and geopolitical uncertainties.

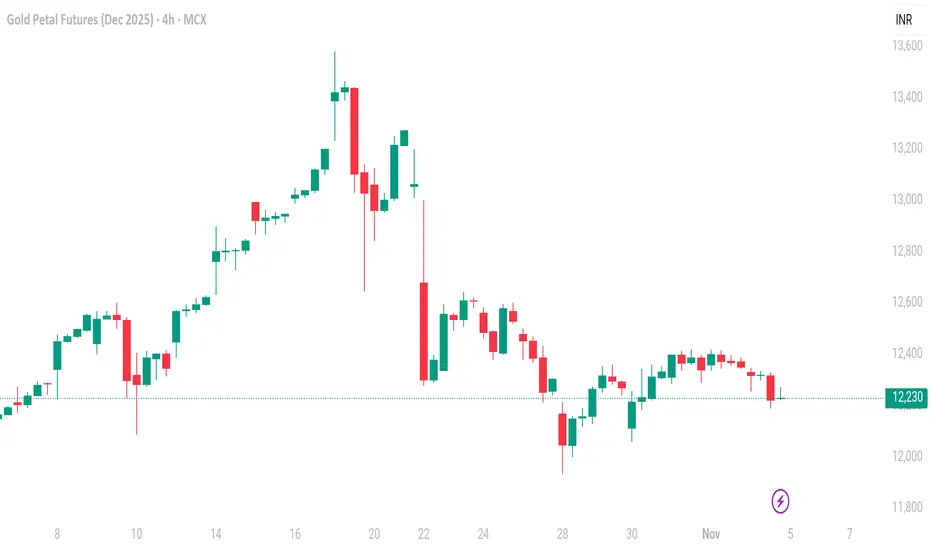
Gold futures max in 4hGold futures max in 4h and trying to identify the trendlines to find entry stop-loss and targets based on 4h time frame.
Gold MCX Future - Intraday Technical Analysis - 5th Nov., 25MCX:GOLD1!
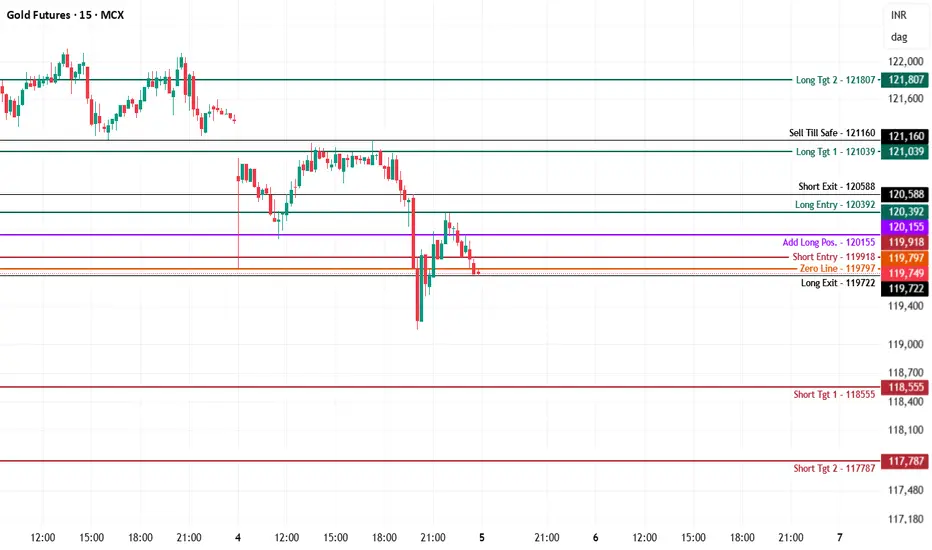
MCX Gold Futures — Chart Pathik Insights | 5-Nov-25
Gold futures are under selling pressure, trading stall at 119,749 right at the zero line after a sharp leg down and minor bounce attempts. Price remains weak as sellers control action just beneath the 120,000 psychological mark, pointing to possible further downside unless reclaimed by bulls.
Bearish Structure:
Short setups dominate below 119,918, with every failed retest of the add-long (120,155) keeping momentum with sellers.
Downside Levels:
118,555: First logical target for bears; cover some, trail the rest.
117,787: Aggressive extension if broad liquidation triggers.
Risk Management: Shorts should be managed above the add-long or zero line to minimize risk if a reversal takes hold.
Bullish Structure:
Longs to be considered only above 120,392, needing quick acceptance back in the prior higher band and strong closes above resistance.
Upside Levels:
121,039: Initial resistance for partial or full booking.
121,807: Extension if sentiment flips with volume.
Risk Management: Use the short-entry/zero-line as stops for any fresh longs caught in whipsaws.
Neutral/Inflection:
The 119,797–119,749 band marks the direct battle for the session — choppy price is likely until a firm imbalance emerges. Be patient for confirmation before executing size.
Use these mapped zones for optimal structure, adaptive entries, and aggressive defense.
If these levels clarify your daily plan, boost, comment, and share—your support boosts the learning loop.
Follow Chart Pathik for unbiased pivots, process-backed logic, and practical market learning.
Choosing Your Path in Futures TradingThere’s more than one way to participate in the futures markets. Whether you're hands-on or prefer a more passive approach, selecting the right method depends on your trading goals, risk tolerance, and available time. Here’s a breakdown of the most common approaches used by active and aspiring futures traders.
1. Self-Directed Trading
If you like full control over your trades, this approach is for you. It requires staying up to date on market news, analyzing charts, and executing your own trades according to a plan and framework which can be referred to as your “strategy.” Experienced traders may prefer this model for its flexibility and transparency.
Past performance is not indicative of future results.
2. Automated Trading Systems
These systems use predefined rules to analyze data and execute trades without manual intervention. They can be ideal for traders who want to capitalize on algorithmic speed and logic while minimizing emotional decision-making, or for traders who might not have the time to dedicate to self-directed trading.
EdgeClear offers connectivity to a handful of automated programs, if you are interested in learning more please contact us.
3. Managed Futures
For a more passive route, managed futures allow you to invest in futures contracts through a Commodity Trading Advisor (CTA) or Commodity Pool Operator (CPO). The advisor handles the trading, using their expertise to manage risk and seek opportunity.
4. Broker-Assisted Trading
Prefer to have a trusted guide by your side? With broker-assisted trading, a professional helps execute trades, manage risk, and offer support—all tailored to your preferences.
Key Takeaway
Every trader’s journey in the futures markets looks different. Whether you thrive on taking full control of your trades, prefer automated systems, or rely on professional guidance, the key is to find the approach that aligns with your goals, risk tolerance, and lifestyle.
Understanding the options available self-directed, automated, managed, or broker-assisted empowers you to trade more confidently and effectively.
Call to Action
At EdgeClear, we’re dedicated to helping traders at every level find the tools, guidance, and support they need to succeed. Explore our platforms, connect with our expert brokers, or follow us on TradingView to discover more Trade Ideas and educational content to refine your edge.
GC week 45threw this together real quick.
T.A explained -
BS & FS levels are expected support when dashed lines, tested when dotted and resistance when solid lines.
The inverse is true for the Inv. BS Inv. FS levels, they are resistance as dashed lines, tested as dotted and support as solid lines.
Monthly timeframe is color pink
weekly grey
daily is red
4hr is orange
1hr is yellow
15min is blue
5min is green if they are shown.
strength favors the higher timeframe.
2x dotted levels are origin levels where trends have or will originate. When trends break, price will target the origin of the trend. its math, when the trend breaks, the vertex breaks too so the higher timeframe level/trend that breaks, the more volatility there could be as strength in the orders flow in to fuel the move.

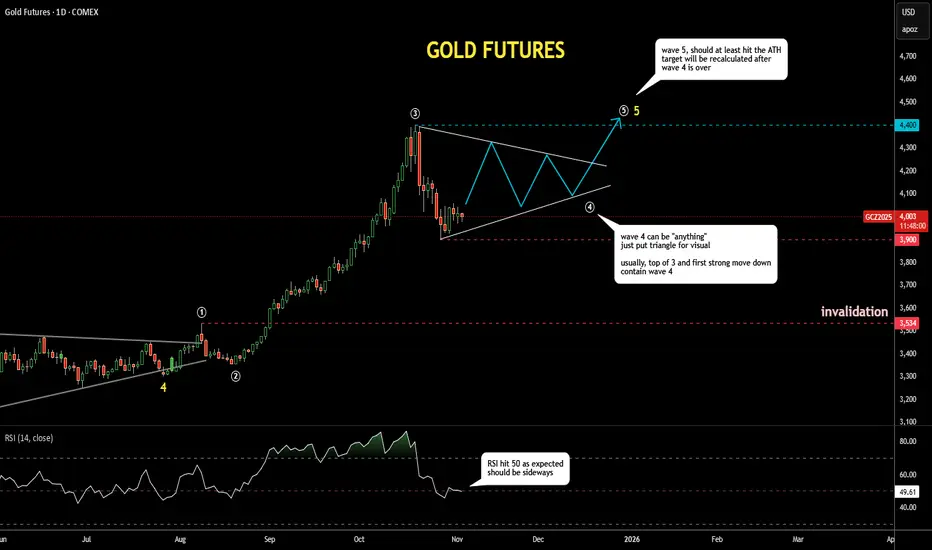
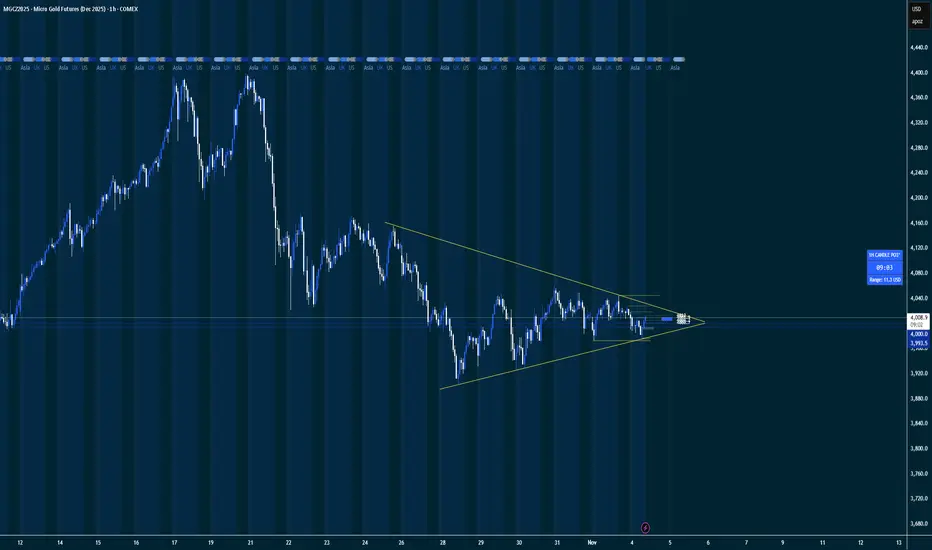
Gold Update 04NOV2025: Wave 4 Dropped Into Target AreaGold futures dropped into the pink-box target area based on the Fibonacci retracement between $3,750 and $4,000.
As expected, the RSI has reached the 50 “waterline”, where it could find some support and start moving around that level.
Many traders lose money in fourth waves, as they can be “anything” and often last longer than one’s pocket. I’ve outlined a triangle shape in wave 4 just for visual context.
The range built through the peak of wave 3 around $4,400 and the bottom of recent panic selling near $3,900 will likely contain most of the volatility in wave 4.
It can take time… testing one’s patience.
Bearish Scenario (primary)Bearish Scenario (primary)
Bias: Still bearish until price can reclaim 4020+ on 4H.
Setup idea:
Entry: 4008–4012 (retest of imbalance / EMA cluster).
Stop-loss: 4022–4025 (above 4H minor swing and trendline).
Targets:
TP1 → 3980 (1H structure low / EMA200 zone)
TP2 → 3960 (liquidity sweep below wedge support)
TP3 → 3920 (major 4H demand zone)
Confirmation: Wait for 15m rejection wick or lower-timeframe MSS/CHOCH within that zone.
Bullish Alternative (reversal breakout)
If price closes a 4H candle above 4020 with strength:
Entry: Retest of 4010–4012 as support.
Stop-loss: Below 3995.
Targets:
TP1 → 4040 (previous supply zone).
TP2 → 4080 (liquidity above equal highs).
Summary
Structure compression signals potential breakout soon.
Since momentum is still bearish and price is failing to reclaim 4H EMAs, short from resistance is higher-probability.
Watch reaction to 3980 — if it holds firmly with bullish divergence, the wedge breakout north could begin.
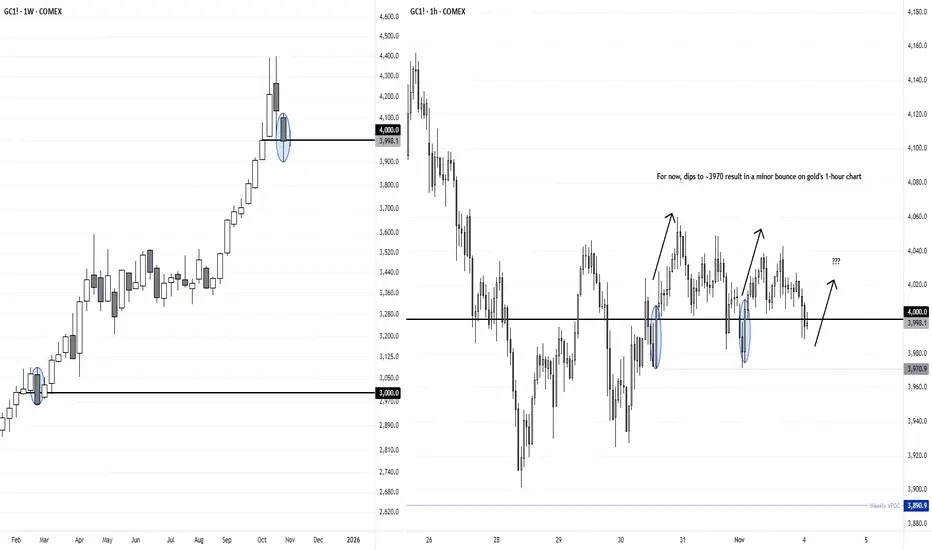
Gold Bulls Defend the $4000 Level as Bears Struggle for ControlGold closed lower for a second week, and prices are now meandering around the 4000 handle. We can see that the last time it tried to break back below such a milestone level, gold bear sonly managed a single weekly close below 3000 before the rally continued.
I doubt we’ll see another 1000 directly from current levels, and my bias is actually for the retracement to eventually dip lower before its bullish trend resumes. But for now, traders could seek false breaks below 4000 in anticipation of at least a minor move higher.
My video from Friday provides a bullish bias on the daily timeframe over the near term which still stands. But for those on intraday timeframes, notice that bullish engulfing candles have appeared on the 1-hour chart on the prior two occasions that gold tried (but failed) to break beneath 4000. It’s as if gold bears are trying to force the golden beach ball below its 4000 waterline.
Matt Simpson, Market Analyst at City Index
GOLD COMEXGold looks weak and face Resistance in 4010 and 4050. On 1hour good setup for short. Target near 3810 and SL NEAR 4050 .

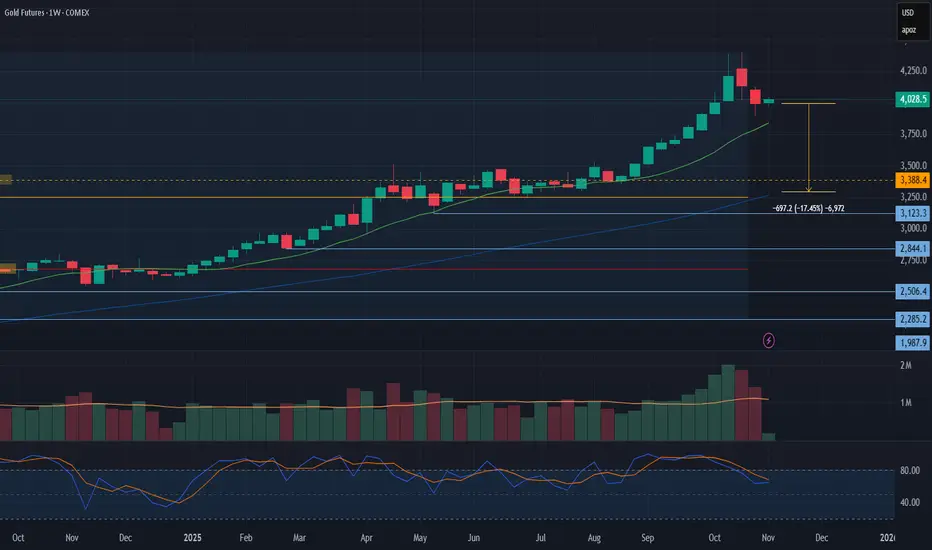
Gold futuresOver the past four weeks, gold futures have pulled back and fallen below the $4000 level. Formally, the trend remains bullish; however, from a historical perspective, it has already lasted nearly 1000 days, which leaves little room for further growth. In the event of a downward correction, gold could target the support level in the $3200-3300 range.
Long-term trend: Up
Resistance level: 4400
Support level: 3200-3300
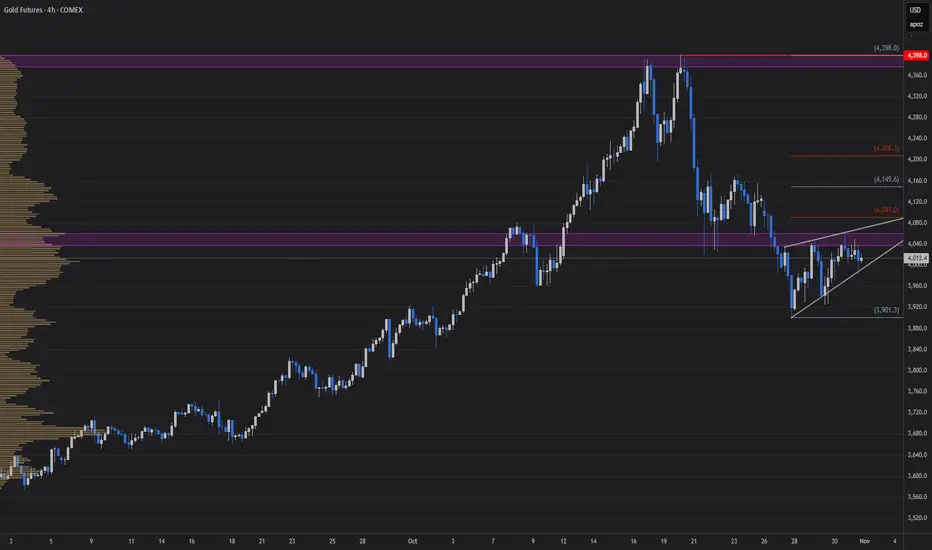
Gold Awaits Breakout or BreakdownFenzoFx—Gold's upside momentum has been capped by the $4,050.00 resistance, backed by the anchored VWAP from October 23. The immediate support rests at the recent lower high, the $3,971.00 mark.
From a technical perspective, a close below the immediate support could trigger the downtrend, retesting the lows at $3,901.00. On the flip side, if the price closes above $4,050.00, the current uptick in momentum could extend to the upper line of the bearish channel, followed by $4,175.00.

Gold Futures (MGCZ2025) — Weekly FVG Magnet & Potential ReversalPrice has been respecting Standard Deviation levels beautifully across the H4, Daily, and Weekly timeframes. The market recently rejected the H4 FVG and is now hovering mid-range, with a Weekly Fair Value Gap left open below.
This imbalance could attract price early in the week, creating a liquidity grab and possible weekly low before Gold flips bullish again.
Key Levels:
🟤 H4 FVG rejection zone: 4,040 – 4,080
🔵 Weekly FVG target: 3,880 – 3,900
⚫ Weekly High: 4,124
⚫ Weekly Low: 3,901
Narrative:
I’m expecting price to push into the Weekly FVG discount zone early in the week — potentially aligning with high-impact financial news — and then reverse bullish for a mid-week or end-of-week rally.
Watch For:
Price displacement or BOS near the Weekly FVG
Killzone reactions (London & NY)
Volume and order flow confirmation before entering
Bias: Short-term bearish → medium-term bullish
Invalidation: Sustained trade below 3,842 (Weekly Lows & -1σ zone breach)

GOLD: Bullish! Continue To Buy! The +FVG Is Holding!In this Weekly Market Forecast, we will analyze the Gold (XAUUSD) for the week of Nov. 3 - 7th.
Gold has completed the pullback into the Weekly +FVG. It has moved sideways since, but inching higher.
Buys are valid. They have the highest probability.
Sells become valid only after a bearish break of market structure!
Enjoy!
May profits be upon you.
Leave any questions or comments in the comment section.
I appreciate any feedback from my viewers!
Like and/or subscribe if you want more accurate analysis.
Thank you so much!
Disclaimer:
I do not provide personal investment advice and I am not a qualified licensed investment advisor.
All information found here, including any ideas, opinions, views, predictions, forecasts, commentaries, suggestions, expressed or implied herein, are for informational, entertainment or educational purposes only and should not be construed as personal investment advice. While the information provided is believed to be accurate, it may include errors or inaccuracies.
I will not and cannot be held liable for any actions you take as a result of anything you read here.
Conduct your own due diligence, or consult a licensed financial advisor or broker before making any and all investment decisions. Any investments, trades, speculations, or decisions made on the basis of any information found on this channel, expressed or implied herein, are committed at your own risk, financial or otherwise.

GC Higher or Lower?Looking at GC on the 4 hour TF, we see it consolidating in a small rising wedge. If price wants to continue higher, I will be looking for price to drop back down to the $3980s level and then move higher breaking out of the wedge. If price wants to continue lower, I will be looking for price to make its way up to the 38.2% Fibonacci level marked on the chart, around $4090s, before breaking back down and creating another leg down in its recent downtrend.
What are your thoughts on GC?
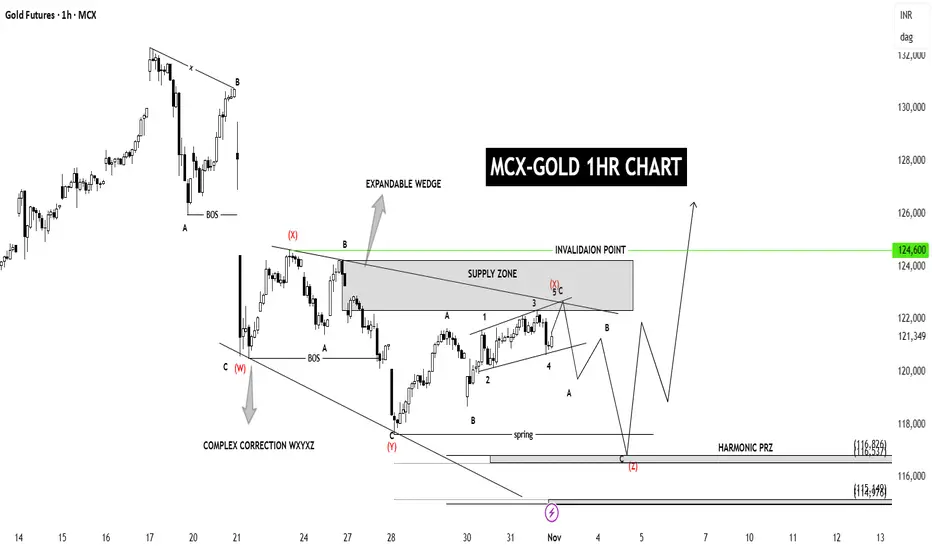
MCX-GOLD 1HR SWING🟡 1. Chart Title
“MCX-GOLD 1HR CHART” — This means the analysis is based on each candle representing 1 hour of price action.
⸻
⚙ 2. Structure Breakdown
• Complex Correction (W–X–Y–X–Z):
This shows that gold has been in a corrective phase, not an impulsive move.
The correction is labeled as a WXYXZ structure — a complex sideways/downward correction with multiple swings.
• Expandable Wedge:
The pattern shows an expanding shape, meaning each swing is getting slightly larger.
This is a sign of high volatility and often forms before a major breakout.
⸻
⚫ 3. Key Zones
• Supply Zone (around ₹124,000–₹124,600):
This is where sellers are expected to enter the market, possibly pushing the price down again.
• Invalidation Point (₹124,600):
If the price goes above ₹124,600, this current bearish correction view is invalidated, and a bullish breakout could start.
• Harmonic PRZ (Potential Reversal Zone):
Located around ₹116,800 – ₹113,400, marked at the bottom of the chart.
This is a buy zone (demand area) based on harmonic projection — expecting the price to reverse upward from this region.
⸻
🔁 4. Elliott Wave Labels
• Current correction labeled as Wave (4) —
After completion, a strong Wave (5) impulse upward is expected.
• Sub-waves (a–b–c) are drawn within the correction to show smaller internal movements.
⸻
📉 5. Expected Move
The chart shows two possible paths:
1. Short-term bearish move —
Price may fall from the supply zone (~₹122,000–₹124,000) to the harmonic PRZ around ₹117,000.
2. Then bullish reversal —
From the PRZ, the chart expects a strong upside rally, possibly toward ₹126,000+.
Gold Bush dont rush put a flush but stay hush
Do you really see what's happening here? I
was Not able to use my indictors and New
Algos Bc they are private or unpublished
Wouldn’t you join then if that was The
Case?? previews thsnkd TV , getting into sharing ideas here and youll love them

Massive move in GC this year, what now ?Gold has been on a tear this year to the top a combination of factors, massive buying by central banks and hedging against any potential turmoil i the markets, dips have been limited but we could be seeing a deeper correction before the resumption of the move higher and testing $5000

Gold Today's gold chart has 11 drawings from the monthly timeframe in pink to the 15min timeframe in blue.
top down analysis favors the higher timeframe levels for strength but the best entries are found on the lower timeframes fractals confirming the larger timeframe direction.
Gold has broken an accumulation trend and is now looking for the liquidity from above to test the support at lower levels. We'll look back later and see which levels were taken and where liquidity was hiding,
price just tested a 4hr trend so price is in between the 1hr timeframe support ladder and daily resistance. If price can hold the 1hr timeframe, it has a chance to regain the daily trend or at least back test it.

Multiple time Standard Deviation PlaybackGoing over a playback looking at how a Standard Dev indicator works in finding levels of support and resistance. This helps to fins good areas to take profit or where price might just turn around. Good Pivotal points.
