Trade ideas
WTI(20251106)Today's AnalysisMarket News:
US ADP employment rose by 42,000 in October, the largest increase since July 2025, exceeding market expectations of 28,000. The US ISM non-manufacturing PMI for October came in at 52.4, a new high since February 2025.
Technical Analysis:
Today's Buy/Sell Threshold:
60.27
Support and Resistance Levels:
61.30
60.91
60.66
59.87
59.62
59.23
Trading Strategy:
Consider buying if the price breaks above 60.27, with a first target price of 60.66.
Consider selling if the price breaks below 59.87, with a first target price of 59.62.

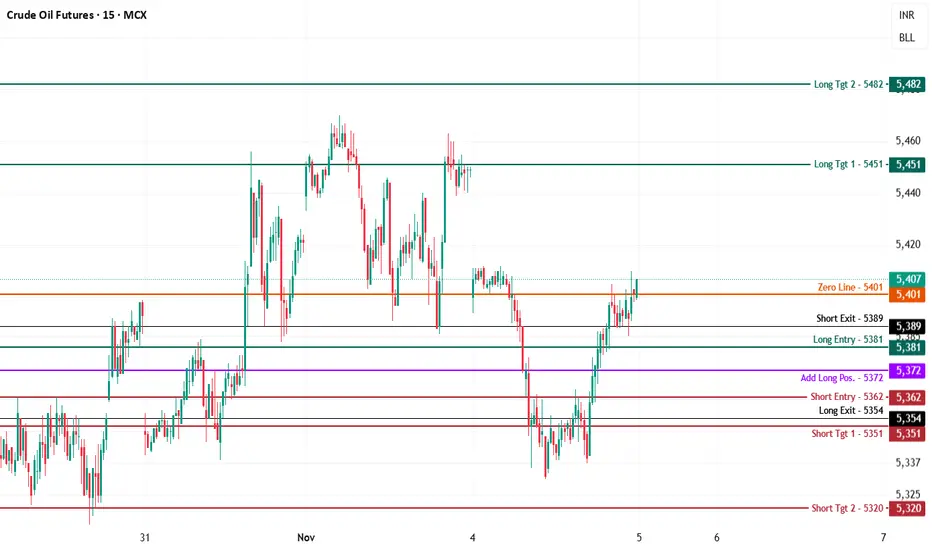
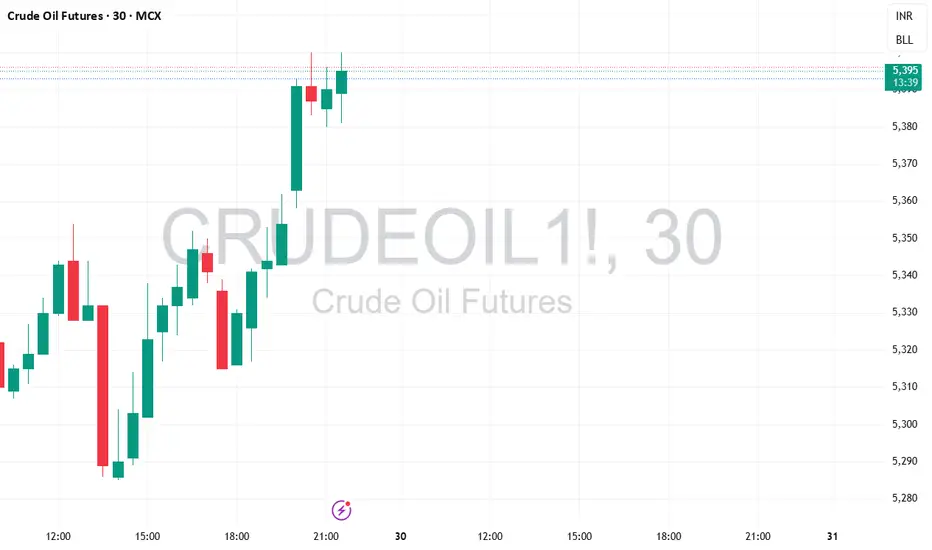
Crude Oil MCX Future Intraday Technical Analysis for 5th Nov.MCX:CRUDEOIL1!
MCX Crude Oil Futures — Chart Pathik Insights | 5-Nov-25
Crude Oil is climbing modestly, trading at 5,407 and pressing just above the zero line (5,401) after a determined recovery from late-session lows. The market is now balancing just under key resistance, and volatility can pick up with any strong push past the current pivots.
Bullish Structure:
Long setups activate above 5,381, with confidence growing if price holds above the zero line and works through 5,407.
Upside Levels:
5,451: First booking or resistance zone for bulls.
5,482: High extension if breakout momentum builds intraday.
Risk Management: Longs should use the add-long (5,372) or recent swing lows as stops in case the uptrend fails to sustain.
Bearish Structure:
Short action becomes valid below 5,362, especially if price sharply rejects resistance at the current band or fails to sustain the breakout.
Downside Targets:
5,351: Logical quick profit or scalp target.
5,320: Extension for deeper unwinding.
Risk Management: Shorts should be protected above 5,381, or covered if the market decisively pushes back above the zero line.
Chop/Neutral View:
With 5,401 as the pivot, expect further volatility and whipsaw action near the zero line—wait for breakout confirmation before scaling up exposure.
Keep these levels mapped for decisive entries and adaptive risk control. If Chart Pathik pivots clarify your session, boost, comment, and share to support the trading community.
Follow for objective structure, mapped logic, and continuous learning, every market day.
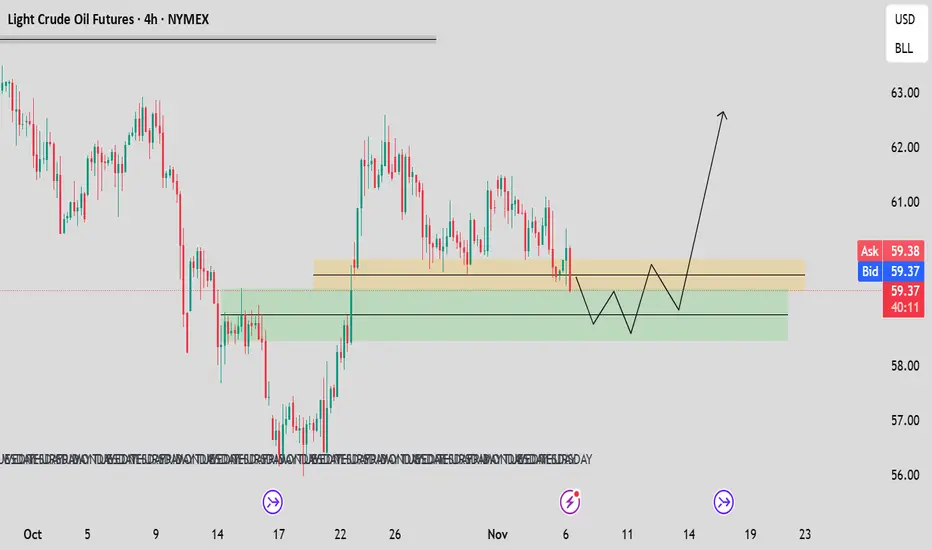
CRUDE OILPreferably suitable for scalping and accurate as long as you watch carefully the price action with the drawn areas.
With your likes and comments, you give me enough energy to provide the best analysis on an ongoing basis.
And if you needed any analysis that was not on the page, you can ask me with a comment or a personal message.
Enjoy Trading ;)
Crude oil waiting for longsCrude oil weekly chart.
After taking lower high weekly candle, price run $+61 for that dealing range I was looking for price retrace to fibo 50% level, we are almost there, I will look for lower t market structure break for confirmation, after that will long oil

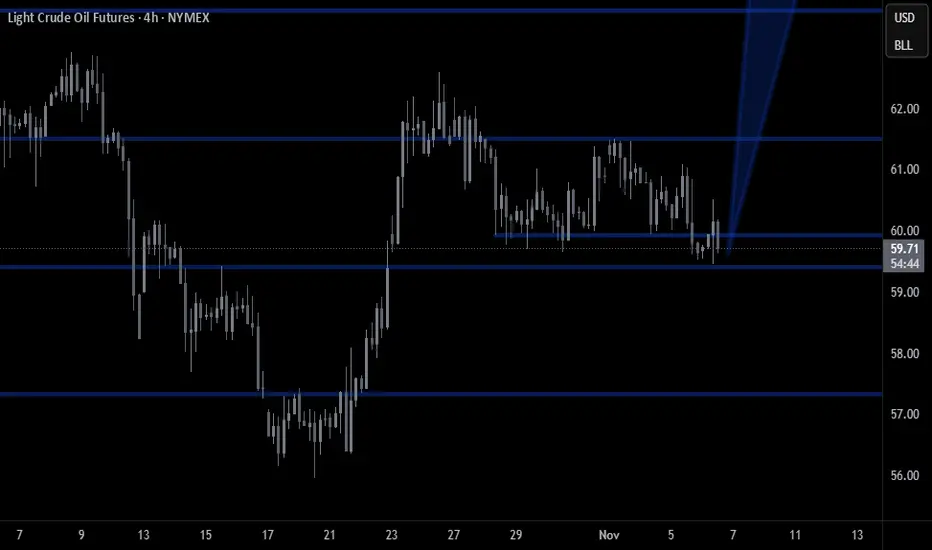
WTI Crud Oil Holds Above $60Crude oil closed higher for a third day on Friday and is showing signs of stability above $60. This suggests the retracement from 62.59 is complete and momentum is preparing to realign itself with the rally from the 55.96 low.
While resistance is nearby - from the 200-day EMA and October's high-volume node (HVN), I suspect prices will eventually break above them. Bulls could consider dips towards last week's low to increase the potential reward to risk ratio, on the assumption of a retest of the 62.59 high and potential break above it.
Matt Simpson, Market Analyst at City Index

CL been the same all year - 2025 The song remains the same in CL this year aggressive moves higher get met with selling and big sell off's run into buyer range bound and key areas been mapped.
Crude Oil MCX Future - Intraday Technical Analysis - 10 Nov., 25$MCX:CRUDEOIL — Chart Pathik Intraday Insights | 10-Nov-25
(If these levels have worked for you, a quick boost or comment is a small gesture that keeps these posts flowing and the community lively!)
Crude Oil
is consolidating at 5,309, rotating around the zero line (5,295) after several intraday swings and sharp reversals from weekly lows. Each comment or share helps keep this analysis robust and the trading community engaged!
Bullish Structure:
Long setups get traction above 5,329, with further confirmation on closes above swing resistance.
Targets: 5,353 (primary booking zone), 5,389 (stretch target on breakout)
Control: Stops favored near 5,318, or trail at zero line for risk management
Bearish Structure:
Shorts activate below 5,307, especially if price fails to sustain above the add-long (5,318) or zero line.
Targets: 5,237 (partial/scalp), 5,201 (extended move)
Control: Shorts should cover fast on reversals beyond long entry or breakout pivots
Neutral Zone:
5,295 is the tactical equilibrium — stay nimble until a decisive close establishes the next move.
These setups deliver method, structure, and clarity for disciplined decisions in rapidly shifting markets.
If you find value in these posts, a quick engagement below shows you’re part of this learning journey—don’t be a silent reader, help Chart Pathik reach more traders!

From Bounce to Barrier: Oil Path to the Next Sell ZoneThe short term price action in OIL suggests that the decline from 23rd June 2025 peak ended in 3 waves structure. Up from there, it has made a 5 waves bounce from the lows therefore we suspect that it can be correcting that cycle in simple zigzag correction into the path to the next sell zone.
In which, the decline from $56.29 low has completed wave (W) of the decline from 6.23.2025 peak. Up from there, the bounce unfolded in 5 waves impulse sequence where wave ((i)) ended at $58.27 high. Wave ((ii)) pullback ended at 56.99 low, wave ((iii)) rallied towards $62.20 and wave ((iv)) ended at $61.21 low. Then a new high towards $62.59 high ended wave ((v)) thus completed wave A of a zigzag correction.
Down from there, OIL is correcting the cycle from 10.20.2025 low in wave B pullback. The internals of this ongoing pullback is taking place as double three correction where wave ((w)) ended in lesser degree 3 waves at $59.70 low. Then another 3 wave bounce ended wave ((x)) at $61.50 high. Since than, wave ((y)) is unfolding in another 3 waves. But it can reach $58.61- $56.82 area lower first before starting the C leg higher.

Sell crude oil around 61.50, with a target of 60.00-58.00Crude Oil Market Analysis:
Maintain a sell stance on crude oil. Every rebound is a selling opportunity. Crude oil has seen relatively small fluctuations in recent months, with minimal market reaction and constant buying and selling. Consider selling if it rebounds to 61.50 today. Previous inventory data releases also had a temporary impact, leading to selling pressure.
Fundamental Analysis:
Today, focus on the ADP employment data, a leading indicator for non-farm payrolls. Also, pay attention to the new crude oil inventory data.
Trading Recommendation:
Sell crude oil around 61.50, with a target of 60.00-58.00.

CL SELLSELL CL at 71.0000 or 68.000, riding it down to 55.5000 to 51.0000 as Profit Targets, Stop Loss is at 73.0000!
Warning: This is only for entertainment and opinion purpose. Trading is a risky business, so do your own due diligence, and trade at your own risk. You can loose all of your money and much more.


The world will be a SCARY place if this happens. This is the perfect chart for Halloween.
If this breakout is real and the measured moves get reached - the human race (outside of the WEF oligarchs and their AI technology) is in DEEP TROUBLE.
I predict the much talked about WW3 if this unfolds as per the chart!
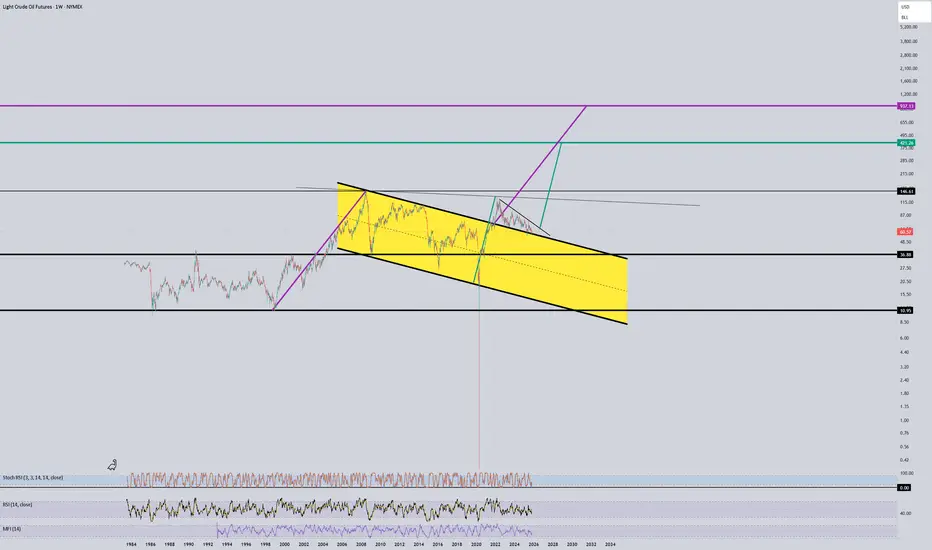
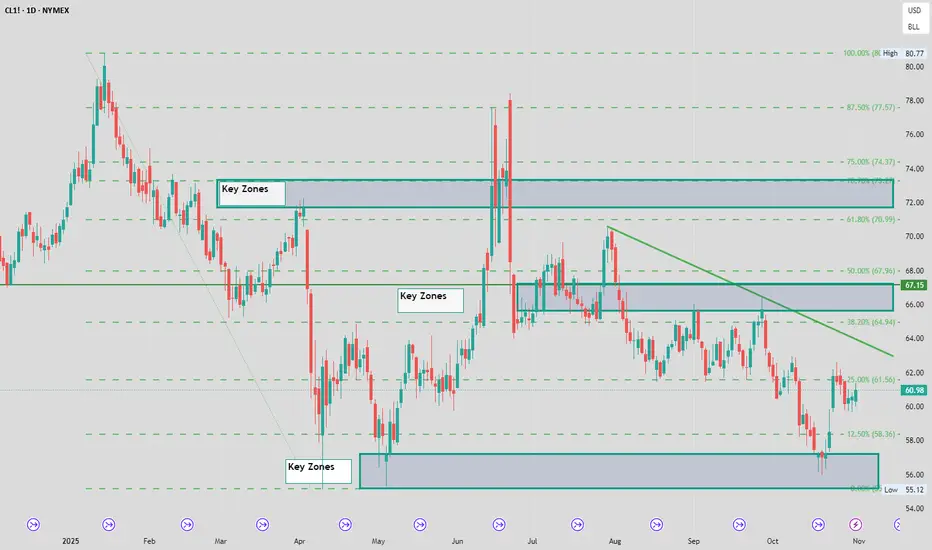
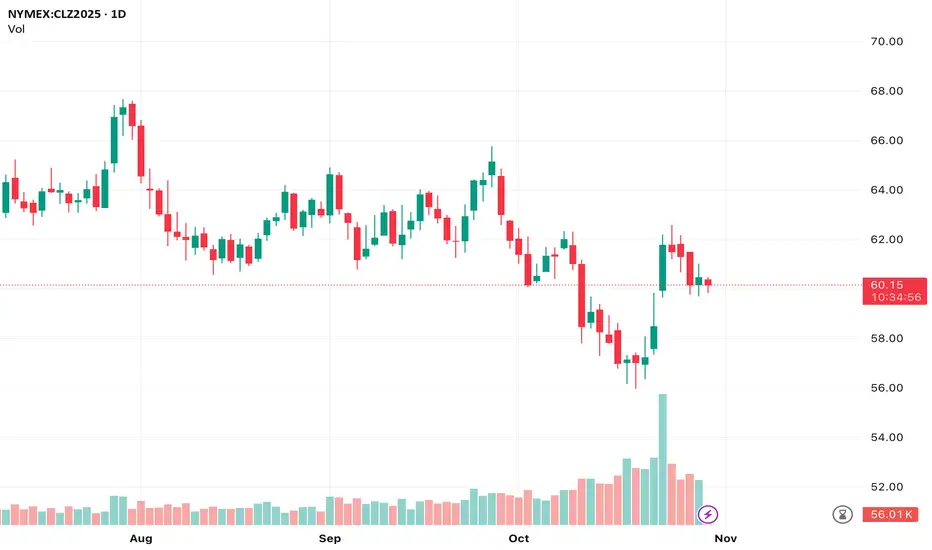
Crude Oil Futures (Dec 2025) Daily Chart Analysis
Crude Oil Futures (Dec 2025) Daily Chart Analysis
Price is trading around 60.15 after a bounce from the 56 area. The recent move up has slowed, shown by smaller candles and reduced volume. Structure shows a lower-high pattern overall, but the market is currently holding above a short-term higher low. This suggests consolidation, not a confirmed trend continuation yet.
Key Levels:
Resistance at 62. Price has rejected this zone twice.
Support at 60. Market is sitting just above this level.
Major support at 56. Strong reaction level where price last bounced.
What I See:
Volume increased on the push up, then faded.
Recent candles show hesitation, indicating indecision.
Price is ranging between 60 support and 62 resistance.
Bullish Scenario:
A break and daily close above 62 would signal upside momentum.
Targets: 64 then 67.
Bearish Scenario:
A break and close below 60 sets up a move toward 58 and potentially a retest of 56.
Current Bias:
Neutral. Price is consolidating. Waiting for a clear breakout or breakdown is prudent.
Range trades are possible between 60 and 62 with tight risk management.
Catalysts to Watch:
Crude reacts strongly to fundamentals including geopolitical events, US inventory data, and OPEC communication. Manage risk accordingly.
Follow for more. Happy Trading.
The Professor
CL1! Outlook I’m anticipating potential buy and sell opportunities on this setup. A confirmed break and retest to the upside will signal a buy continuation, while a confirmed break and retest to the downside will indicate a sell continuation.
Be cautious 😲 with your entries
Crude Oil November Contract Breakdown Setup – 5450 PE in PlayMCX Crude Oil – November Contract
CMP: ₹5398
Bearish view
Holding 5450 Put Option (Expiry: 17 Nov 2025)
Avg Price: ₹251.50
Target: ₹320 to ₹325
Target valid till 14 Nov 2025
Tracking price action closely. Will reassess if momentum fades or structure breaks.
#CrudeOilOptions #MCX #OptionsTrading #TradeSetup #PriceAction #TradingViewIndia #DerivativeStrategy #PutOption
Sell crude oil around 62.00, with a target of 60.00-58.00Crude Oil Market Analysis:
Crude oil has been trending downwards with fluctuations recently. Our strategy remains to sell at higher prices; any rebound is an opportunity to sell. Today, watch for opportunities to sell around 62.00. Currently, the interest rate cut appears to be having an effective impact on crude oil. Our strategy remains unchanged: if it breaks below 60.00, consider selling on any small rebound.
Fundamental Analysis:
The Federal Reserve cut interest rates by 25 basis points as expected. The Fed lowered its benchmark interest rate by 25 basis points to 3.75%-4.00%, marking the second consecutive rate cut at its meeting, in line with market expectations...
Trading Recommendation:
Sell crude oil around 62.00, with a target of 60.00-58.00.

Crude oil MCX towards 5000With the stop loss of 5490 crude heading for 5050 entry at CMP 5380
Risk Reward 2.8:1

CRUDE OILPreferably suitable for scalping and accurate as long as you watch carefully the price action with the drawn areas.
With your likes and comments, you give me enough energy to provide the best analysis on an ongoing basis.
And if you needed any analysis that was not on the page, you can ask me with a comment or a personal message.
Enjoy Trading ;)

Crude Oil is InflationOne of the best ways to gauge where inflation is heading is by tracking the relationship between crude oil prices and the U.S. Consumer Price Index (CPI).
If we take a moment to observe their movement from the 1980s to today, we can see that they have generally moved in tandem. The year of their peaks and troughs are in synchronization.
So, who is leading whom?
Is it the inflation data that drive crude oil prices higher or lower — or is it crude oil prices that influence the inflation trend?
WTI Crude Oil Futures & Options
Ticker: MCL
Minimum fluctuation:
0.01 per barrel = $1.00
Disclaimer:
• What presented here is not a recommendation, please consult your licensed broker.
• Our mission is to create lateral thinking skills for every investor and trader, knowing when to take a calculated risk with market uncertainty and a bolder risk when opportunity arises.
CME Real-time Market Data help identify trading set-ups in real-time and express my market views. If you have futures in your trading portfolio, you can check out on CME Group data plans available that suit your trading needs www.tradingview.com

Crude oil: Sell around 62.50, target 60.00-58.00Crude Oil Market Analysis:
Crude oil fell again, in line with our expectations. Today's crude oil price remains bearish. Sell on any rebound. The strategy for crude oil remains to follow the market. Consider selling if crude oil rebounds to 62.50 today. This level has been successfully suppressed. The impact of crude oil inventory data is only temporary. There are no recent data that will have a significant impact on crude oil prices. Focus on the impact of the Federal Reserve's monetary policy.
Fundamental Analysis:
The previous smooth Sino-US trade negotiations were positive for the US dollar, leading to a sharp drop in gold's safe-haven sentiment. Another major data point this week is the Federal Reserve's monetary policy.
Trading Recommendations:
Crude oil: Sell around 62.50, target 60.00-58.00.
WTI Crude (NYMEX): Reading Regime Shifts & Trims with CCIThis post shows how we use CCI to read regime changes, turn‑backs (hedge/cover), and trim zones on WTI Crude Futures (NYMEX).
Our CCI is free in the TradingView community scripts—search “CCI ” and add.
Why CCI on WTI?
WTI rotates between strong expansions and mean‑reversion. A momentum oscillator that measures deviation from a moving average is a simple way to read those cycles. We use CCI for three things:
Regime Change (bias) — zero‑line cross with rising momentum/velocity.
Risk/Trim — readings that push past ±100 (adaptive bands) then lose momentum.
Turn‑backs (hedge/cover) — a curl against the trend that doesn’t reclaim the zero line.
How to read the chart (1H shown)
Bullish regime: CCI flips green and closes above 0 → bias long until the zero line is lost.
Trim longs: when price runs and CCI spends time > +100, momentum fades (hook down) — take partials.
Bearish regime: CCI flips red below 0 → bias short until zero is reclaimed.
Turn‑back = hedge/cover: in a bearish regime, a yellow “curl up” from red (still below 0) is treated as a countertrend pop — reduce size/cover partials, not a full flip.
Extremes are a risk gauge, not a signal: WTI can stay > +100 or < −100 while the trend persists; wait for momentum to shift.
Playbook (quick checklist)
Long setup
✅ CCI crosses above 0 with slope up
🎯 Add on pullbacks that hold > 0
✂️ Trim when CCI spends time > +100 and hooks down
⛔ Exit/scale out on loss of 0
Short setup
✅ CCI crosses below 0 with slope down
🎯 Add on rallies that fail < 0
✂️ Trim when < −100 and hooks up
⛔ Exit/scale out on reclaim of 0
Settings used (defaults)
Period 14, Smoothing 5, Source HLC3, Sensitivity 6.
Optional: glow on; purely visual.
What’s different in CCI
Double‑EMA smoothing → cleaner waves
Volatility‑adjusted bands around ±100
Momentum/velocity context
Built‑in Buy/Sell + Strong alerts
Add it on TradingView: Indicators → Community Scripts → search “CCI ”.
Note: Educational only; not financial advice.

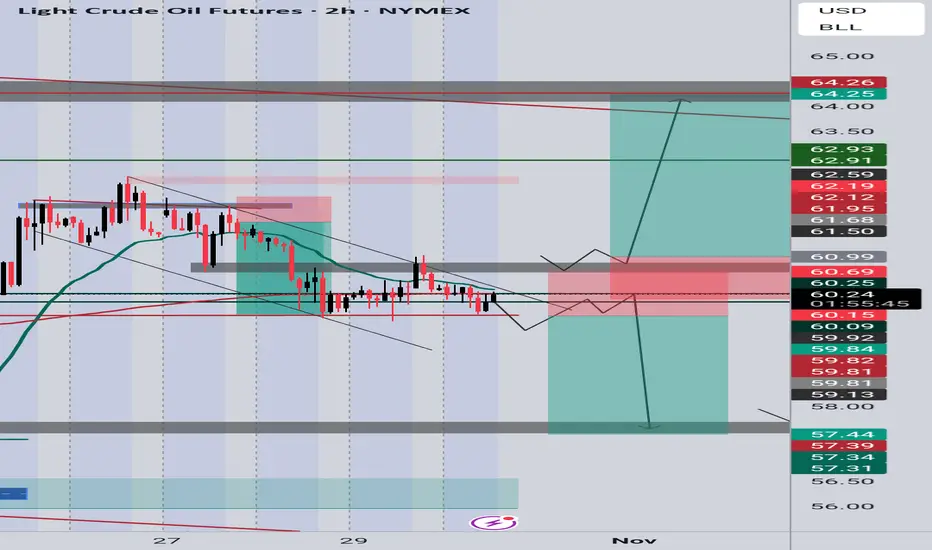
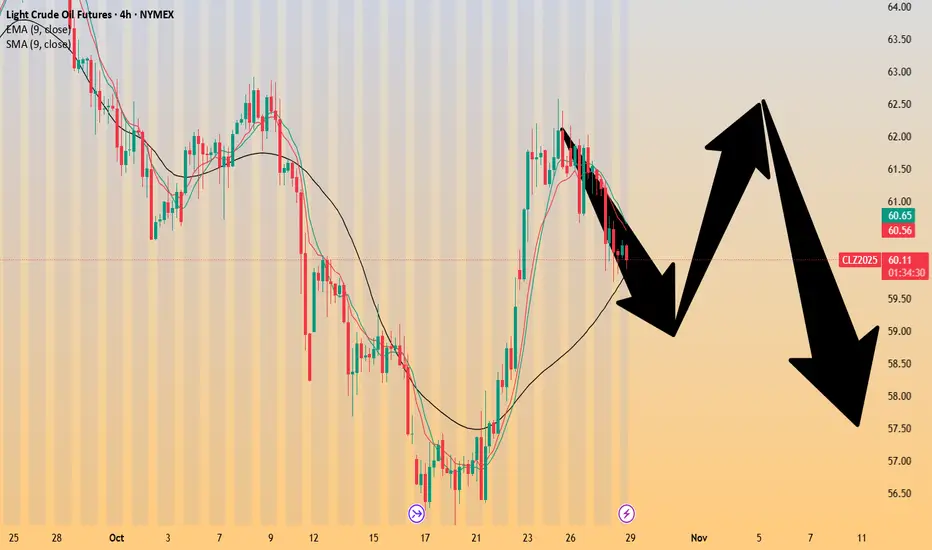
Crude Oil 📊 Crude Oil — 4H Chart | CLZ2025
📉 Current Price: $60.47 (−1.37%)
WTI has broken below the $61.00 support zone, showing short-term selling pressure. However, this move could be part of a technical accumulation phase before a stronger bullish impulse.
🧭 Key Levels:
• Immediate support: $59.50 – $60.00
• Resistance zone: $61.50 – $63.00
• Short-term trend: bearish
• Mid-term outlook: potential reversal
🚀 Projection:
After this short-term downside pressure, I expect a strong recovery move toward the $75–$80 area in the upcoming pre-bullish phase. A confirmed close above $63.00 would likely trigger renewed buying momentum.
⚠️ Watch this zone closely — accumulation here could be the fuel for the next big move.
#WTI #CrudeOil #Futures #CL1 #Commodities #Trading #TechnicalAnalysis #Energy #Oil #4H
