GOLD: Bullish! Look For Valid Buys!In this Weekly Market Forecast, we will analyze the Gold (XAUUSD) for the week of Dec. 1-5th.
Gold rallied last week, breaking the rangy consolidation. The strong close indicates the potential for some bullish follow through going into this week.
Look for valid buys.
Enjoy!
May profits be upon
Contract highlights
Related commodities

GC UpdateGold and silver appear to be stalled out right now, waiting for MFI to hit oversold.
Sucks they hit the sell button right before open, I was carrying EWZ (Brazil) calls overnight. Their market opens before the US, it was up big then reversed when futures went down. Brazil stock market tends to mo

London setup London will create the low of the day & NY session will be a continuation of London session today with greater portion of displacement.
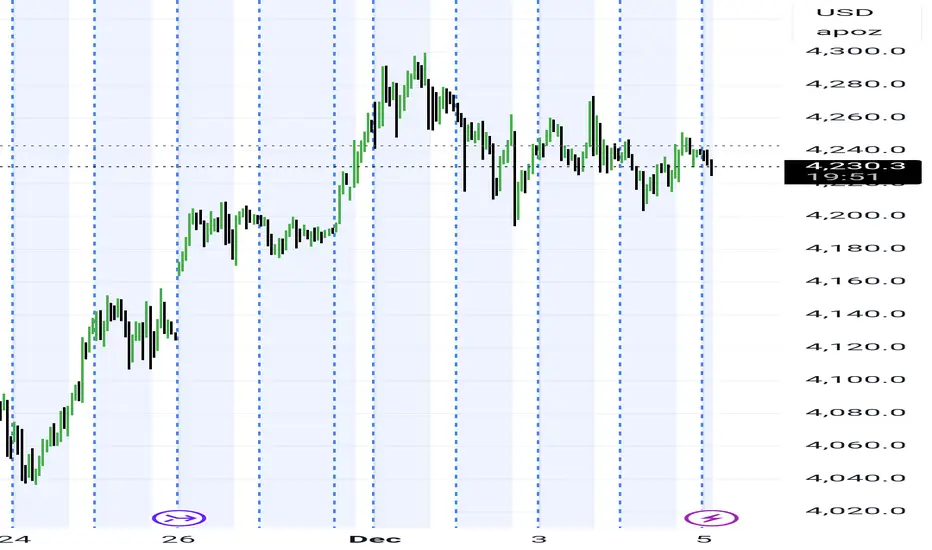
Gold on 01.12.2025Today’s move, right at the London open, pushed gold into the lower zone, where it can be observed that institutions were looking to sweep through the entire fair value area created the previous day. The peak of the move occurred during the cash session, after we reached the POC zone and the 0.6 Fibo

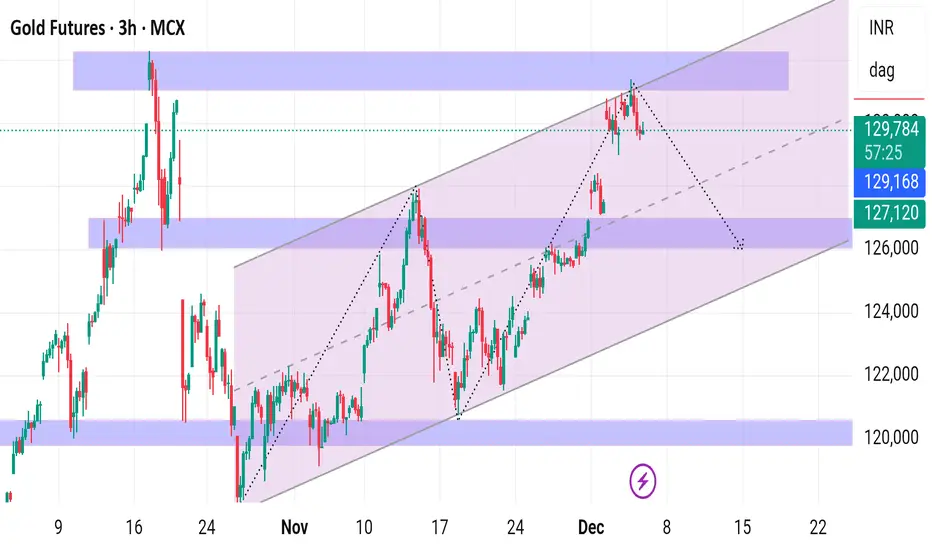
Gold with technical analysis and its key support and resistance Gold with technical analysis and its key support and resistance
Gold is in a rising parallel channel on the 3‑hour chart, currently reacting lower from the upper boundary, so short‑term bias is for a pullback within an overall uptrend.
Key levels to watch are supports near 129,175–127,120 and resis
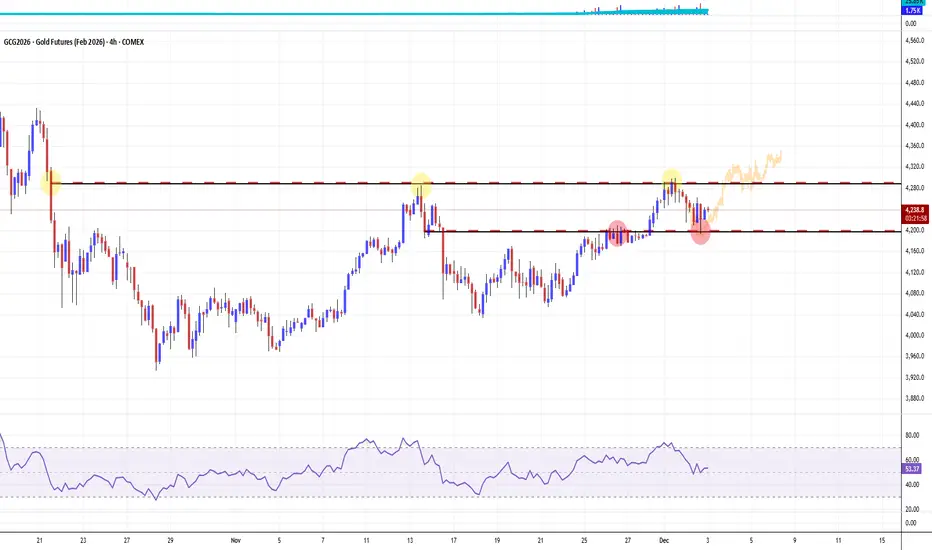
Triple Top - Double Bottom. Go Next Golden Shift4200 for a potential reload (supply area). 4300 - to take it more bag.
GOLD (XAUUSD): bullish-Neutral! Prepare To Buy!In this Weekly Market Forecast, we will analyze the Gold (XAUUSD) for the week of Dec. 8 - 15th.
Gold closed last week indecisive. It has been moving sideways inside a bullish FVG, that continues to act as support.
Prepare for a short term pullback.... and buy it.
Mindful that FOMC is Wednesday,

Silver now at $58.Way back in mid 2023, before gold and silver broke out.
I suggested silver (was $24) tracks gold's performance vs inflation.
Silver now at $58.

Looking to buy GCGC fell on Friday leaving inefficiency above. 4H closed bullish with expansion candle. Looking to buy from 15M engulfed candle (order block). Going for bit more than 2R. 4H candle high is the first target

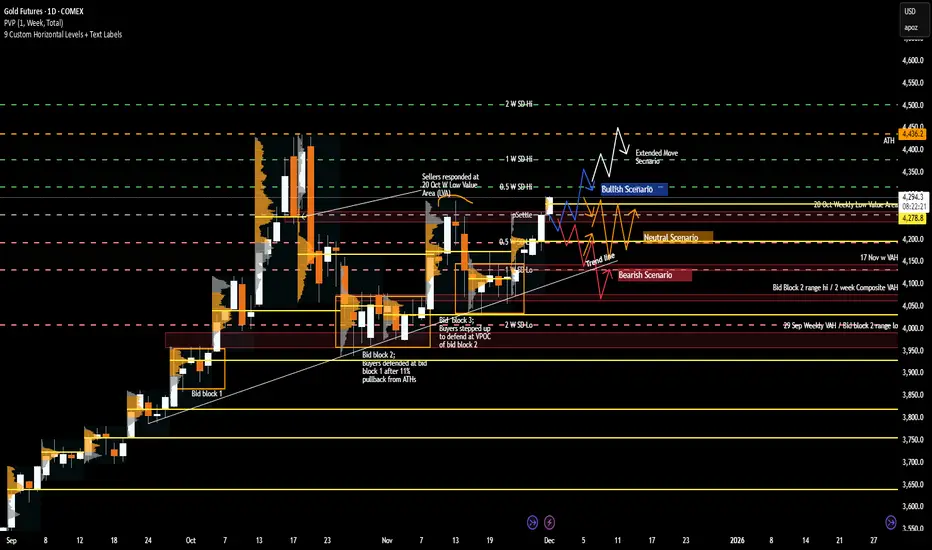
Gold Weekly Playbook: Key Levels, Scenarios & Sentiment Triggers1. Macro Update
Gold continues to trade within a macro environment defined by shifting rate expectations and evolving recession probabilities. With the Fed maintaining a data-dependent stance, the market remains highly sensitive to inflation and employment prints. Cooling inflation supports the ca
See all ideas
A representation of what an asset is worth today and what the market thinks it will be worth in the future.
Displays a symbol's price movements over previous years to identify recurring trends.
Frequently Asked Questions
The nearest expiration date for Gold Futures (Jun 2020) is Jun 26, 2020.
Traders prefer to sell futures contracts when they've already made money on the investment, but still have plenty of time left before the expiration date. Thus, many consider it a good option to sell Gold Futures (Jun 2020) before Jun 26, 2020.