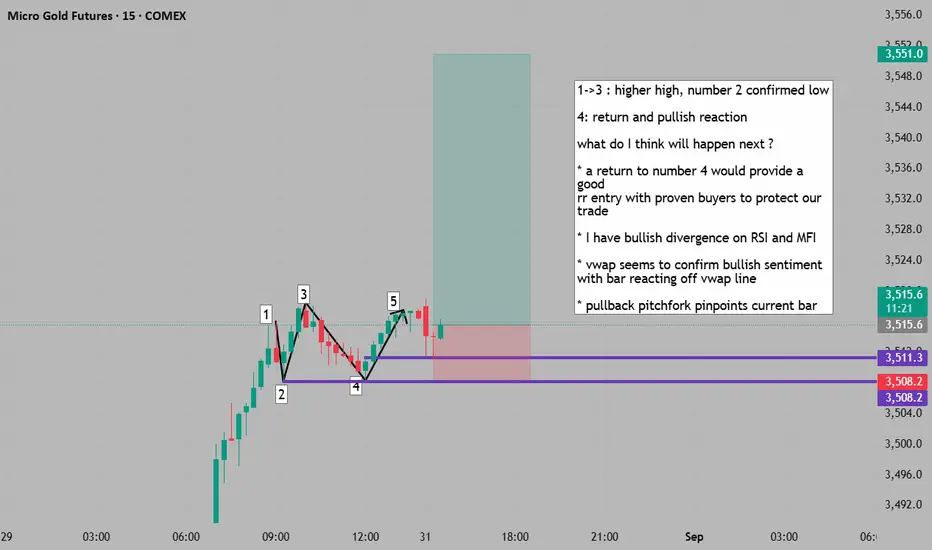
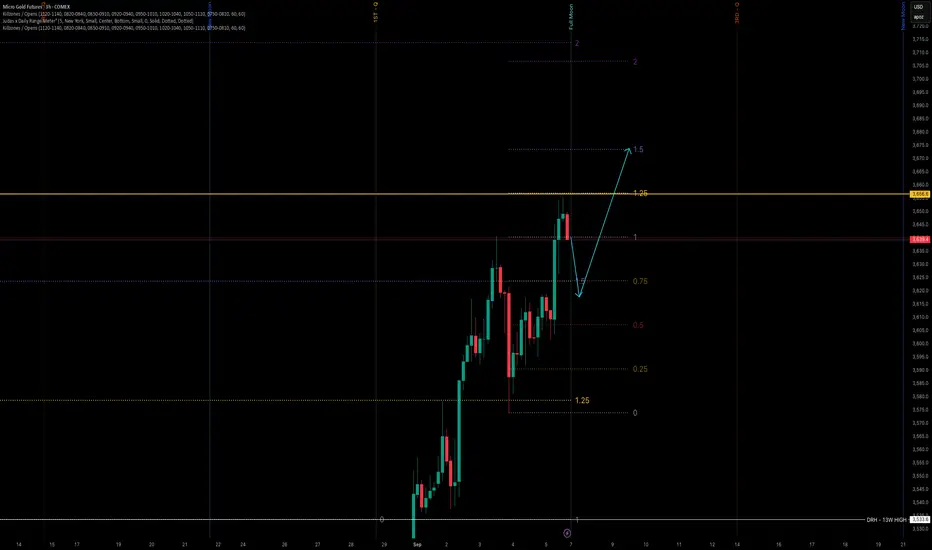
micro pattern provides structure for upward continuation 1->3 : higher high, number 2 confirmed low
4: return and pullish reaction
what do I think will happen next ?
* a return to number 4 would provide a good
rr entry with proven buyers to protect our trade
* I have bullish divergence on RSI and MFI
* vwap seems to confirm bullish sentiment with bar reacting off vwap line
* pullback pitchfork pinpoints current bar
GC1! trade ideas
Sell PositionWe have a break in the 15 minute Candl at 11 o’clock New York time I’m going to sell is the price Reach the top TP at the Fair value gap

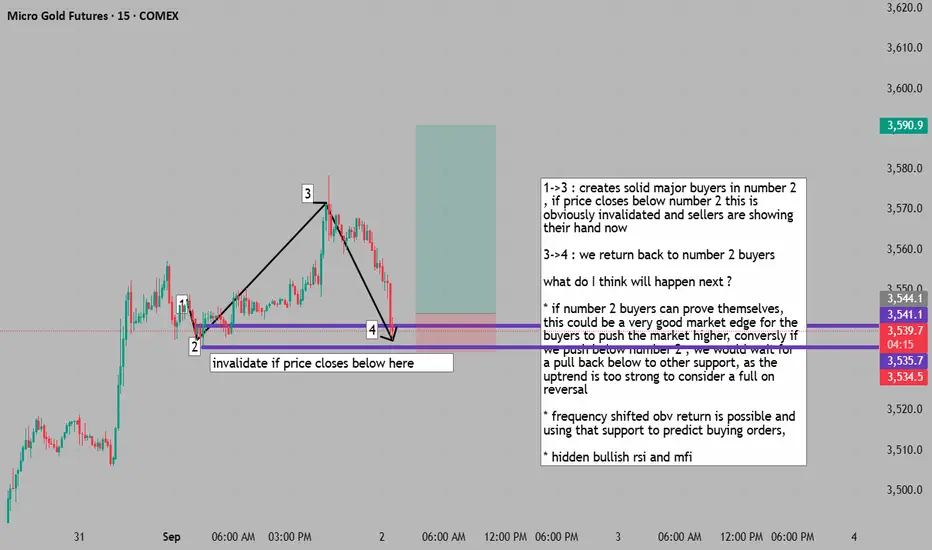
gold is at a decision point to continue upward or retrace furthe1->3 : creates solid major buyers in number 2 , if price closes below number 2 this is obviously invalidated and sellers are showing their hand now
3->4 : we return back to number 2 buyers
what do I think will happen next ?
* if number 2 buyers can prove themselves, this could be a very good market edge for the buyers to push the market higher, conversly if we push below number 2 , we would wait for a pull back below to other support, as the uptrend is too strong to consider a full on reversal
* frequency shifted obv return is possible and using that support to predict buying orders,
* hidden bullish rsi and mfi
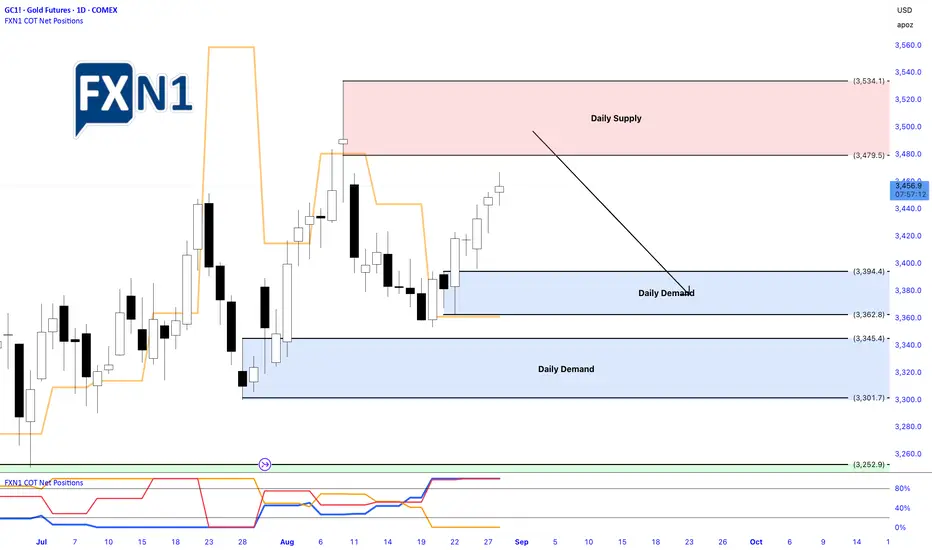
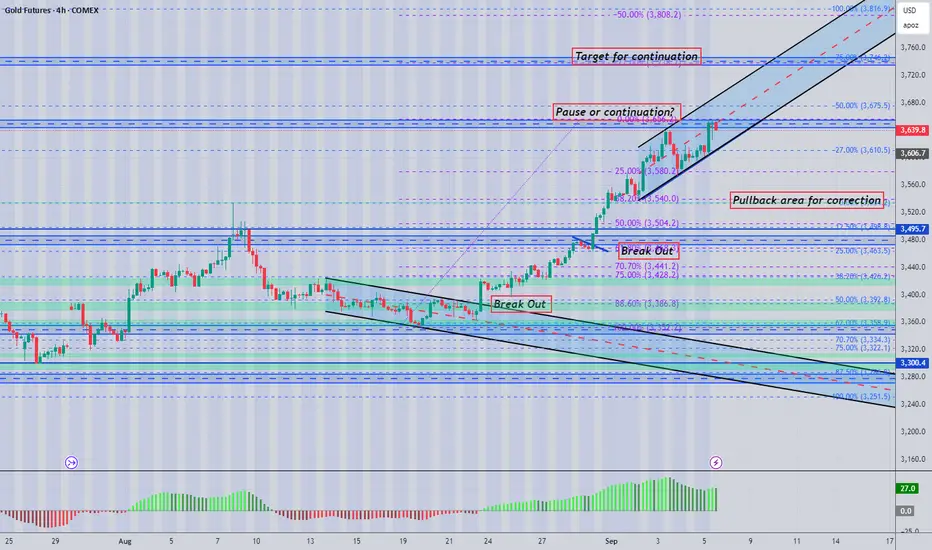
Gold Surge: Preparing for a Possible Pullback at Supply ZoneThroughout August, gold has steadily risen in value, experiencing only minor retracements along the way. Currently, the price is approaching a significant daily supply zone, situated at the top of the market. Recent data indicates that non-commercial traders have been increasing their short positions over the past few weeks, hinting at a potential capitulation or liquidation of positions soon. Meanwhile, retail investors continue to push longs, whereas commercial traders remain positioned more neutrally, gradually adding to their holdings. Moving forward, I will closely monitor the next supply zone, as it could present an ideal opportunity to initiate a short position, capitalizing on potential market exhaustion at this resistance level.
✅ Please share your thoughts about GC1! in the comments section below and HIT LIKE if you appreciate my analysis. Don't forget to FOLLOW ME; you will help us a lot with this small contribution.
GOLD (XAUUSD): Bullish! Look For Buys!In this Weekly Market Forecast, we will analyze the Gold (XAUUSD) for the week of Sept 1 - 15th.
Gold has been ranging for months. August closed strong, above the high of July. I am looking for continuation of this bullish momentum in September.
Wait for buying opportunities. Be patient. +FVGs will form, and present the best POIs for long entries.
Enjoy!
May profits be upon you.
Leave any questions or comments in the comment section.
I appreciate any feedback from my viewers!
Like and/or subscribe if you want more accurate analysis.
Thank you so much!
Disclaimer:
I do not provide personal investment advice and I am not a qualified licensed investment advisor.
All information found here, including any ideas, opinions, views, predictions, forecasts, commentaries, suggestions, expressed or implied herein, are for informational, entertainment or educational purposes only and should not be construed as personal investment advice. While the information provided is believed to be accurate, it may include errors or inaccuracies.
I will not and cannot be held liable for any actions you take as a result of anything you read here.
Conduct your own due diligence, or consult a licensed financial advisor or broker before making any and all investment decisions. Any investments, trades, speculations, or decisions made on the basis of any information found on this channel, expressed or implied herein, are committed at your own risk, financial or otherwise.

Dipping my toes with 1-Ounce Gold Futures CME in 2025 launched a new futures instrument called 1-Ounce gold.
Day trading margin requirement is $16.5 and overnight trading margin requirement is $165.
This has been a great way to start trading in live markets with low capital requirements.
1OZ price action closely mirrors GC gold futures so there is a lot of content and experts that share their ideas about where gold is going.
1OZ is equivalent to 1/100 of Gold Futures and tick sizes are 0.25 equivalent to $0.25.
Great for a beginner like myself to get a feel of the markets to test strategies and also experience the emotions of being in a position; being up and being down. These emotions cannot be simulated when backtesting or paper trading.
While experiencing these emotions, I have been journaling how the trades make me feel and behave. I have learnt more about myself that day-to-day life experiences do not subject me with.
I started my journey mid-2025 and so far I have had more losing trades than wins. However, 0.25 tick only represent 25c I treat it as the paying the market a low-fee for my education.
Who knows if I will be resilient enough to continue this journey in the months or years to come? We all have to start somewhere/sometime. Hope I have the discipline to stay the course and not give up.
Is anyone out there a beginner like myself trading 1OZ? Please comment and tell me how 1OZ has been treating you?

Gold Bulls Eye Breakout, But Caution May Be RequiredI'm seeing a lot of bullish calls for a gold breakout this week, and the contrarian within me suspects this could lead to disappointment over the near term. Even though my core bias is for gold to reach new highs eventually. Today I look at market exposure to gold futures from the commitment of traders report alongside key levels on gold's futures chart.
Matt Simpson, Market Analyst at Forex.com and City Index.

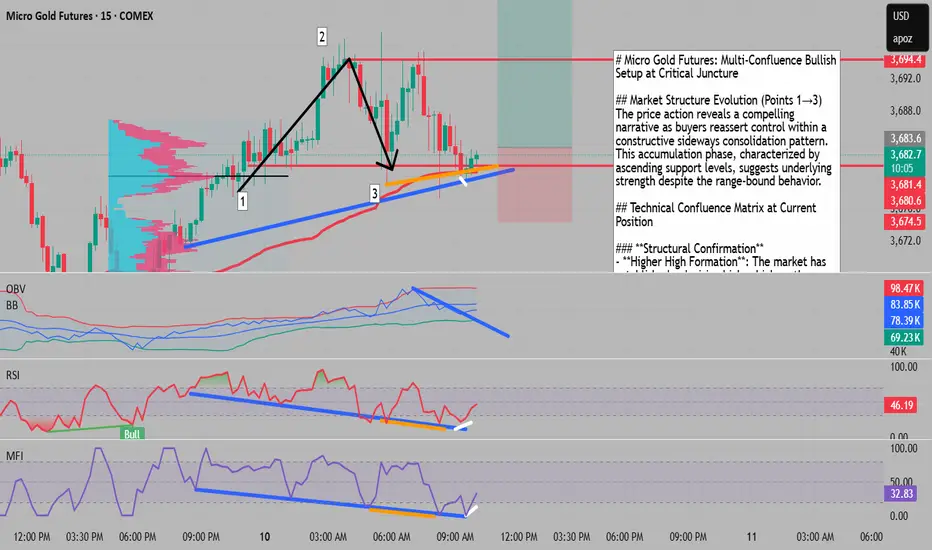
The Golden Trinity: Triple Divergence Confluence at Volume Void # Micro Gold Futures: Multi-Confluence Bullish Setup at Critical Juncture
## Market Structure Evolution (Points 1→3)
The price action reveals a compelling narrative as buyers reassert control within a constructive sideways consolidation pattern. This accumulation phase, characterized by ascending support levels, suggests underlying strength despite the range-bound behavior.
## Technical Confluence Matrix at Current Position
### **Structural Confirmation**
- **Higher High Formation**: The market has established a decisive higher high on the bar-level structure at this precise technical junction, confirming the shift in short-term momentum dynamics.
### **Volume-Weighted Analysis**
- **VWAP Touch Point**: Price has precisely tested the Volume Weighted Average Price anchored from the local market low, providing institutional-level support validation at this critical level.
### **Divergence Trinity Setup**
A rare triple-layered divergence configuration has emerged:
- **Hidden Bullish Divergence**: Suggesting continuation of the underlying uptrend
- **Classical Bullish Divergence**: Indicating potential reversal from oversold conditions
- Both divergences align on the bar-level timeframe, amplifying the signal strength
### **Volume Profile Dynamics**
- **OBV Breakout**: The On-Balance Volume indicator has decisively broken above its downtrend line, signaling a shift in accumulation patterns and renewed buying interest from smart money participants.
- **Low Volume Node Rejection**: Point 3 marks a textbook rejection from a low volume area (LVN), a high-probability reversal zone where price typically finds little acceptance, creating a spring-loaded setup for directional movement.
## Trading Implications
This confluence of technical factors creates a high-probability setup where multiple timeframes and indicators align. The rejection from the low volume node, combined with the structural higher high and triple divergence setup, presents an asymmetric risk-reward opportunity for positioned traders.
## Risk Considerations
While the technical picture appears constructive, traders should monitor the sustainability of the OBV breakout and watch for volume confirmation on any upside continuation. The sideways market structure suggests patience may be required as the accumulation phase completes.
Longing Goldyep, Longing Gold, i mean who would short it anyways.
Iam coming from a very long losing streak so that confirm the move and do your own analysis.
Also just so you know, there is a good chance that i will play out as analyzed, just do your own analysis and if both analysis matches, then take the trade.
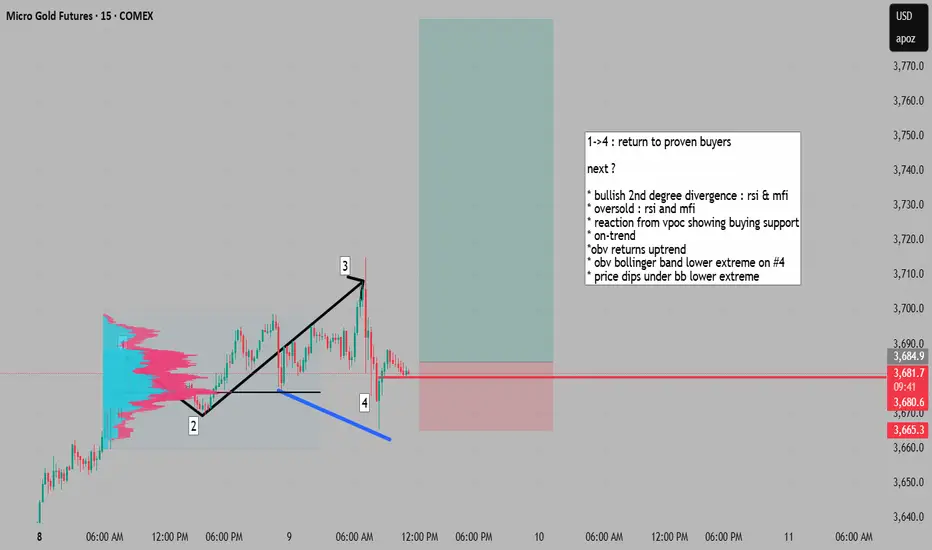
return to proven buyers presents entry at market edge on trend1->4 : return to proven buyers
next ?
* bullish 2nd degree divergence : rsi & mfi
* oversold : rsi and mfi
* reaction from vpoc showing buying support
* on-trend
*obv returns uptrend
* obv bollinger band lower extreme on #4
* price dips under bb lower extreme
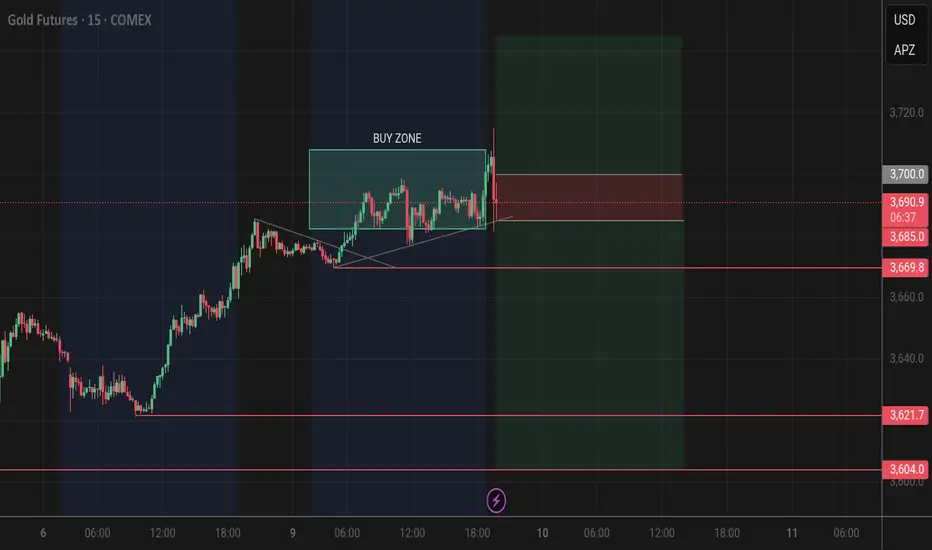
GOLD | Buy & Sell Setup | 09 Sep 2025 – 10:32 EDTGOLD | Buy & Sell Setup | 09 Sep 2025 – 10:32 EDT
Buy Zone: 3709 – 3682
Scenario 1 : Buy
Entry: 3700
Stop Loss: 3685
Targets:
TP1 → 3745 (1:3)
Analysis:
From Buy Zone (3709 – 3682) creates possibilities for a buy move.
Scenario 2 : Sell
Entry: 3685
Stop Loss: 3700
Targets:
TP1 → 3670
TP2 → 3621
TP2 → 3604
Analysis:
Below Buy Zone (3709 – 3682) creates possibilities for a sell move.
Stay alert on updates here.
⚠️ Disclaimer: This idea is shared for educational purposes only and should not be considered financial advice. Please do your own analysis before making trading decisions.
GOLD SHORT TERM VIEWWill look for shorts if we sweep the zone and get a selling confirmation on smaller TF. We can wait for MSS on 1 or 3min TF.

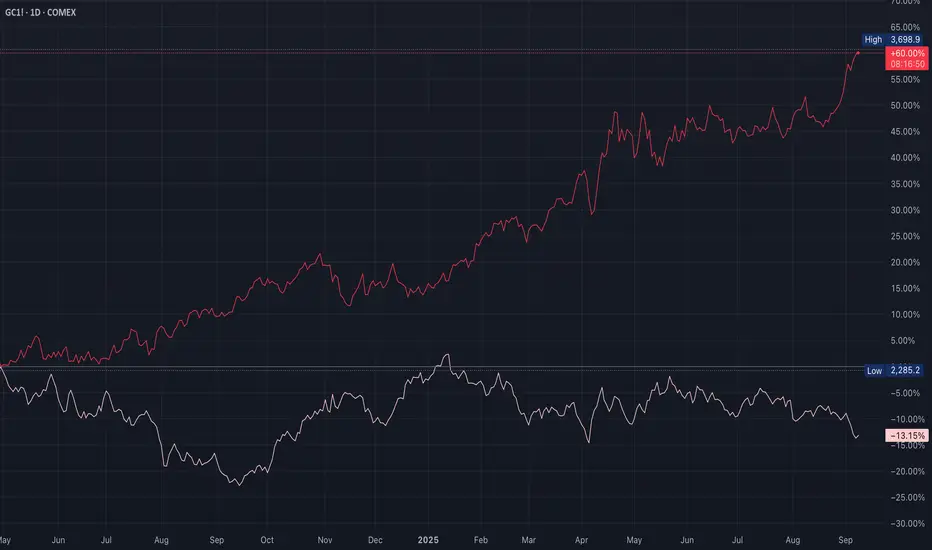
QQQ Macro Stress Gold ripping higher (+60% YoY)
Investors are hedging inflation risk, currency debasement, or policy uncertainty
Gold outperformance shows capital fleeing to “hard money” rather than growth assets
CRBS/US10Y above 8% + US10Y trending down is a classic stagflation warning
Economy faces cost pressures (gold pricing in inflation fears)
Bond market is saying “growth is slowing/policy will ease"
Commodities are saying “inflation pressures are rising"
That’s the exact recipe for stagflation - weak real growth, sticky/accelerating inflation
This is bearish-biased for QQQ unless CRBS/US10Y cools back below +8% because of multiple compression risk - growth narrative struggles if inflation is sticky while real growth is soft
Valuations pressured by elevated yields
No reflationary support from commodities
Historically underperform in stagflation regimes
This setup (gold vertical, CRBS/US10Y sinking) = stagflation hedge regime
QQQ continues higher if yields stabilize & capital rotation pauses (20%)
Possible if Fed pivots or inflation fears calm while liquidity remains strong
QQQ consolidates near highs (30%)
Yields + inflation fears cap upside, but strong AI/earnings narrative prevents a deep selloff
Most likely outcome (50%) is stagflation + sticky yields compress multiples (5%–10% correction risk)
CRBS/US10Y >8% while US10Y trends lower is one of the cleanest stagflation warning signals
For QQQ it usually shifts probabilities heavily toward correction
For gold/commodities it confirms continued strength
Gold Eyes $3,700 Amid Overbought SignalsGold broke out of a multi-month trading range when the spot price finally cleared resistance around $3,450. It took some time for the ascending triangle to play out, and this could mean gold is now on its way towards $3,700. However, the metal has quickly reached overbought levels and may be due for a pause.
Breaking Out
The breakout could be significant and may trigger a move to much higher levels over time; it just doesn’t mean it will all happen at once. One way to measure the breakout from the ascending triangle pattern suggests the precious metal could climb to about $3,700.
The relative strength index also confirms the breakout, rising above a downtrend that had formed between April and August. The rise above the trend line on the RSI confirms the breakout and signals that the consolidation period has ended.
Overbought
However, the precious metal did not take long to reach overbought levels, with its value rising above the upper Bollinger Band and the relative strength index climbing over 70. This could mean that gold is due for a pause—a period of sideways consolidation—before moving on to higher prices.
It could also suggest that the metal is about to run out of steam, having expended too much energy breaking out of the consolidation range, and may be due for a sharp pullback to $3,440 to retest the breakout, or even a decline towards the lower Bollinger Band near $3,200.
Written by Michael J. Kramer, founder of Mott Capital Management.
Disclaimer: CMC Markets is an execution-only service provider. The material (whether or not it states any opinions) is for general information purposes only and does not take into account your personal circumstances or objectives. Nothing in this material is (or should be considered to be) financial, investment or other advice on which reliance should be placed.
No opinion given in the material constitutes a recommendation by CMC Markets or the author that any particular investment, security, transaction, or investment strategy is suitable for any specific person. The material has not been prepared in accordance with legal requirements designed to promote the independence of investment research. Although we are not specifically prevented from dealing before providing this material, we do not seek to take advantage of the material prior to its dissemination.

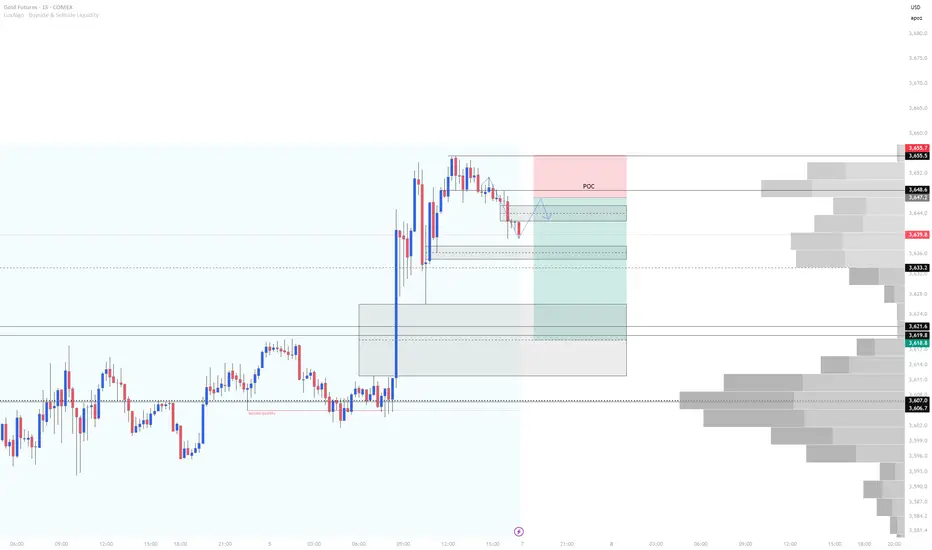
Gold Futures Short Into Asia 9/7/25Based on the current Fair Value Gap (FVG), Order Block (OB), and the liquidity resting below, I anticipate gold will retrace toward the Point of Control (POC) identified on the volume profile. This would provide an ideal setup for short-term selling opportunities during tonight’s PM session.
My expectation is for price to open lower, push into the 3658 range, and present a bearish entry signal. From there, I’ll be targeting shorts toward the equilibrium of the FVG around 3619, which also aligns closely with previous session highs and lows—adding confluence to the setup.
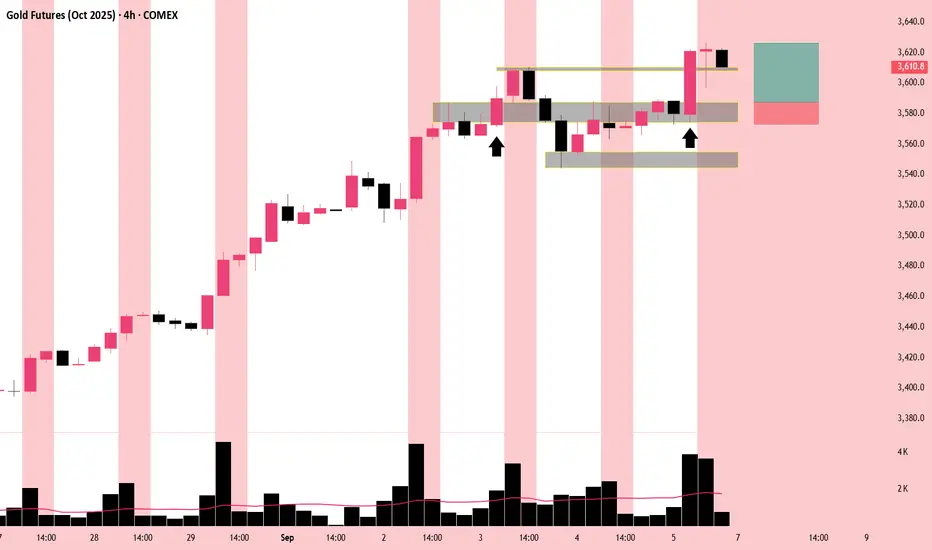
GC 4H icc analysisGold has been in a clear uptrend and ran into resistance between 3574.6/3587.9. Price broke the zone and indicated that sellers were weak above 3587.9, continued to climb making a new high before correcting back below the zone. Once price hit a support, it continued back above 3587.9 aggressively making a new indication and a new high.
Entry: around 3587.9 (after reversal confirmation on 1 hour)
Stop loss: Below last low
Target: Last swing high
Not financial advice.
gold futures analysis past weeks and upcoming weekshowing how gold broke out of long term range and what it may do next

Gold favors buyers between 3570 and 3800 for this next weekLooking at the weekly close gold for the 2nd week in September favors bulls between 3570 and 3800

Gold thoughts after strong week A breakout on Gold and everyone remains a buyer of the dips
I have mapped out key levels, at these levels look for a setup for next move .
good luck
MGC WEEK 37 SEPT 7TH USD look to be bearish and is likely to run for higher TF equal lows.
- That being said MGC can take a small pullback and give another leg higher
if price drops below 3620 the you are offside and should be looking for lower prices and a retracement.
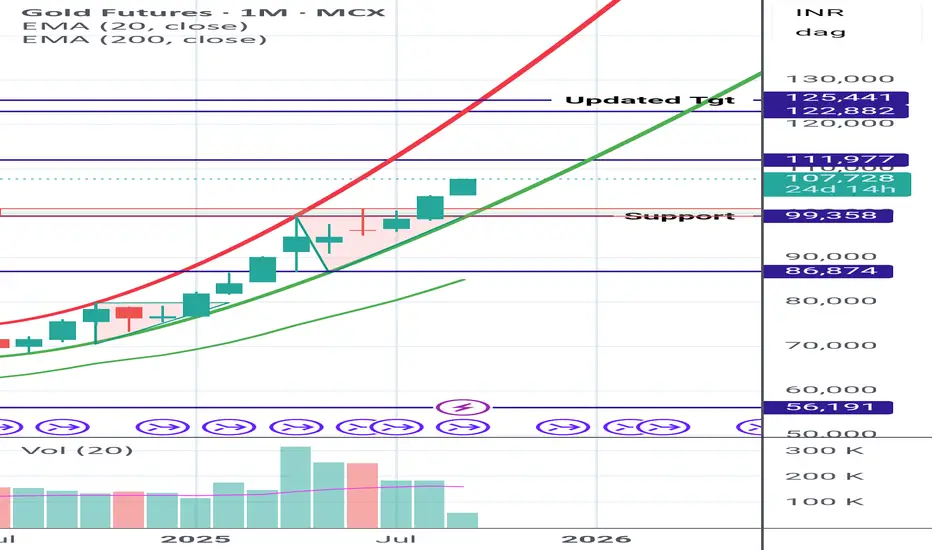
Gold Futures - Going to be a Dream for Many Gold : Going to be a Dream for Many.
*Gold Not to be Sold*✨✨
Support and Updated Tgt are marked in Chart itself.
Note : This is my Personal view based on chart pattern and My STUDY.
Kindly do your research and don't get biased by my view
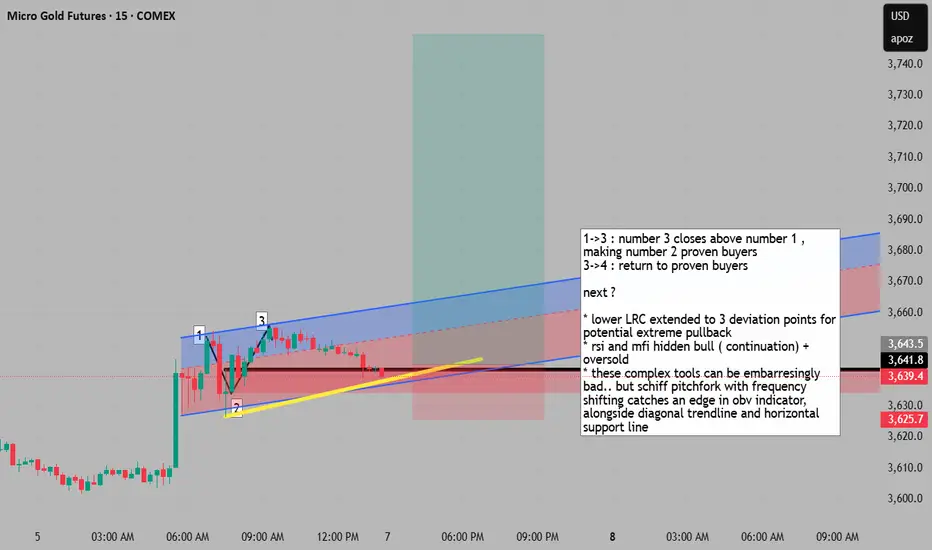
gold is at the edge of pullback if structure is correct 1->3 : number 3 closes above number 1 ,
making number 2 proven buyers
3->4 : return to proven buyers
next ?
* lower LRC extended to 3 deviation points for
potential extreme pullback
* rsi and mfi hidden bull ( continuation) + oversold
* these complex tools can be embarresingly
bad.. but schiff pitchfork with frequency
shifting catches an edge in obv indicator, alongside diagonal trendline and horizontal support line