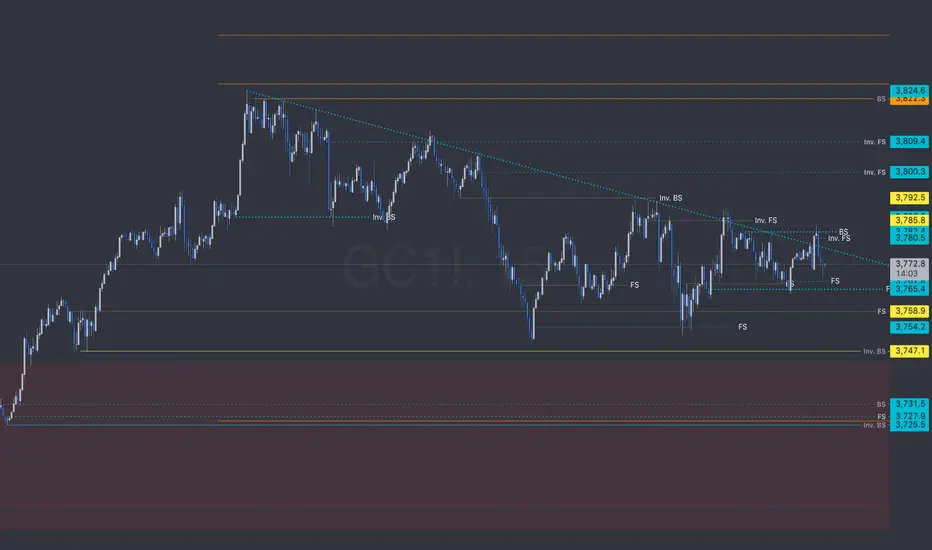
GC 9/2615min TimeFrame.
I didn't post yesterday but I updated the levels as if I did and made them dotted as "tested"
dashed lines = "untested"
dotted 2x = origin levels where trends originate / bridge&Flip scenarios.
Yesterday we saw how pandora's box operates by laddering into a wedge. We'll watch as it breaks tomorrow.
at a quick glance it looks like a 15min timeframe is where $ is at. I didn't follow the breadcrumbs into the 5min timeframe but sure there are levels down there influencing price and break out scenario better than the 15min timeframe but we'll still see it breakout.
GCM1991 trade ideas
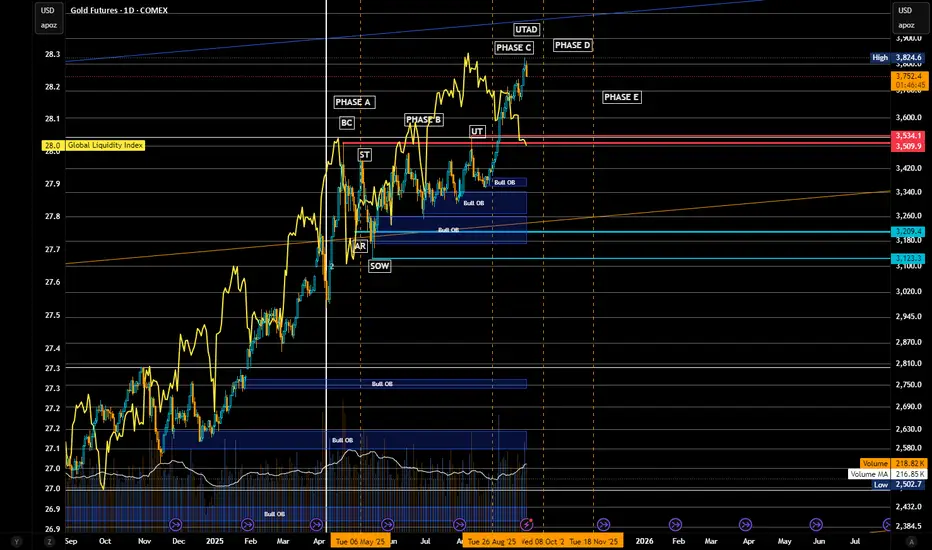
Gold Futures (GC) – “Top Is In” Schematic ReviewExecutive Snapshot 🧭
Primary stance: Bearish swing/top-in thesis (Wyckoff Distribution complete via UTAD).
Bias strength: High, while price remains below 3,825–3,860 and fails to accept above.
Game plan: Fade strength into supply; look for Phase D → E breakdown confirmation → target 3,534/3,509 → 3,209 → 3,123 then extended 2,970–2,795 if momentum accelerates.
Multi-Framework Confluence:
A) Wyckoff (your schematic) ♟️
Phases:
A/B: BC/ST established range highs; AR/SOW tagged mid/low of range.
C: UT → UTAD (new high on diminishing relative spread & mixed volume).
D (now): Throwback rallies holding beneath UTAD; look for LPSY near 3,760–3,825; failure → Phase E markdown.
Validation: Lower highs after the UTAD and repeated rejections of the supply shelf 3,760–3,825.
Confirmation trigger: Break and accept below ICE/Creek = 3,534–3,509 (your pink band) → distribution confirmed.
Macro Frame 🌐
Gold’s cyclical up-leg is extended; near-term macro supports a pause/reversion:
Real yields/beta & USD shocks can catalyze a value-seeking dip.
COMEX time-and-price run suggests heat above without equivalent build in value → mean-revert first, trend later.
Invalidation & Risk:
Hard invalidation (swing): Weekly close > 3,860 and acceptance above for 2–3 sessions (no swift rejection).
Soft invalidation (tactical): Daily close back inside 3,760–3,825 after a breakdown → step aside, wait for next LPSY.
Position/Risk Template:
Initial risk: above 3,825 (or 3,860 for wider swing).
Size: start ½–⅔ unit at first tag/reject; complete size on breakdown retest of 3,534–3,509.
Trailing: swing stop > last LPSY high once 3,534 is lost.
Momentum & Internals (Quick Read) ⚙️
RSI/ultimate RSI (your panels): persistent bearish divergence into UTAD zone.
MACD: high, curling; ripe for signal cross on daily if price slips under 3,600s → 3,534.
Squeeze/Momentum: elevated; release down would align with the distribution thesis.
Execution Checklist ✅
Pre-break:
Fade 3,760–3,825 on rejection candles/footprint absorption.
Track delta & volume—no expansion = stronger distribution read.
Break event:
Daily close < 3,534 → reduce discretion, execute plan; seek retest → LPSY to add.
Manage:
Cover +30–50 handles into 3,209–3,180; roll runner.
Data to watch: USD DXY spikes, GLD OI/put skew, dealer GEX flips around GLD 300.
One-Page Risk Map 🗺️
Bearish while: < 3,825–3,860.
Confirmation: < 3,534–3,509 (close/accept).
Targets: 3,209 → 3,123 → 2,970 → 2,795 → 2,541.
Stop/Invalid: > 3,860 w/ acceptance.
Marked UTAD and supply stack 3,760–3,825 present a clean risk-defined top. Until the market accepts above 3,860, the probabilistic path favors Phase E markdown back toward 3,2xx value and possibly the 2,9xx–2,795 extension if momentum breaks loose.
Global news might have us Stalling on Gold! Chart Context (MGC Futures, H1/H4)
Price stalled out after rejecting the H4 bearish zone (3791.4–3769.9).
Yesterday’s downside move lost steam before fully reaching the deeper H4 bullish demand (3746.3–3735.2).
We’re now compressing between Daily High (3792.1) and Daily Low (3752.0).
Fundamentals:
U.S. geopolitical/military headlines (Defense Secretary Pete Hegseth ordering hundreds of generals/admirals to an urgent meeting at Quantico, Sep 30) are creating uncertainty, which could trigger safe-haven flows in gold.
Bias Going Into Friday:
Watching for liquidity sweep of yesterday’s lows (~3752/DL). If swept and reclaimed, could trigger bullish continuation.
Alternatively, a clean break & hold above yesterday’s high (~3792/DH) sets up momentum longs targeting 3812+ (previous imbalance).
No trade in the middle of the chop — patience until liquidity is taken on one side.

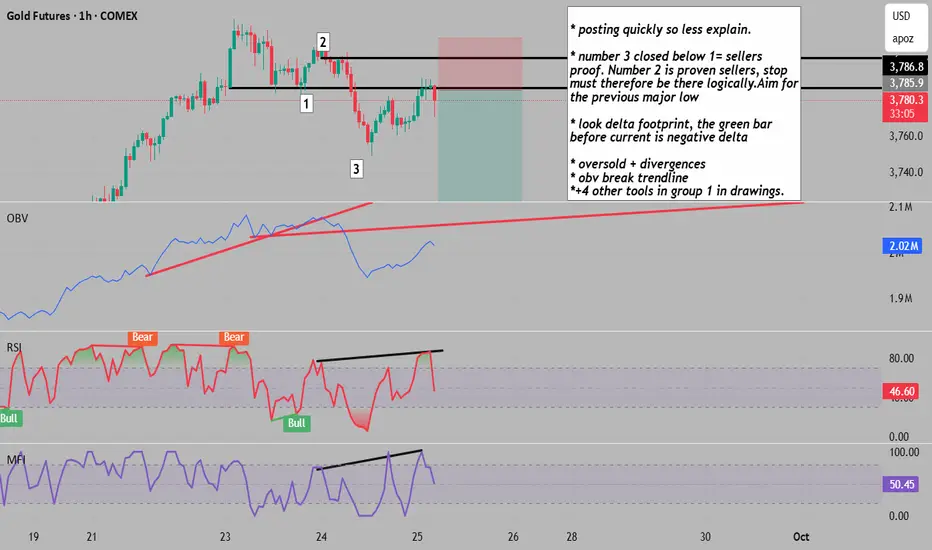
quick selloff entry opportunity
* posting quickly so less explain.
* number 3 closed below 1= sellers
proof. Number 2 is proven sellers, stop
must therefore be there logically.Aim for
the previous major low
* look delta footprint, the green bar
before current is negative delta
* oversold + divergences
* obv break trendline
*+4 other tools in group 1 in drawings.
Gold Futures – Pullback Into H4 Supply Before Drop to Demand?Price sold off strongly from 3812 resistance and is now correcting higher. On the H4, I see a bearish supply zone between 3791.4–3769.9, which aligns with prior POC acceptance around 3790. If price pulls back into this area and fails, I expect continuation lower into the H4 demand zone at 3746.3–3735.2, which also lines up with Daily Low (DL) and Weekly High (WH) liquidity markers.
Levels to Watch:
Bearish H4 Supply: 3791.4–3769.9
Bullish H4 Demand: 3746.3–3735.2
Invalidation: Break & hold above 3795 could target 3812 liquidity.
Targets: First 3746.3, extended 3735.2.
Bias: Bearish pullback scenario into supply → downside continuation.

Gold Buy ModelAs we all know, gold has been trending up for quite some time now. With Fed Chair Roman Powell speaking about rate cuts in the future, this means that Gold is going to want to continue trending up.
Lower interest rates can also weaken the U.S. dollar, making gold cheaper for foreign buyers and increasing demand.
I do think gold will continue to trend higher, but I'd love to see a sweep of Asia session lows, potentially testing PDL before this happens. My area of interest is right around $3780 to $3775.

GC pink colors are monthly levels
grey are weekly levels
red are daily levels
orange are 4hr levels
blue 15min levels
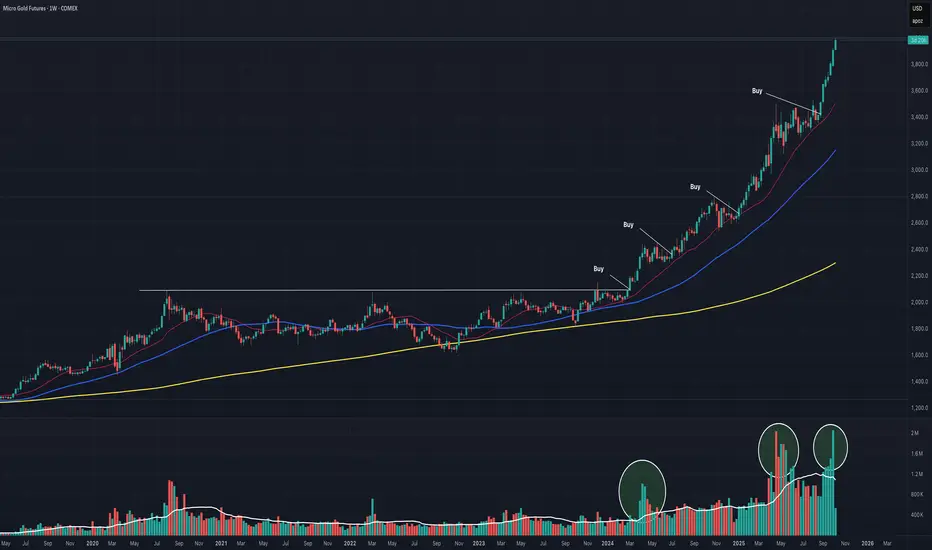
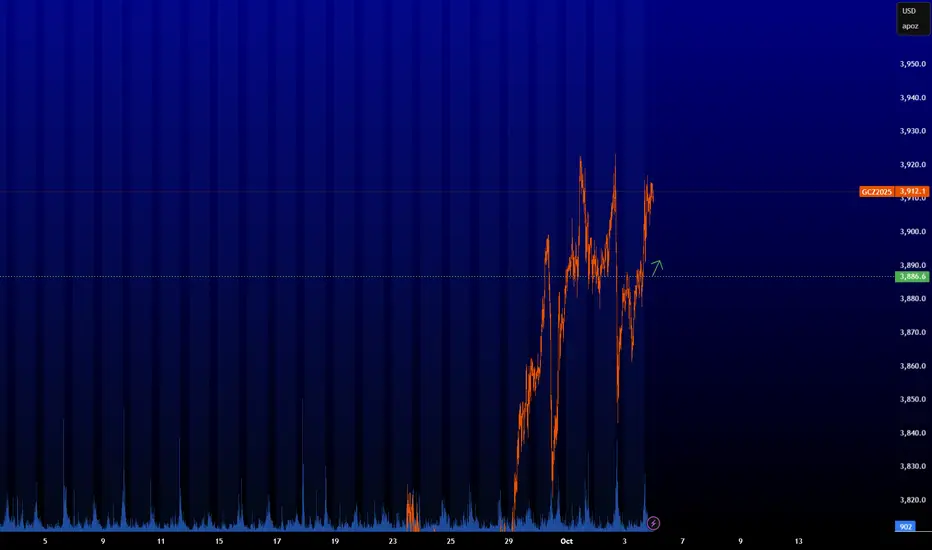
Gold Approaching the $4,000 Target: A Campaign Five Years in theGold continues to advance toward a key target level that was first identified in 2019. The metal is now just seven points away from $4,000, marking significant progress in a multi-year campaign.
In 2019, a position was opened in GLD (the gold ETF) based on Point and Figure (PNF) chart counts that revealed two major price targets. The first target was above $2,000, which gold reached before entering a very prolonged trading range. The second projection pointed to levels above $4,000—the target now within reach.
That original GLD position remains open, as the price action continues to align with the projections from the Point and Figure analysis.
Gold currently sits just seven points from the $4,000 mark. The expectation for gold to move above $4,000 has been in place for quite some time, and the market is now positioned at this critical juncture.
There are specific levels that need to be overcome for gold to successfully breach the $4,000 threshold. The current market structure includes what appears to be a last speculative move up.
The most recent triangular reaction in gold's price structure is notable for being the largest one in the current campaign. This larger consolidation pattern indicates that supply is now influencing price more significantly, particularly after an opposing force has entered the market.
When an opposing force comes into the market in this manner, the swing structure pattern suggests a specific sequence: a reaction followed by a climactic run. The question now is whether this pattern could carry gold above the $4,000 target.
So far, gold remains on the trajectory toward exceeding $4,000. The combination of the Point and Figure count projections from 2019 and the current swing structure dynamics support the view that gold is positioned for this move.
The coming price action at and around the $4,000 level will determine whether this campaign, which began over five years ago, can achieve its second major target.
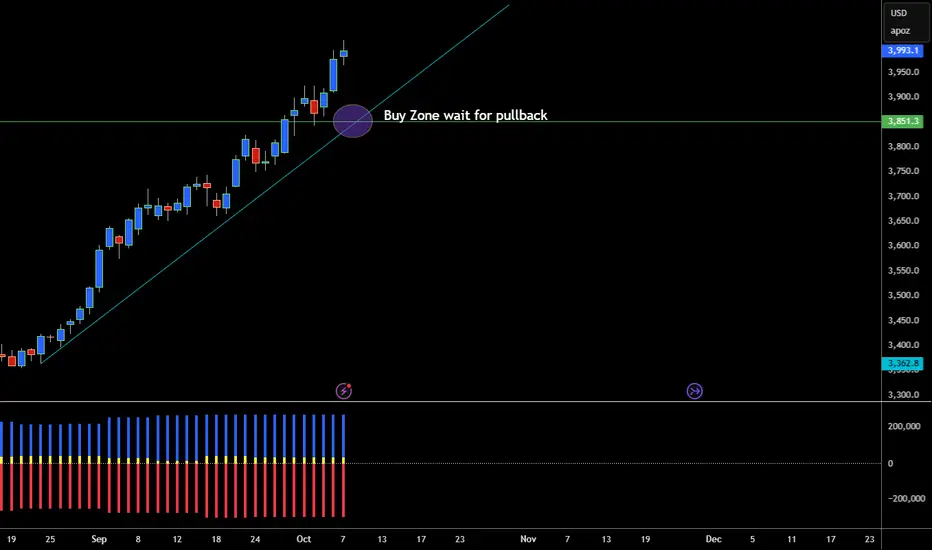
GOLD MARKET FLYING HIGH BUT LOOKING OVERBOUGHT?Hey Traders another week in the life of trading so today we are looking at Gold. Talk about a rally this thing has some serious momentum!
Gold has officially launched from it's rocket ship🚀
So where are we now?
I mean imo I think we are really overbought and at least due for some time of correction. It's kind of hard to make $$$$ buying at the high.
However the trend is our friend and we are definetly in an uptrend so best way to trade the trend is buy when market pulls back to the trendline.
Scenarios today are:
Bullish- I would say 3850-3900 looks like a good place where the market could pull back before getting back onboard the rocketship. Looks like good area to buy with risk stop below support around 3800 or lower.
Bearish- Would not consider shorting at this time unless market forms some type of top formation or at least breaks below really significant support like 3800.
Commitment of Traders- The Funds are long Gold with 267,000 long positions once they get to 300,000 last time history shows they start closing out some of those longs before they buy back in this can cause market to fall. But overall they are still extremely bullish but soon they are going to become imo overcrowded bullish and thats when the market can sell off dramatically. There is no report friday because of govnment shutdown so we will have to wait until report resumes to see the Funds Next Move.
Good Luck & Always use Risk Management!
(Just in we are wrong in our analysis most experts recommend never to risk more than 2% of your account equity on any given trade.)
Hope This Helps Your Trading 😃
Clifford
RISK DISCLOSURE
TRADING IN THE FUTURES AND FOREX MARKET INVOLVES SIGNIFICANT RISK. ALWAYS CONSULT A FINANCIAL ADVISOR AS HIGH RISK ASSET CLASSES MAY NOT BE SUITABLE FOR ALL INVESTORS. THIS IS NOT A RECOMMENDATION TO BUY OR SELL ANY ASSETS. ALL IDEAS ARE MADE FOR EDUCATIONAL PURPOSES. PAST PERFORMANCE DOES NOT GUARANTEE FUTURE RESULTS.
CFTC RULE 4.41 – HYPOTHETICAL OR SIMULATED PERFORMANCE RESULTS HAVE CERTAIN LIMITATIONS. UNLIKE AN ACTUAL PERFORMANCE RECORD, SIMULATED RESULTS DO NOT REPRESENT ACTUAL TRADING.
3700This channel is not providing individualized trading or investment advice, nor is it a banking service, brokerage service, trading service, investment service or money management service

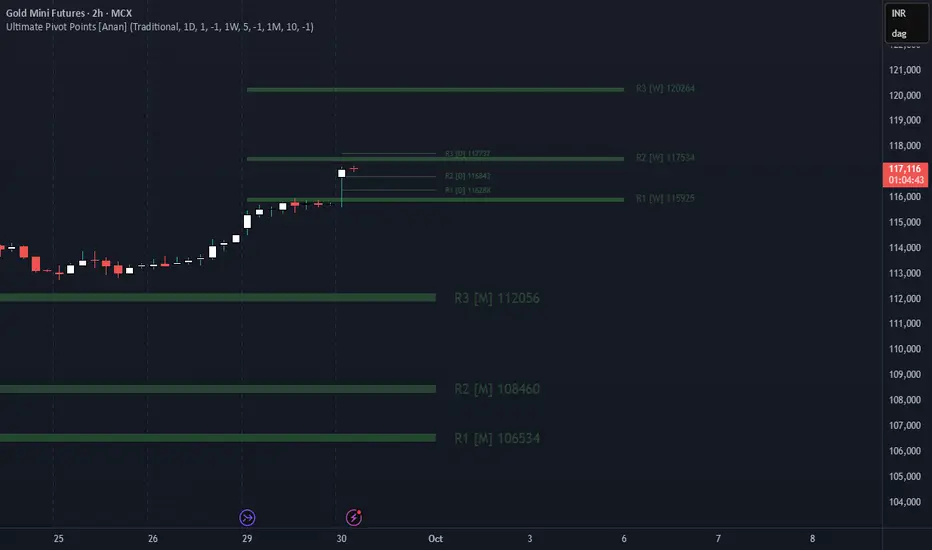
Will Gold (Spot) Test $4,000/oz or Gold is Becoming UnsFall DownGold is Becoming Unstoppable
Made a New Record High of +3976.5
- But Will It Rise Further? Will it Test $4000 per oz?
or
- Will Fall Down From Here (The New ATHs) ?????
Taking reference from the Gold Futures Market
- Gold futures already & officially hit $4,000/oz for the first time in history.
- Generally, it is expected that the spot price & the futures prices converge as the contract expiration date approaches
- That means at expiry, gold spot & future must attain the same level
That means the spot might rise to 4000, or the future price might fall from 4000
The attached Gold mini future chart says that gold prices might fall from current levels

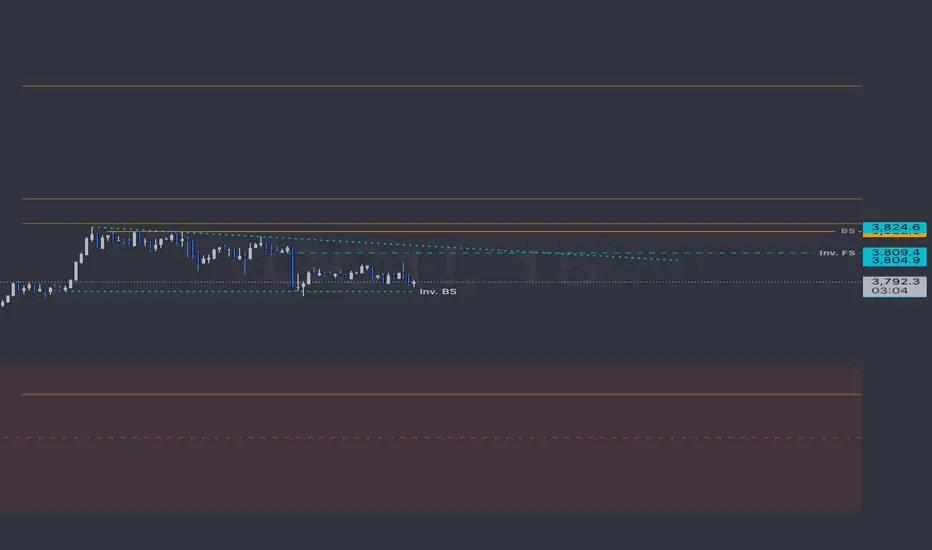
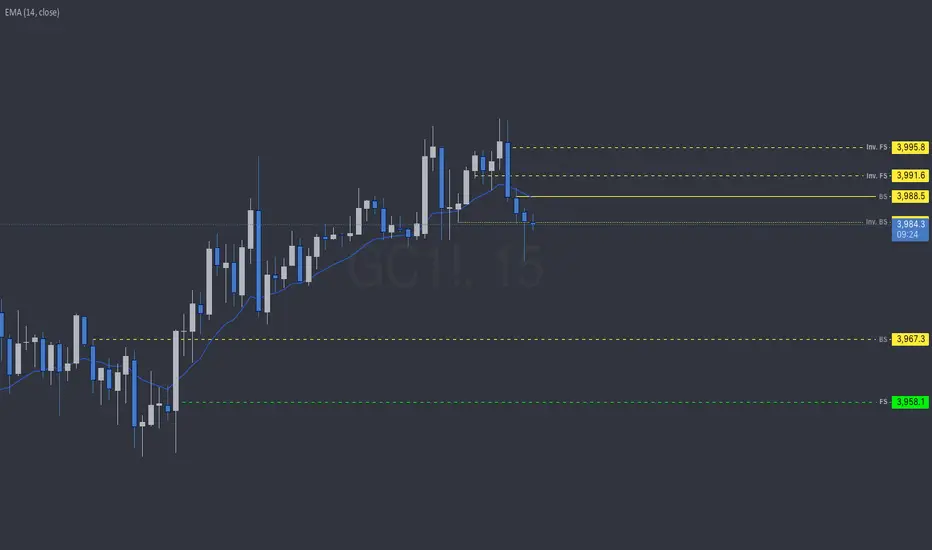
GC - Hourly ideaJust marked the hourly resistance levels as Inv.FS and the solid line BS
support is below price BS dashed line is the hourly level and the green dashed line is the 5min timeframe FS
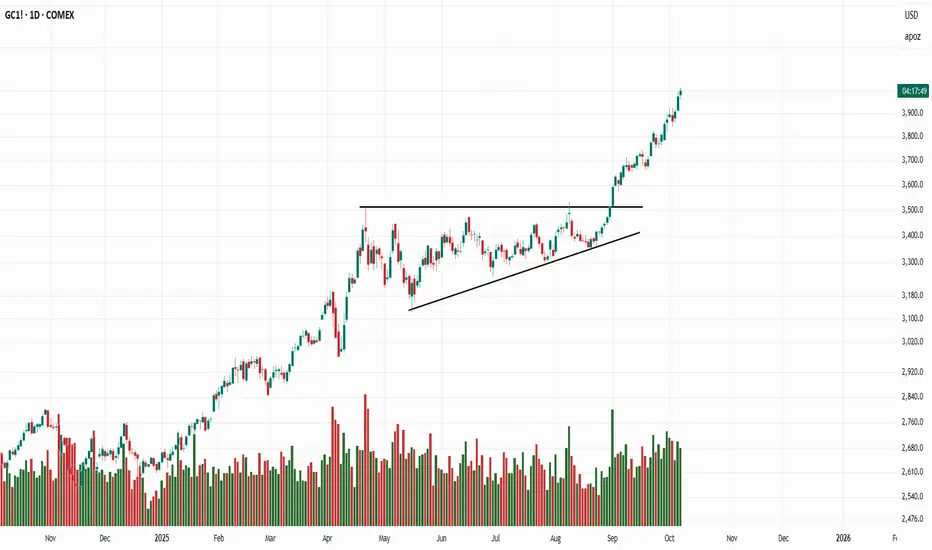
Gold’s Epic Breakout | Parabolic Curve with Flag & Pennant SetupWhat a run for Gold (GC1!) — a powerful move years in the making.
After a long, flat base from Sept 2020 to March 2024, gold finally broke out and has been trending with incredible momentum ever since. If you missed the initial breakout, there were multiple clean reentry setups along the way — offering low-risk, high-reward opportunities.
Each pullback to the 10- or 20-week line formed classic bull flags and pennants, providing continuation entries within a larger parabolic curve structure.
The overall pattern shows acceleration — each base gets shorter, steeper, and accompanied by expanding volume, the hallmark of a strong parabolic trend.
So while the macro trend is parabolic, the buy points were tactical — small, high-probability continuation setups that allowed traders to compound gains without chasing.
MCX Gold Futures – Intraday Analysis for 7th Oct 2025MCX:GOLD2!
Gold is trading at 121,603, consolidating just above the zero line (121,583), after a breakout above resistance, followed by mild profit-taking. This is a key inflection zone for either a momentum extension or a retracement.
Bullish Scenario
Long Entry (121,321):
Initiate fresh longs above 121,321, confirming buyers supporting every dip at trend breakout levels.
Additional exposure can be taken at 121,145 (add-long area) if minor dips are absorbed, marking higher lows.
Upside Targets:
122,504 (Target 1): First mapped supply zone and profit booking area.
123,073 (Target 2): Extended bullish target if strong momentum continues.
Stop Loss:
Place below 120,969 (short entry) or progressively trail as price moves up.
Bearish Scenario
Short Entry (120,969):
Shorts trigger below 120,969, marking breakdown of support and handed control back to sellers.
Downside Targets:
120,662 (Target 1): Demand zone and first logical bounce/support area.
120,093 (Target 2): Next extension target for aggressive move.
Stop Loss:
Cover shorts if price retakes 121,321 to avoid losses on failed breakdowns.
Range/Neutral Logic
Zero Line (121,583):
Price at zero line marks market balance; sustained action above encourages further momentum, while repeated rejection here raises risk of short-term pullback to lower supports.
Avoid new trades around zero line unless breakout/breakdown conviction emerges.

GC : Long levelThe level has been activated, so you can buy it. I have slightly edited it since last time. It is best to scalp or pip it; I cannot promise any significant movement. Be careful when trading on news or at market close/open.
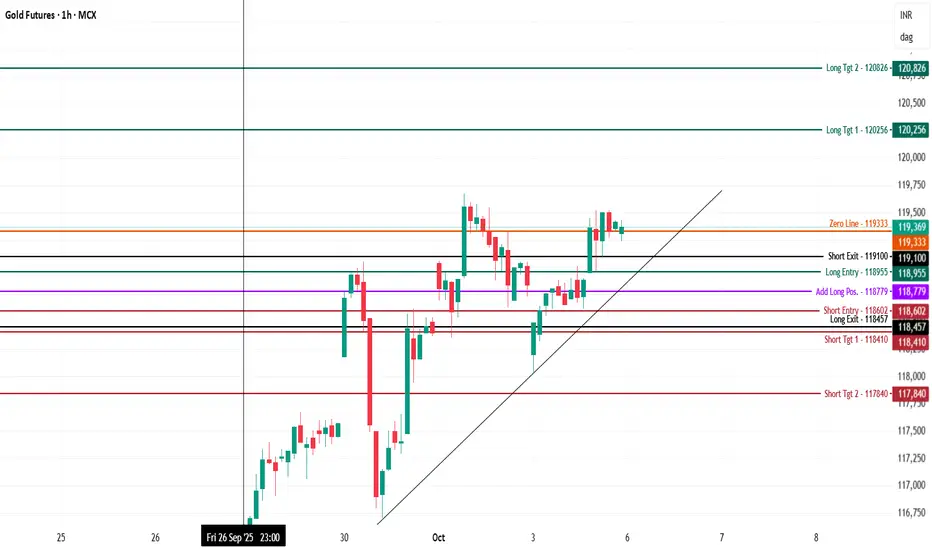
Gold Dec. Futures (MCX) – Intraday Analysis 6th Oct., 2025MCX:GOLD1!
Gold is consolidating at 119,369 after a strong bounce, with price action pressing against a pivotal resistance area (zero line) and testing higher-low support in a sideways-to-bullish formation.
Bullish (Long) Setup
Long Entry (118,955):
Fresh longs are actionable above 118,955 with price holding above recent swing support, confirming buyers’ intent for further upside.
Adds can be managed at 118,779 if dips hold with rising volume and higher lows.
Upside Targets:
120,256 (Target 1): First mapped supply zone and likely profit-booking area.
120,826 (Target 2): Higher bullish extension and next major resistance.
Stop Loss:
Keep stops below 118,602 (short entry area) or 118,457 (long exit) to reduce risk in case of reversal.
Bearish (Short) Setup
Short Entry (118,602):
Shorts activate below 118,602, confirming breakdown of support and shifting momentum to sellers.
Downside Targets:
118,410 (Target 1): Bounce/support area for first profit booking.
117,840 (Target 2): Deeper extension and next major demand zone.
Stop Loss:
Exit shorts if price retakes 118,955 to avoid losses on failed breakdown.
Range/Neutral Logic
Zero Line (119,333):
Current action near the zero line marks the market balance; a sustained close above 119,333 supports bullish momentum, while repeated rejection turns bias sideways or soft bearish.
Wait for a breakout from the zero line for high-conviction trades.
New ATHs for Gold?It seems like every single week, gold has been making new ATHs. With the overall bullish sentiment of the market plus the government shutdown, I don't see price slowing down any time soon.
As long as price is trading above the VWAP on lower time frames (4H, 1H, 15min), we could continue to see ATHs up to $4,000.
Me personally, I've been very cautious trading in these ATH markets. The reason is because price doesn't have much structure to follow. There's no clear vision of the target when entering longs and you're kind of just trading into no-mans-land.
We'll see what price decides to do early in the beginning of the trading week.

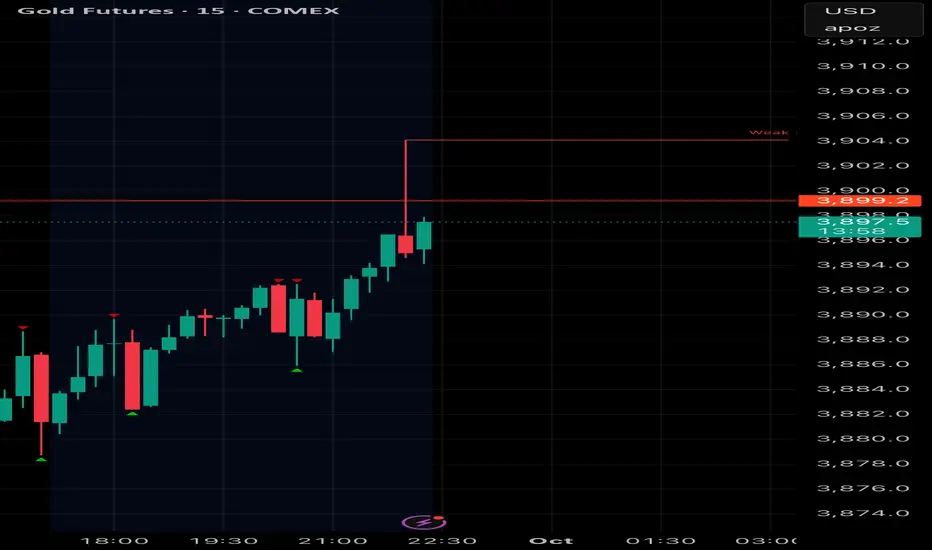
Long trade
Pair/Asset: MGC1! (Micro Gold Futures)
Trade Type: Buyside trade (Trade Idea)
Date: Tuesday, 30th Sept 2025
Session: 6:00 AM
Trade Details
Entry: 3841.3
Profit Level (TP): 3914.2 (+1.90%)
Stop Level (SL): 3822.0 (-0.50%)
Risk–Reward (RR): 3.78
Technical Narrative
Market Context:
Gold retraced sharply overnight, creating multiple fair value gaps (FVGs) on the 5m chart.
The strong rebound at ~3820 formed a structural low + BSLQ sweep, suggesting liquidity taken below support. A bullish recovery candle with high volume confirmed aggressive buyers stepping in.
Entry Justification:
Entry at 3841.3 coincided with the demand zone after the sweep.
EMA/WMA realignment showed a momentum shift back to the upside.
Volume spike supported bullish intent.
Target Rationale:
TP at 3914.2 chosen just below the prior swing high & inefficiency zone.
Broader context: If USD shows weakness during the NY session, upside continuation is likely?
DYX (1Hr TF) overview

Gold buy above 117815 tgt 120000 positonalGold buy above 117815 tgt 120000 positonal
Gold buy above 117815 tgt 120000 positonal
Gold buy above 117815 tgt 120000 positonalGold buy above 117815 tgt 120000 positonalGold buy above 117815 tgt 120000 positonalGold buy above 117815 tgt 120000 positonalGold buy above 117815 tgt 120000 positonalGold buy above 117815 tgt 120000 positonalGold buy above 117815 tgt 120000 positonalGold buy above 117815 tgt 120000 positonalGold buy above 117815 tgt 120000 positonalGold buy above 117815 tgt 120000 positonalGold buy above 117815 tgt 120000 positonalGold buy above 117815 tgt 120000 positonalGold buy above 117815 tgt 120000 positonal

GC quick pullback?I’m looking to take another quick pullback here with tight stops and targeting higher timeframe lows. Here goes.
Mcx Gold Profit-taking takes placeA proper analysis and technical analysis(gold)
The latest 4-hour chart of MCX Gold Futures (INR) reveals a strong uptrend supported by channel movement and clear Fibonacci retracement levels. The price has recently tested channel resistance around 116,625 INR and faced a minor pullback to 116,170 INR, suggesting short-term consolidation after a rally.
### Trend and Channel Analysis
- The price is moving within a rising channel, indicating persistent bullish momentum .
- The current price (116,170 INR) is slightly below recent highs, respecting the upper boundary of the channel, which signals overextension and potential for a corrective pullback .
- As long as the price remains inside the channel, the upward trend is intact.
### Fibonacci Retracement Levels
Key Fibonacci levels derived from the recent upmove:
- 0.0%: 116,625 INR (Recent swing high; nearest resistance)
- 23.60%: 113,656 INR (First near-term support; significant for shallow corrections)
- 38.20%: 111,819 INR (Secondary support; may attract buyers on stronger dips)
- 50.00%: 110,335 INR (Critical mid retracement; if broken, trend may weaken)
- 61.80%: 108,850 INR (Key retracement; strong institutional level)
- 78.60%: 106,737 INR (Major support if deep correction occurs)
### Support and Resistance
- Immediate resistance is at 116,625 INR; breaking above could trigger strong bullish momentum .
- Immediate support is at 113,656 INR; a drop below this could bring further downside to 111,819 INR .
- Psychological support is at 110,000 INR, just below the 50% retracement, and another at 108,750 INR near 61.8% .
### Momentum and Outlook
- The trend remains bullish unless the price closes below 113,656 INR .
- Watch for a buying opportunity if the price retests the lower channel or key Fibonacci levels without breaking the channel downward.
- If price sustains above 116,625 INR, next round of buying could push towards 118,000 INR.
### Summary Table
| Level | Price (INR) | Significance |
|-----------------|-------------|-------------------|
| Channel High | 116,625 | Immediate Resistance |
| 23.6% Fib | 113,656 | First Support |
| 38.2% Fib | 111,819 | Deeper Support |
| 50% Fib | 110,335 | Mid-Support |
| 61.8% Fib | 108,850 | Strong Support |
| 78.6% Fib | 106,737 | Deep Correction |
Overall, the outlook is bullish above 113,656 INR, but a close below key retracement levels could invite deeper correction towards 110,335 or 108,850 INR . Aggressive traders can ride the trend with tight stops below key levels, while conservative traders may wait for price action confirmation at or near Fibonacci supports.

MCX Gold Resistance can be face at 117550 levels MCX Gold Resistance can be face at 117550 levels after all Mean reversion is ment to happen
Dollar also shown some weakness recently.
Gold & Silver Push Higher as Markets Hunt for Safe HavensGold continues its climb, breaking through past resistance levels as investors flee into safety ahead of U.S. fiscal turmoil and rate ambiguity.
Meanwhile, silver is turning heads — rallying hard on the back of both safe-haven demand and its dual role as an industrial metal.
Together, they’re painting a picture: when anxiety and uncertainty rise, the metals step into the spotlight.
Gold hit an all-time high of $3,833.37/oz, closing at $3,829.63, on strong safe-haven demand amid U.S. shutdown fears and rate cut expectations.
It then extended gains, reaching $3,842.76/oz, putting it on track for its best month since August 2011 with an ~11.4% gain in September.
Silver also surged: it climbed to a 14-year high near $46.85/oz as industrial demand and safe-haven flows bolstered interest.
Earlier this year, silver broke $35/oz, a level not seen in over 13 years, driven by tight supply and robust demand in tech & green energy sectors.
