Gold Confirmed Bullish BiasFenzoFx—Gold is bullish again, confirmed by engulfing above the $4,175.00 resistance. As of this writing, XAU/USD trades inside the bearish fair value gap, testing the $4,230.00 resistance.
Last day, Gold did not dip below $4,103.00 (the bullish FVG) for liquidity. This indicates a strong bullish market. However, going long at the current price is risky because the price has surged already. The ideal level for joining the bull market would be around $4,146.00, which is in conjunction with daily highs and the October 23 and 24 close. This area should provide decent support for Gold.
In the bullish scenario, we expect Gold to form a double top at all-time highs by targeting $4,398.00.
Trade ideas

GOLD: Look For Bullish Breakout From The +FVGIn this Weekly Market Forecast, we will analyze the Gold (XAUUSD) for the week of Nov. 10-14th.
Gold has been consolidating in a +FVG since last week... and it is still holding! Wait for price to break the high of the consolidation and then look for long setups.
Be mindful that price may sweep the sell side LQ before it moves higher.
Enjoy!
May profits be upon you.
Leave any questions or comments in the comment section.
I appreciate any feedback from my viewers!
Like and/or subscribe if you want more accurate analysis.
Thank you so much!
Disclaimer:
I do not provide personal investment advice and I am not a qualified licensed investment advisor.
All information found here, including any ideas, opinions, views, predictions, forecasts, commentaries, suggestions, expressed or implied herein, are for informational, entertainment or educational purposes only and should not be construed as personal investment advice. While the information provided is believed to be accurate, it may include errors or inaccuracies.
I will not and cannot be held liable for any actions you take as a result of anything you read here.
Conduct your own due diligence, or consult a licensed financial advisor or broker before making any and all investment decisions. Any investments, trades, speculations, or decisions made on the basis of any information found on this channel, expressed or implied herein, are committed at your own risk, financial or otherwise.

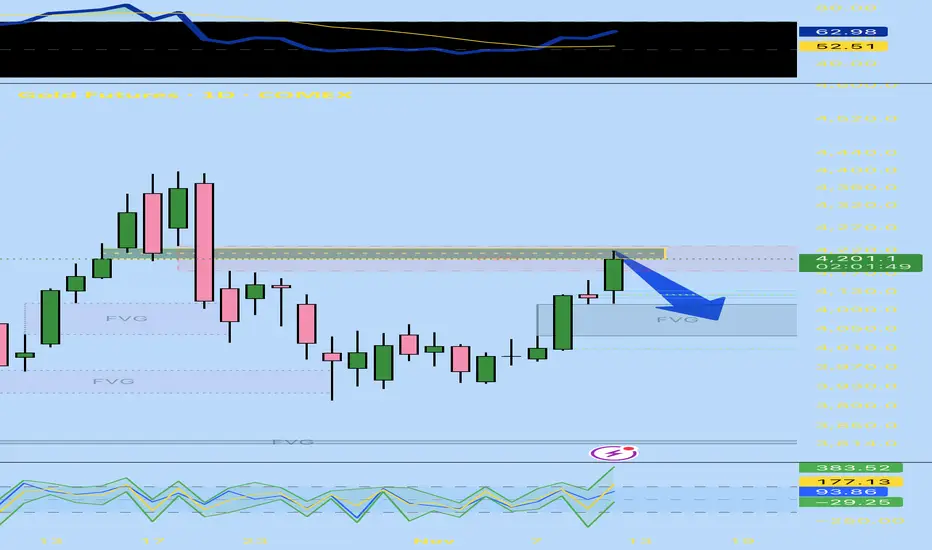
Gold Testing H4 Supply – Eyes on Retrace SetupAfter a clean bullish expansion last week, Gold is now testing a 4H bearish FVG around 4,200–4,240. Price is currently holding below the day’s open (4,203), suggesting potential short-term weakness.
If we stay below 4,203, I’ll look for a corrective move toward the 4H bullish FVG just below the previous day’s low (around 4,060–4,090).
Above 4,220, the bullish continuation remains valid.
Currently in observation mode — waiting for intraday confirmation before engaging any short bias.

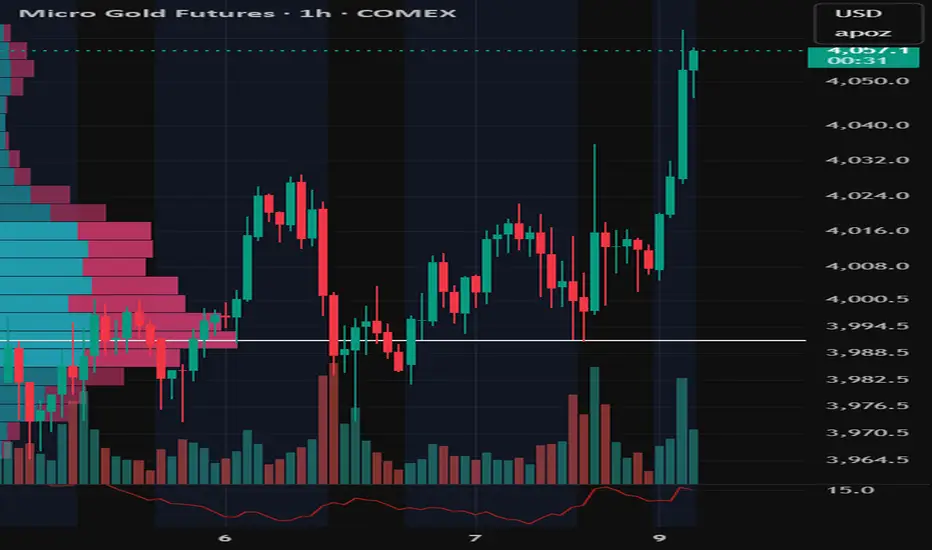
Caught between a Volume Imbalance and 2 FVGsI’m looking at the bullish volume imbalance that is overlapping a bearish fair value gap. Price just made a bullish run leaving a bullish fvg behind. I think we drop out of this fvg and vi and head back down towards the bullish fvg around 4050.
I’m guessing we go back to around 4050 over the next couple days.
GOLD (XAU) Outlook - Prediction (12 NOV)GOLD (XAU) Outlook - Prediction
📊 Market Sentiment
Market sentiment for GOLD remains strongly bullish, primarily driven by central bank accumulation. Since 2023, global central banks led by China have been purchasing gold aggressively, creating a durable demand base. With the FED preparing to initiate QE while inflation remains elevated, I think risk assets like GOLD could outperform as the USD (DXY) weakens. This macro setup continues to support a long term bullish narrative.
📈 Technical Analysis
Price has been retracing since October 20, which I think was a healthy correction following a strong expansion. As mentioned in my previous GOLD outlook, price appeared to be retesting the Weekly Value Gap and accumulating within that zone. In my opinion, this accumulation phase seems to have ended, and the market looks ready to continue higher.
📌 Game Plan - Prediction
Price has broken out of the accumulation zone and started expanding upward. I plan to enter after a retest near the key zone around $4060. It may dip toward $4027, which I consider a discount zone. I intend to scale in between $4060 and $3950, with invalidation if the daily candle closes below $3900.
💬 Follow my Substack profile for detailed insights and extended analysis.
⚠️ Disclaimer: For educational purposes only. This is not financial advice.

MGC ShortShort Active Trade – MCZ (Sell)
📌 Entry: Market execution
🔴 Stop Loss (SL): 4134
🟢 Take Profit (TP): 4117
Discipline, patience, and precise execution…
We trade the iINVICTUS way.

gold is on some weaker note gold forming some bearish pattern on resistance can see 2-3% fall in short term

Regional Price Differences in the Global Trade Market1. Introduction to Regional Price Differences
Regional price differences refer to the variation in the price of the same or similar goods and services across different geographic regions or countries. In global trade, these disparities influence where goods are produced, how they are traded, and who benefits most from global value chains. For instance, the same smartphone might cost significantly more in Europe than in Asia due to differing taxes, import duties, and distribution costs.
While globalization and digitalization have helped narrow some price gaps, differences remain pronounced because local economic conditions, government regulations, and logistical constraints continue to vary widely.
2. Key Causes of Regional Price Differences
a. Production Costs and Input Availability
One of the most fundamental reasons behind regional price disparities is the difference in production costs. Labor wages, raw material availability, and energy costs differ from one region to another. For example, manufacturing costs in Southeast Asia are generally lower than in North America or Western Europe, primarily because of cheaper labor and more lenient regulatory frameworks. Consequently, products made in Asia often sell at lower prices, giving the region a competitive edge in global trade.
b. Exchange Rates and Currency Valuation
Currency fluctuations significantly impact pricing in international trade. A country with a strong currency will find its exports becoming more expensive for foreign buyers, while imports may become cheaper. Conversely, a country with a weaker currency can sell goods more competitively abroad. Exchange rate volatility, therefore, introduces continuous adjustments in trade pricing across regions.
c. Trade Policies and Tariffs
Governments impose import tariffs, export duties, and non-tariff barriers to protect domestic industries. These policies alter price structures across borders. For example, U.S. tariffs on Chinese goods during the trade tensions of 2018–2020 increased prices for certain products in American markets. Similarly, the European Union’s agricultural subsidies have led to lower food prices in Europe compared to regions where farmers receive little or no government support.
d. Transportation and Logistics Costs
Geographical distance and infrastructure quality play a vital role in determining final prices. Shipping costs, fuel prices, and port handling fees vary widely between regions. Landlocked countries, such as those in Central Africa, often face higher import prices due to their reliance on overland transportation. In contrast, coastal nations with advanced port facilities, like Singapore or the Netherlands, enjoy lower trade costs and more competitive pricing.
e. Taxation and Regulatory Differences
Value-added tax (VAT), sales tax, and environmental levies contribute to price differences. Developed countries often impose higher consumption taxes, making goods more expensive than in emerging markets. Additionally, stricter quality or safety regulations in some regions may require costly compliance, raising production and retail prices.
f. Market Demand and Purchasing Power
Regional consumer behavior and purchasing power also determine pricing strategies. Companies adjust their prices based on what consumers can afford and are willing to pay. For instance, global fast-food chains often sell products at lower prices in India or Indonesia compared to the U.S. or Japan, aligning with local income levels.
3. Economic Theories Explaining Price Differences
Two key economic theories help explain regional price disparities:
a. The Law of One Price (LOOP)
This theory suggests that in efficient markets without trade barriers or transportation costs, identical goods should have the same price globally when expressed in a common currency. However, real-world frictions — like shipping expenses, tariffs, and local taxes — often violate this law, leading to price differences.
b. Purchasing Power Parity (PPP)
PPP adjusts for differences in price levels between countries, asserting that exchange rates should equalize the purchasing power of different currencies. Yet, deviations from PPP are common due to local factors like government intervention, monopolistic pricing, and varied cost structures.
4. Regional Case Studies
a. Asia: The Manufacturing Hub
Asia, especially China, India, Vietnam, and Indonesia, is known for its low-cost manufacturing advantage. The region benefits from cheaper labor, favorable trade agreements, and strong production ecosystems. As a result, products made in Asia — such as electronics, textiles, and machinery — often cost less than similar items made in Europe or the United States. This price advantage has turned Asia into the world’s factory, though rising labor costs in China are gradually narrowing the gap.
b. Europe: High Standards and High Prices
European markets tend to have higher consumer prices due to stringent labor laws, environmental regulations, and value-added taxes. Additionally, many European countries prioritize sustainable production and quality assurance, which increase costs. However, consumers in Europe are generally willing to pay a premium for quality, ethical sourcing, and environmental responsibility.
c. North America: Market Efficiency and Brand Premiums
The U.S. and Canada enjoy advanced infrastructure and technological efficiency, which can reduce costs in some sectors. However, strong brand influence and higher wage levels often lead to elevated retail prices. Moreover, the U.S. dollar’s global dominance sometimes results in price discrepancies when converted into weaker currencies.
d. Africa and Latin America: Infrastructure and Import Dependency
Many countries in Africa and Latin America face higher prices due to weak infrastructure, high import dependency, and limited manufacturing bases. Import tariffs, long shipping routes, and unstable exchange rates further raise costs. For instance, consumer electronics or cars may cost 30–50% more in these regions than in Asia or North America.
5. Implications for Global Trade
a. Competitive Advantages and Trade Patterns
Regions with lower production costs attract multinational corporations seeking efficiency and profitability. This leads to industrial clustering — such as textile hubs in Bangladesh or electronics hubs in Taiwan. However, this concentration can also cause over-dependence and trade imbalances.
b. Consumer Access and Inequality
Price differences can contribute to global inequality. Consumers in poorer nations often pay higher prices for imported goods relative to their income, limiting access to essential products. Meanwhile, consumers in wealthier nations enjoy broader choices at competitive prices due to efficient supply chains.
c. Supply Chain Strategies
Businesses use regional price data to optimize their supply chains, choosing where to source materials and where to sell products for maximum profit. The rise of digital platforms and data analytics allows companies to monitor regional trends and adjust prices dynamically.
d. Inflation Transmission
Regional price differences can also transmit inflation across borders. For example, if energy prices rise in the Middle East, importing regions like Europe and Asia experience higher fuel and transportation costs, which ripple across global supply chains.
6. Technological and Policy Developments Reducing Price Gaps
Digitalization, automation, and free trade agreements are helping reduce some regional price disparities. E-commerce platforms allow consumers to compare global prices instantly, pressuring sellers to maintain competitiveness. Additionally, trade liberalization efforts under organizations like the World Trade Organization (WTO) aim to minimize tariffs and improve market access.
However, geopolitical tensions, such as the U.S.–China trade war or Brexit, can reverse progress by introducing new trade barriers and regulatory costs, widening price gaps once again.
7. Conclusion
Regional price differences are an inevitable and integral part of the global trade system. They reflect each region’s unique combination of resources, policies, consumer preferences, and economic maturity. While globalization, technology, and policy harmonization have narrowed some disparities, complete price uniformity remains unrealistic due to local economic realities and geopolitical diversity.
For businesses and policymakers, understanding these differences is not just an academic exercise — it is a strategic necessity. It influences where companies invest, how governments design trade agreements, and how consumers experience global markets. In the end, managing regional price differences effectively is key to ensuring balanced growth, fair competition, and sustainable globalization.

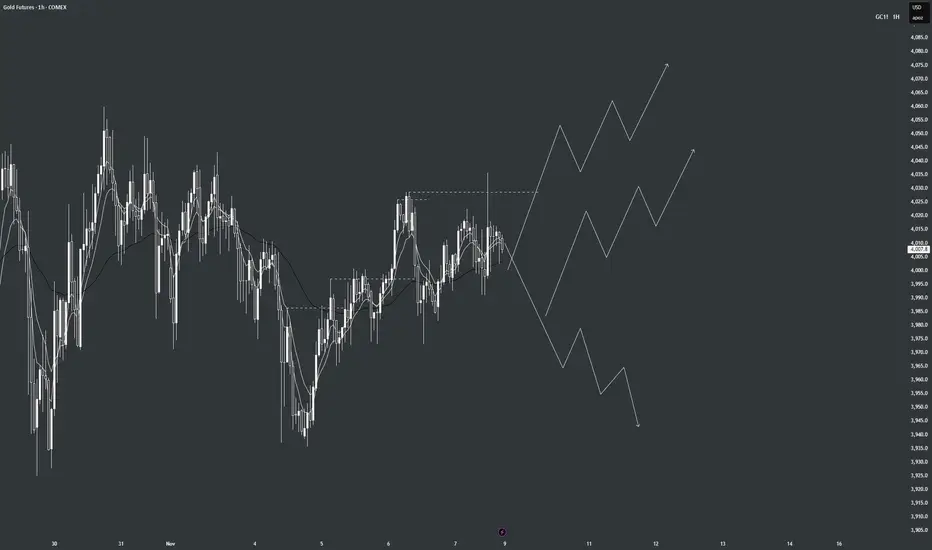
goldI'm just like everyone else—I think we are going up :) W pattern for the win —could I elaborate? Yeah, but I want a few more wins under my belt

Breakout Confirmed – Watching for 4H FVG RebalanceAfter a full week of sideways chop, Gold finally broke structure on Monday with a strong bullish impulse. The breakout clears the 7-day range and confirms higher-timeframe bullish intent.
I’m now watching the 4H FVG sitting just below the previous day’s low — that’s where I’d like to see price rebalance before continuing the next leg higher.
If price respects that zone and holds structure, it could mark the start of a sustained bullish push for the week.
Bias stays bullish unless price breaks back below the H4 FVG or fails to hold the weekly open.


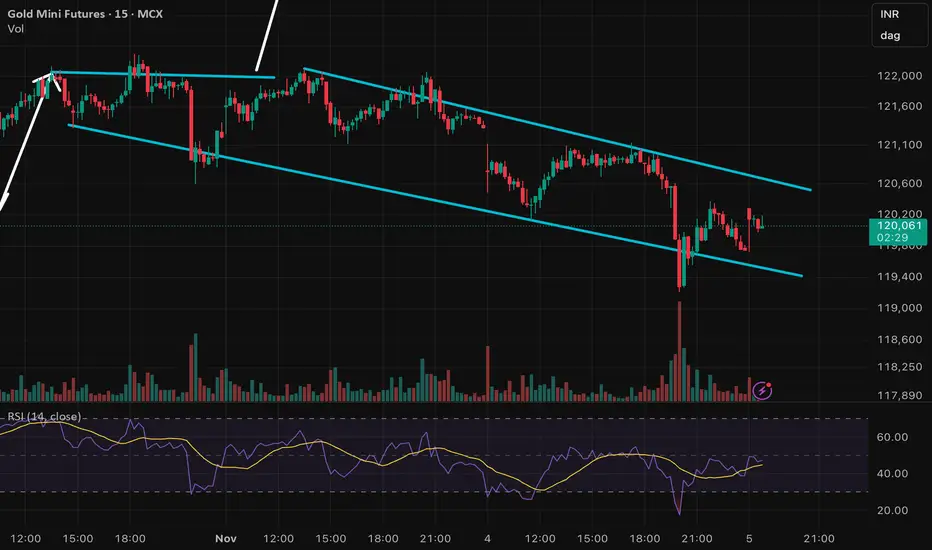
GOLD falling in a parallel channel formation Gold price has been falling since yesterday as expectations of December rate cut fades away. It is forming a parallel falling channel pattern and has recently bounced from the lower zone.
Keep an eye on it as volatility is expected to stay and there will be ample opportunities to capture movements. Follow me for live updates.
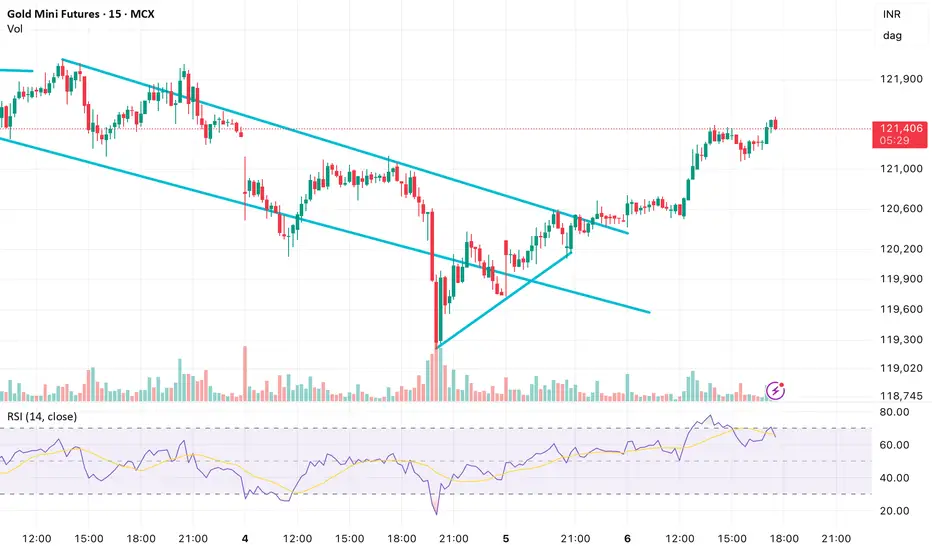
GOLDM showing upside momentum as BoE keeps rate at 4%GOLDM is rallying today before Bank of England interest rate decision where they have kept interest rate at 4% meeting market expectations.
Gold recently gave a breakout from a falling channel pattern formation on 15 min chart
Gold GC - Is the bullish Bias Back?Gold just completed a major pullback. Is Gold going to recover? Will the bullish Bias continue? Price is trending above the EMAs. This signals strong momentum for now. The Gold rush is on?

GC - til Nov 2025 (1hr chart)T.A explained -
BackSide (BS)
FrontSide (FS)
Inverse BS (Inv.BS)
Inverse FS (Inv.FS)
BS & FS levels are expected support when dashed lines, tested when dotted and resistance when solid lines.
The inverse is true for the Inv. BS Inv. FS levels, they are resistance as dashed lines, tested as dotted and support as solid lines.
Monthly timeframe is color pink
weekly grey
daily is red
4hr is orange
1hr is yellow
15min is blue
5min is green if they are shown.
strength favors the higher timeframe.
2x dotted levels are origin levels where trends have or will originate. When trends break, price will target the origin of the trend. its math, when the trend breaks, the vertex breaks too so the higher timeframe level/trend that breaks, the more volatility there could be as strength in the orders flow in to fuel the move.
yesterday
Trade closed manually
price followed the candle science and timeframes from the 5min green levels to the weekly grey level. Price has left behind some inverse frontside and inverse backside candles which look to be forming the bridge to flip the script if price manages to gain those levels and start accumulation. That liquidity will "unlock" and fuel price action.

Commodity Market Analysis: The Core of Global Trade1. Understanding the Commodity Market
Commodities are divided mainly into two categories:
Hard Commodities: Natural resources that are mined or extracted, such as gold, crude oil, copper, and natural gas.
Soft Commodities: Agricultural products and livestock, such as wheat, coffee, sugar, cotton, and cattle.
The commodity market allows producers, traders, and investors to trade these items through spot markets (for immediate delivery) and futures markets (contracts for future delivery at predetermined prices). Futures contracts are the most popular instruments in commodity trading because they allow participants to hedge risk and speculate on price movements.
2. Importance of Commodity Market Analysis
Commodity market analysis helps determine where prices are heading and why. Because commodities are essential for every economy—from manufacturing to energy to agriculture—their prices influence inflation, exchange rates, and corporate profits. Investors and traders analyze this market to:
Identify investment opportunities
Hedge against inflation and currency fluctuations
Forecast economic growth or slowdown
Manage risk and portfolio diversification
For example, rising crude oil prices often signal economic strain, while increasing metal prices might suggest industrial growth.
3. Types of Commodity Market Analysis
Commodity analysis can be broadly categorized into fundamental analysis and technical analysis. Each approach provides different insights into price movements.
A. Fundamental Analysis
Fundamental analysis focuses on understanding the underlying factors that affect supply and demand. For commodities, these factors include:
Supply Factors:
Weather conditions (affecting crops like wheat or coffee)
Mining output and energy production levels
Government policies, export restrictions, or trade tariffs
Geopolitical tensions or wars disrupting supply chains
Demand Factors:
Industrial and manufacturing growth
Population growth and changing consumption habits
Technological advancements (like electric vehicles increasing demand for lithium and copper)
Seasonal demand variations (e.g., more oil consumption in winter)
Fundamental analysts often look at inventory levels, production reports, and global trade data to estimate price directions. For example, if OPEC announces production cuts, it often leads to a rise in crude oil prices due to reduced supply.
B. Technical Analysis
Technical analysis studies price patterns, volume data, and historical trends to forecast future movements. It assumes that all market information is reflected in prices and that human behavior often repeats in patterns.
Key tools include:
Candlestick charts: Show price movement patterns like “Doji,” “Hammer,” or “Engulfing,” which can signal reversals or continuations.
Support and Resistance levels: Help identify price zones where buying or selling pressure increases.
Indicators: Such as Moving Averages (MA), Relative Strength Index (RSI), MACD, and Volume Profile, which help identify trends and momentum.
Volume analysis: Confirms whether price moves are supported by strong participation.
For instance, if gold breaks above a major resistance with high volume, it signals strong bullish sentiment.
4. Major Global Commodity Exchanges
Commodities are traded across various international exchanges that set global benchmarks:
New York Mercantile Exchange (NYMEX) – for crude oil, natural gas, and metals
Chicago Board of Trade (CBOT) – for agricultural commodities
London Metal Exchange (LME) – for industrial metals like copper, aluminum, and zinc
Multi Commodity Exchange (MCX), India – for gold, silver, crude oil, and base metals
National Commodity and Derivatives Exchange (NCDEX), India – for agricultural products
These exchanges operate under strict regulations, ensuring transparent price discovery and risk management.
5. Key Commodities and Their Drivers
Let’s look at some key commodities and what drives their prices:
Crude Oil:
Driven by OPEC decisions, geopolitical conflicts, global demand, and inventory data. Oil is sensitive to global growth expectations and energy transitions toward renewables.
Gold:
Considered a safe-haven asset. Its price moves inversely with the U.S. dollar and interest rates. During economic uncertainty, inflation, or political instability, investors flock to gold.
Silver and Copper:
Silver acts both as a precious and industrial metal, while copper is an industrial growth indicator. Their prices rise with manufacturing demand and fall with economic slowdowns.
Agricultural Commodities:
Prices of wheat, soybeans, and coffee depend heavily on weather, global harvest reports, and export-import policies.
Natural Gas:
Influenced by seasonal demand, storage levels, and geopolitical factors (e.g., disruptions in gas supply from Russia or the Middle East).
6. Global Economic and Political Impact
The commodity market is deeply tied to global macroeconomic and political conditions. For example:
Inflation: Rising commodity prices often lead to inflation, as they increase costs for manufacturers and consumers.
Currency movements: A stronger U.S. dollar typically lowers commodity prices (as they are priced in dollars), while a weaker dollar lifts them.
Geopolitical tensions: Conflicts in oil-producing regions, like the Middle East, can cause supply disruptions and sudden price spikes.
Interest rates: Higher interest rates strengthen the dollar and reduce demand for non-yielding assets like gold.
Thus, traders must keep track of global news, central bank policies, and trade agreements to anticipate market reactions.
7. Risk Management in Commodity Trading
Commodity markets are highly volatile, making risk management essential. Traders use strategies like:
Hedging: Producers and consumers lock in prices through futures contracts to protect against price fluctuations.
Diversification: Investing in multiple commodities to reduce exposure to one sector.
Stop-loss orders: Limiting losses when trades go against expectations.
Position sizing: Managing capital allocation to avoid overexposure.
For instance, an airline company may hedge against rising fuel prices by purchasing crude oil futures.
8. The Role of Technology and Algorithms
Modern commodity trading is increasingly driven by AI algorithms, data analytics, and automated systems. Traders use real-time data to analyze weather patterns, satellite imagery (for crop forecasting), and global supply chain movements. This digital transformation enhances precision and speed in decision-making.
Platforms now integrate Volume Profile Analysis and Market Structure Analysis to study institutional order flow and liquidity zones, giving traders a professional edge in spotting reversals and breakouts.
9. India’s Commodity Market Scenario
India is emerging as a major player in global commodity trading, particularly in gold, silver, and agricultural goods. Exchanges like MCX and NCDEX provide transparent, electronic platforms for traders. The introduction of commodity options, delivery-based contracts, and SEBI regulation has made the market more robust and investor-friendly.
With India’s growing energy and industrial demand, its role in setting regional commodity trends is increasing. Government policies on renewable energy and agriculture will further shape the market outlook.
10. Conclusion
Commodity market analysis is an essential skill for anyone involved in global trade, investing, or risk management. Understanding the interplay between supply-demand factors, geopolitical shifts, and technical indicators helps predict market direction more accurately. While volatility remains high, informed analysis enables traders and investors to turn uncertainty into opportunity.
In the modern era, commodities are not just physical goods—they’re strategic financial assets that influence inflation, economic policy, and portfolio performance. Whether you’re trading gold, oil, or agricultural futures, a strong grasp of market fundamentals and technical tools can unlock significant growth potential in this dynamic sector.
$GC_F next #gold futures target 4600Gold seems to be shining higher above the big money level and my target will be a 4600 test.

missing out on gold?if you are not longing gold you are missing out.
lets take this to olympus buy every base
Gold sellsWe have a strong resistance we’ve been holding at. Price failed two attempts up on the daily and two attempts on the 12-hour chart, with multiple 312 setups to the downside also ready to trigger. looking to target the 4hr unmitigated OB. this move will happen over next week hopefully the beginning of the week as I feel we are ready for a drop

GC Weekly Outlook | November 10–14, 2025Gold has been slowly breaking structure and surfing the 50ema. We creeped up inside the 1hr range last week and liquidated those highs. We could see price continue to the upside this week November 10-14. I am expecting the 1hr o continue to push higher, we can possibly get a deeper pullback until that impulse. I always make sure to follow the trend on the 1hr timeframe since I enter on the lower timeframes. The trend is your friend.
GoldFail to brake out of the triangle indicating manipulation sweeping the highs closing back in the range. If price reject the 50% of the daily wick look for a short set up cuz lower prices be the best probability.

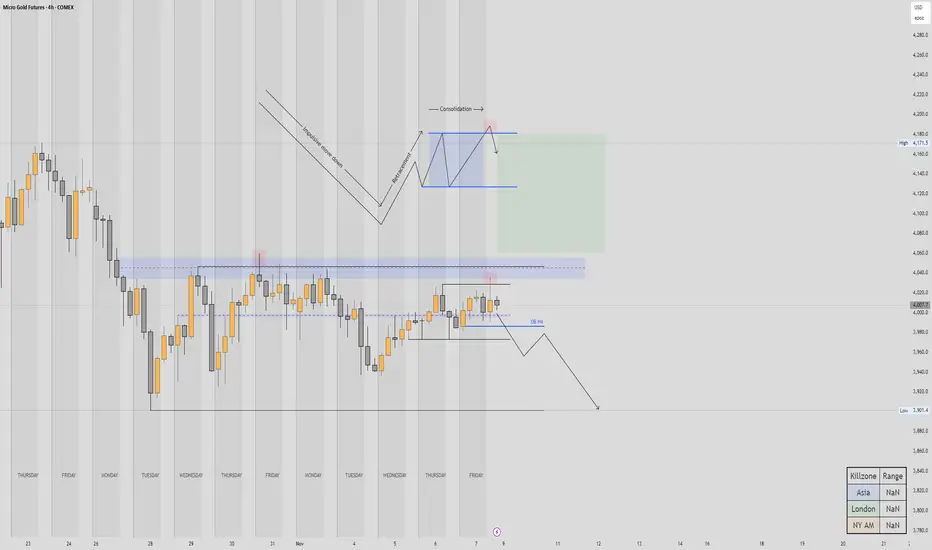
Gold futures to break back down the 4000?As we all know Gold has had an incredible rally this year,
Though, it's been consolidating for the last two weeks, and as far as the structure of the consolidation, some of the liquidity has been taken from the daily FVG on Oct the 30th, leaving a permanent high on the H4 chart with a nice bearish candle
Then it consolidated again for a bit, got an impulse to the downside, retraced with difficulty back to the H4 order block, to consolidate again last 2 days of last week. Finally , it printed what could be more of a permanent high on friday afternoon.
The combination of this, plus the last two day's candles looking bearish, starts to advocate for a bearish bias.
Therefore I'd like to see the price go and reach for the low of the range, after it's breaking the H4 structure
Of course this idea could be invalidated, if Gold was to break above the recent high and the Daily FVG, then we'd reasses the situation.
Still, I would be cautious for longs, Gold has been very extended for a very long time, needs to cool off a bit so we can go buy some coins again!
Cheers!
Gold’s Tight Range = Big Opportunity! Watch These Key Levels.COMEX:GC1! COMEX:GC1! (Gold Futures) | Market Analysis & 2025 Outlook
After hundreds of requests since my last ideas, I’ve decided to share another detailed breakdown — this time for Gold Futures COMEX:GC1! . Let’s dive in.
COMEX: COMEX:GC1! Breakdown
Fundamental Analysis → NEUTRAL to BULLISH
Gold remains range-bound as markets await clearer direction from global inflation data and U.S. rate expectations. Safe-haven demand continues to support the metal, but a strong dollar has kept price capped.
Technical Analysis → RANGING (Neutral Bias)
Currently consolidating within a 4H range since October 25th, with price bouncing between resistance near 4045 and support around 3940.
A close below 3940 opens the door for lows near 3823.
A close above 4045 could trigger a move toward the fair value gap around 4235.
If price sustains above 4235, the next major target would be a breakout beyond the all-time high at 4398.
This sideways structure suggests accumulation before a decisive move — traders should stay patient for a confirmed breakout before committing heavy capital.
Sentimental Analysis → Market in Waiting Mode
Gold traders are showing hesitation — institutions and retail alike are waiting for key macro catalysts. The current equilibrium reflects indecision rather than reversal.
My Suggestion:
While the bias remains neutral, a smart strategy is to wait for confirmation from the range extremes.
Trade Plan:
BUY Setup: If we see a strong 4H or daily close above 4045, aim for 4235, then 4398.
SELL Setup: If price closes below 3940, look for continuation to 3823 before considering long re-entries.
Use proper risk management — risk small until direction confirms.
Conclusion
Gold’s current range offers both opportunity and caution. Be patient and let the breakout guide your next move. Remember — the market rewards discipline more than prediction.
If you enjoyed this breakdown, drop a LIKE, COMMENT, and FOLLOW for more updates and technical setups.
See you soon on the next trade idea! ✨📊
