GC - GOLD 9/19Monthly timeframe Pink
Weekly = Grey
Daily = Red
4hr = Orange
1hr = Yellow
15min = Blue
5min = Green
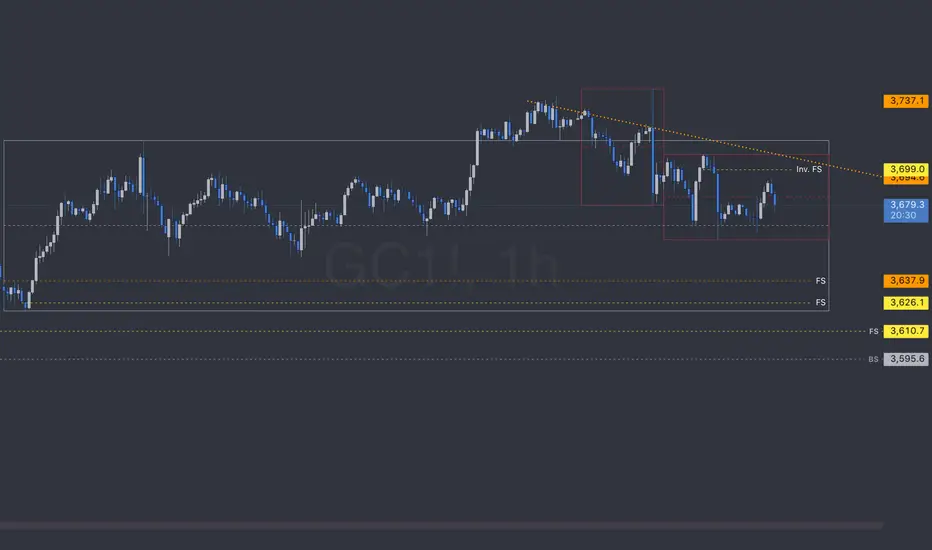
4 candles, 6 Levels, & MarketMeta
A Range = 2 or more candles in the same direction, either Accumulation ranges, Distribution ranges or Single candles which are ranges on lower timeframes.
the 4 candles are:
2 from the Distribution Range - BackSide (BS) which is the first distribution candle in the range. It has an expectation to have a strong influence on price when price is above it. If price is below the BS level, price enters the distribution range and the BackSide level acts as resistance to keep price down in a distribution trend.
The FrontSide candle (FS) is the last distribution candle is the range. the bottom side wick is the swingLow level and distribution range boundary. A FrontSide candle has an expectation to create an accumulation trend and keep price above the swingLow.
The other 2 candles are in the accumulation range and the exact opposite of the BS & FS level so they are labeled Inverse BackSide (Inv.BS) & Inverse FrontSide (Inv.FS)
GCM1991 trade ideas
Gold Futures — Bearish Momentum Building After Fed CutGold continues to show weakness after the Fed’s 25bps rate cut. Price rejected the 1H FVG overhead and is pressing down toward yesterday’s low (3660).
Key Scenarios:
Bearish Case (favored): If we break and close below yesterday’s low (D-L 3660), sellers likely push toward the weekly low (WL ~3627). That move would clean up the liquidity pool and fill the H-TF imbalance.
Bullish Case: Only if buyers defend the daily low and reclaim the 1H FVG with strength could we see price revisit 3710 (daily high).
Momentum remains on the downside, with ADX > 25 confirming trend conditions. Watching closely for the daily low sweep and possible continuation.

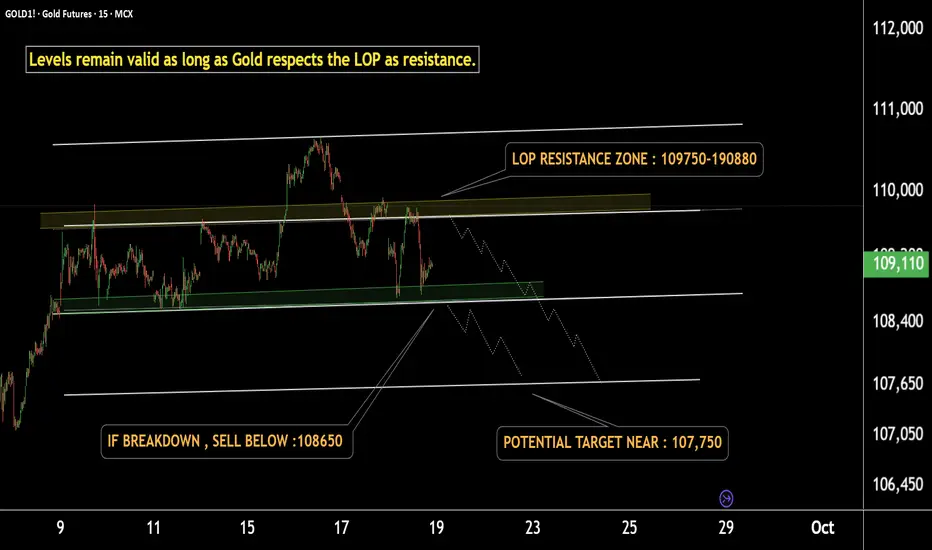
Gold setup indicates a fall ahead – Stay alert, traders!This is the 15-minute chart of GOLD1!
Gold is moving in a well-defined parallel channel and currently respecting the LOP resistance zone at 109750–109850.
The channel’s lower boundary near 108650 may act as short-term support.
If Gold breaks down below this support, the projected downside target is near 107750.
In case of range-bound movement, the ideal sell zone remains at the LOP (109750–109850).
If this resistance level sustains, Gold may fall and test the lower targets.
Additionally, a Head & Shoulders pattern has formed within the channel, with its downside target aligning with the channel projection.
Thank you.
Anticipation of GC / Gold over the next couple of weeks.For those who might have interest in a Elliott reading on gold:
In this post, everytime I write gold, I mean GC. This is just for info, since GC and gold doesn't have same prices, but the movement is very much the same.
If you follow along on a gold spot or similar, just translate the levels to there.
The picture is very messy for those who doesn't know what the lines and numbers are for, but please follow along.
I have a strong believe that with current PA the 3rd (white iii) wave is over, and now we will look for price to search for the bottom of the blue channel.
The blue channel is an acceleration channel, which is used to see if 4th (white iv) wave is under way. When the 4th (white iv) has developed some more, we are able to put another channel on, called the deceleration channel. This we will use to spot the end of the 4th (white iv).
Until now, it seems gold is respect the white 161 fib level, which is a very typical 3rd wave level to end.
The reason I started this post, was to tell you about my thoughts on when the 4th (white iv) is going to end, or at least how long it's going to be.
A typical scenario is that wave 4 is longer in duration than wave 2. For ease of spotting, I have put up these purple boxes, so now we do not anticipate gold to end the correction, before it has exited the purple box to the right.
The depth of wave 4 (white iv): I believe we are going to see prices in the level between 3600 and 3550 (the green box).
Reasons for the levels of the green box: when prices wave 2 (white ii) goes beyound the 61.8 fib level (in this case below), we tend to see a retracement between 38% and 50% in the 4th (white iv). And this is the area the green box indicates.
Timewise it is places outside of the previously mentioned purple box.
4th wave also tends to respect the base channel . Either the upper line or the middle line.
The lower line of the blue channel and the middle of the grey channel ( base channel ), the green box, outside of the purple box is all seeming to fall in the same place. So I like all the confluences falling together here, so that's why I feel pretty certain that, that is where the white iv wave is likely to end.
Timewise it'll be about 1st of october.
The white v wave i have also done a forecast on that fits if wave white iv retrace to the green box.
Normally the 5th wave is going to end in the area between 38% and 61% of the wave 1 and 3. This level is indicated with the blue fib.
Usually wave 5 is equal to wave 3. But can be extended if wave three isn't. Have indicated the 100% fib of white i wave with the cyan fib.
This 100% level falls between the blue fib, right around the yellow line I have talked a lot about before in previous post. So I also have a lot of confluences for price to go here in the white v wave.
If the white v is extended it could go to the blue 100% level, which also is confluenced with that cyan upgoing line. This is a pitchfork drawn from previous waves.
let's see where gold will take us.

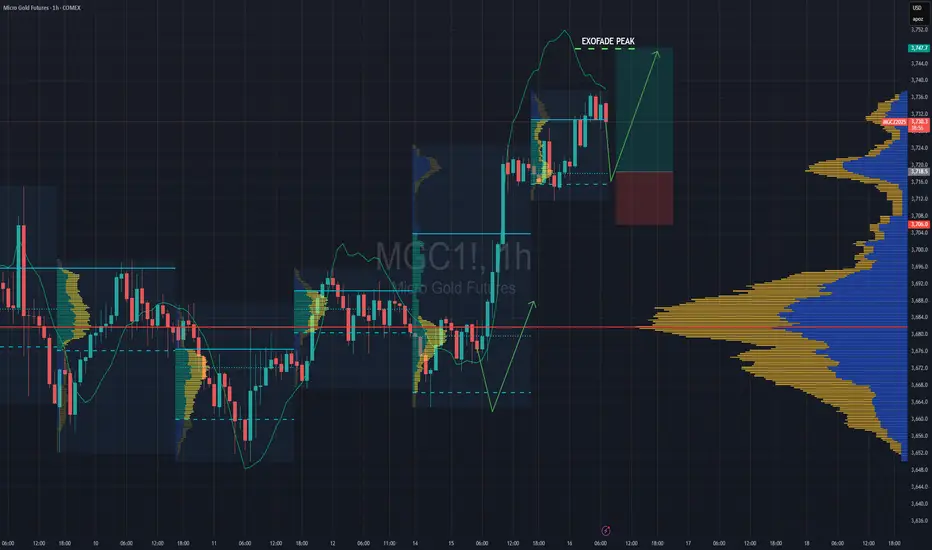
Gold — Fed Cut Fade: Overextended, Eyeing a ThrowbackGold — Fed Cut Fade: Overextended, Eyeing a Throwback 🎯
Gold ripped higher into the FOMC, but the 25 bp cut was fully priced in. Post-decision, we saw the classic whipsaw — down → up → slow fade into the close. With the dollar and real yields catching a bid, the metal looks due for digestion before the next leg.
Technicals (4h)
Overextended run: Vertical leg higher with no real basing.
Supply zone: Sellers showed up around 3.71–3.75k.
Volume magnet: Confluence of the broken trendline + HVN sits down at ~3.41k.
Thin profile: Gap between 3.52 → 3.41k leaves room for a fast move lower if momentum flips.
Trade Idea
Short bias: Fading the 3.71–3.74k zone or on breakdown acceptance below 3.69k.
Stop: Above 3.76k (invalidation).
Target: 3.41k (major HVN + retest zone).
Macro Context
The Fed’s move matches expectations. With positioning stretched and “buy the rumor / sell the news” in play, near-term risk is for a pullback. Medium term, the trend stays bullish if easing continues and real yields drift lower.
Not financial advice — just sharing the setup I’m watching.
#Gold #GC1 #Futures #ShortSetup #VolumeProfile #FOMC

Fed Cuts Rates — Gold Reacts, Watching for Follow-Through or ReThe Fed has just delivered a 25 bps rate cut, and there’s a mixed tone in the after-move: inflation still high, jobs softening, and the dot-plot shows more cuts are expected — but with divided opinions.
On the chart, Gold spilled out of consolidation post-Fed, touched key support, and is now pressing back toward a 4H FVG (supply zone).
Scenarios:
Upside: If price pushes up toward the 4H FVG, gets rejected cleanly → potential short entry.
Downside: If that rejection holds, or support breaks, expect slide toward high timeframe FVG region in 3600s.
Trade with eyes open — volatility likely stays high. Support & resistance zones are critical here.

Gold Bears Trapped at POC - Bulls Load for $3,850 BreakoutThe Market Participant Battle:
Bears attempted to push Gold below the Value Area at point 2 but were decisively trapped and beaten by major institutional buyers. The rejection at the POC (Point of Control) with strong bullish divergences across multiple momentum indicators signals that bulls have regained control. Price is expected to return to test the $3,850 resistance after this bear trap consolidation, with institutional buyers defending the value area high at $3,720.
Confluences:
Confluence 1: Value Area Rejection & POC Defense
The chart shows a textbook rejection at the Value Area High (point 2), with price piercing below but immediately recovering above both the POC and VAH. This is a classic bear trap pattern where aggressive sellers were absorbed by institutional buyers. The anchored VWAP from point 1 shows the 1st standard deviation aligning perfectly with the VAH, creating a powerful confluence of support that trapped late bears and sparked the reversal.
Confluence 2: Quad Bullish Divergence
All four momentum indicators (OBV, RSI, MFI, CDV) made higher lows while price made a lower low at point 2. This is an extremely rare quad divergence setup that historically precedes powerful moves higher. The OBV shows accumulation never stopped, RSI held oversold bounces, MFI indicates money never left, and CDV confirms institutional buying throughout the dip.
Confluence 3: FOMC Rate Cut Catalyst
The Fed just cut rates by 25bps today (September 17) with Governor Miran dissenting for larger cuts. The dot plot suggests two more cuts coming in 2025. Gold historically performs strongly during rate cutting cycles, with average gains of 14% in the year following initial cuts when markets are near highs.
Web Research Findings:
- Technical Analysis: Gold holding above $3,670 with immediate resistance at $3,700-3,720, major resistance at $3,850
- Recent News/Earnings: Fed cut rates 25bps today, markets pricing 93% chance of continued cuts through year-end
- Analyst Sentiment: Goldman Sachs targets $3,700+ for 2025, World Gold Council sees 0-5% upside in H2
- Data Releases & Economic Calendar: CPI at 2.9% (above 2% target), unemployment rising, suggesting stagflationary environment
- Interest Rate Impact: Real rates turning negative as inflation exceeds rate cuts - historically bullish for gold
Layman's Summary:
The Fed just started cutting interest rates today while inflation is still high (2.9%), creating the perfect storm for gold. When the Fed cuts rates but inflation stays elevated, gold becomes the go-to asset because cash loses value. Big banks are already positioned for this - central banks bought record amounts of gold in 2025. The technical setup shows major buyers stepped in exactly where they should (at the value area), creating a bear trap that should spring gold higher toward $3,850.
Machine Derived Information:
- Image 1: Shows numbered reference points 1-4 with clear bear trap at point 2, target at $3,856 - Significance: Classic V-reversal at value area with institutional footprints - AGREES ✔
- Image 2: Displays quad divergence across OBV/RSI/MFI/CDV indicators - Significance: Extremely bullish momentum divergence rarely seen, confirms accumulation - AGREES ✔
Actionable Machine Summary:
The AI analysis confirms a textbook bear trap setup at a critical technical level (Value Area/POC) combined with an ultra-rare quad divergence across all momentum indicators. The timing with today's FOMC rate cut creates a fundamental catalyst to trigger the technical spring-load. Stop placement is clear below point 2 at $3,706, with initial target at VAH retest ($3,720) before continuation to $3,850+.
Conclusion:
Trade Prediction: SUCCESS
Confidence: High
This setup combines the perfect storm of technical and fundamental factors. Bears were trapped attempting to break value area support just as the Fed initiated its rate cutting cycle. The quad divergence is exceptionally rare and historically precedes 5-10% moves. With inflation still elevated at 2.9% and rates being cut, gold's traditional role as an inflation hedge is activated. Risk/Reward is excellent with tight stop below $3,706 and targets at $3,850+, offering 4:1 R/R.

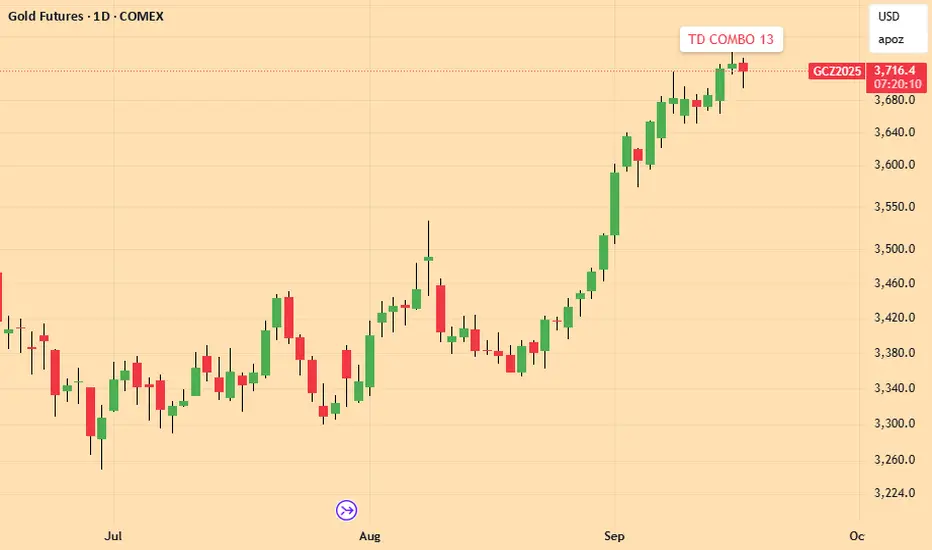
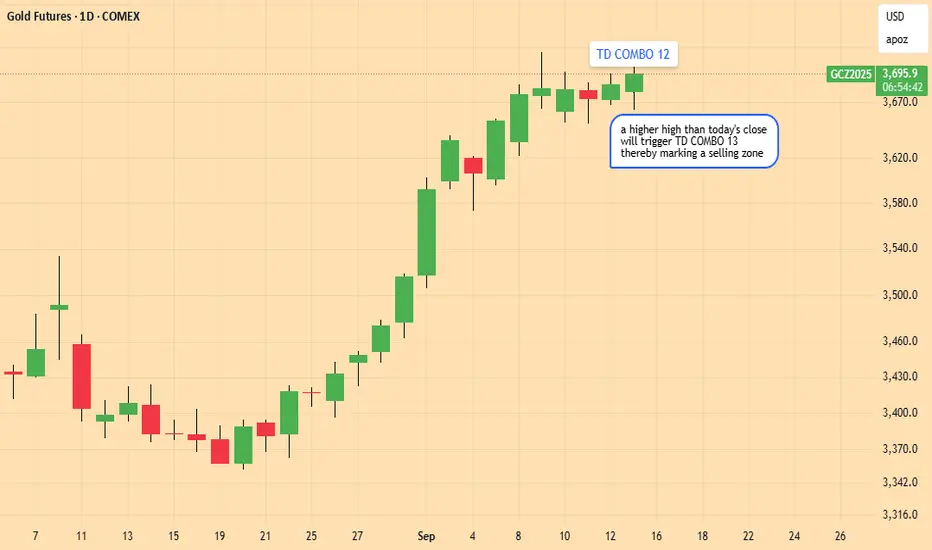
GOLD : SELL TD COMBO 13 posted yesterday 16th SeptemberThe famous Tom DeMark indicator posted a 13 Countdown on Tuesday 16th September, meaning that Gold has entered a selling area.

Gold Range Took a bit of time but they did bring Gold prices back into the range. I cant say how the Gold market will react for the Fed but there is potential for Gold to range at these price for a bit based on 9 Sept expressing sellers present. I think gold will resume out of the range but possibly not until the end of the month.
#GoldRange
#goldtrading
Gold Ready To Fold?Gold (GC1!) — 1.414 Tag + Max Gartley PRZ: Is This the High?
I’m mapping a short off a full confluence cluster at the highs.
Why I’m short here (stacked signals)
3-Month 1.414 extension hit: price is sitting right at ~3,722 (1.414 on the 3M chart). That’s classic terminal PRZ behavior.
Daily “Max Gartley” complete: harmonic PRZ lands 3,710–3,735; price tagged/hovered there.
Volume/CVD divergence across TFs: daily, weekly, monthly show higher price on weaker buy volume / softer positive delta → exhaustion.
Weekly momentum divergence: MACD lower high vs price higher high; histogram rolling off = bearish momentum divergence.
Band/structure context: riding the upper Bollinger with long upper wicks into red channel resistance; rising-wedge/parallel rail touch.
Measured moves: last leg ≈ prior leg; AB=CD ≈ 1:1 completes ~3,720–3,735, inside the PRZ.
Round-number + prior shelf: 3,700 is a heavy pivot; failure to extend above 3,739–3,742 on strong delta = absorption at the top.
Extra confirmations I’m watching live
CVD/Delta: push above 3,735 without new CVD highs = add to short.
Spread/financing: widening bid–ask / negative basis into spikes = top-y behavior.
Heikin-Ashi: upper shadows / color flip on daily/weekly strengthen the reversal case.
Bottom line: This is a short right now into 3,716–3,736 with risk 3,751. The confluence—3M 1.414, daily Max Gartley, multi-TF volume divergence, weekly MACD div, and channel resistance—points to a swing lower toward 3,700 → 3,673 → 3,641, with room to 3,566/3,551 if momentum cracks.

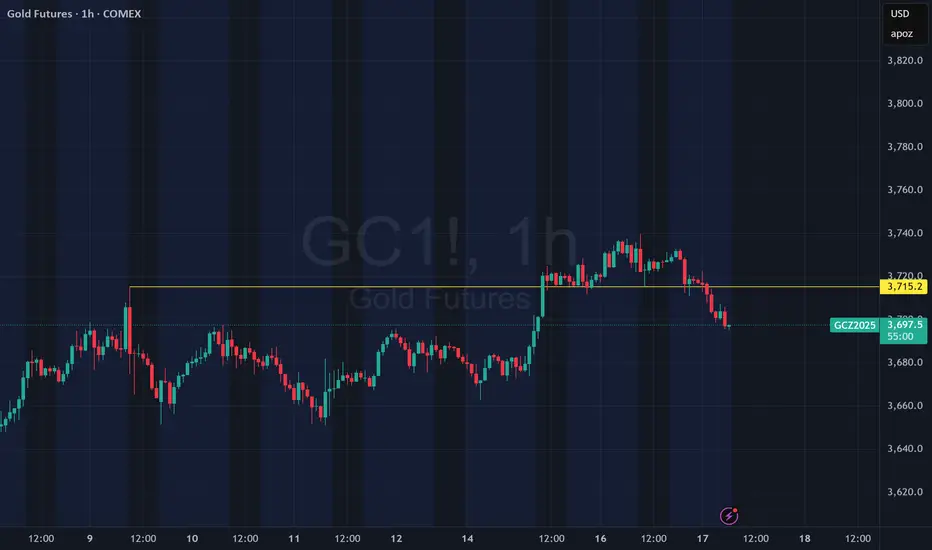
Gold Pauses Ahead of FOMC – Big Move Loading?Gold has been consolidating just below its all-time highs as traders await the Fed’s rate decision tomorrow.
Key levels on my chart:
Resistance: ATH 3737.5 → 3749.8 (DH)
Support: 3715.2 (WH) → 3711.6 (DL)
If the Fed cuts rates more aggressively than expected, Gold could break higher and run liquidity above 3750. On the flip side, a smaller cut or hawkish tone could give the dollar strength, driving Gold lower — first target 3700 → 3680.
I’m staying cautious during Asia and London, expecting chop until NY session. My focus will be on how price reacts after the announcement — that’s where the cleaner opportunities should come.
Patience is key here — the real move is still loading.

Silver To $44, Gold To $4,000!Precious Metals Booom!:
- Silver prices at a 14-year high
- Gold Bullion hit a record high of $3,673.95 on Tuesday
- All precious metals headed for weekly gains
Gold prices rose on Friday, holding close to record highs hit earlier this week, as signs of a weakening U.S. labor market reinforced expectations the Federal Reserve will deliver its first rate cut of the year next week Wednesday.
"Weaker employment and spotty inflation... priced in with the Fed having to cut rates is pushing metals higher because there is the risk of longer-term inflation," said Daniel Pavilonis, senior market strategist at RJO Futures.
"The market is preparing for the Federal Reserve to start cutting rates at the next meeting. The expectation is that this is not only one cut, (while) U.S. President Donald Trump's desire for lower policy rates also lifts gold's appeal," said UBS analyst Giovanni Staunovo.
According to experts, the chances of us seeing lower gold prices going into 2026 is lower than Gold rallying higher into uncharted territories due to the poor revised NFP numbers, higher unemployment rate, increase in inflation, reduced consumer sentiment etc..
What To Lookout For Going Into The Future?
- Discovery Prices @ $3,800 per/oz
- Interest Rates Dropping Will Lead To Cheaper Borrowing Which Intern Increases Purchasing Power To Buy More Gold
- $44 Buyside Liquidity For Silver

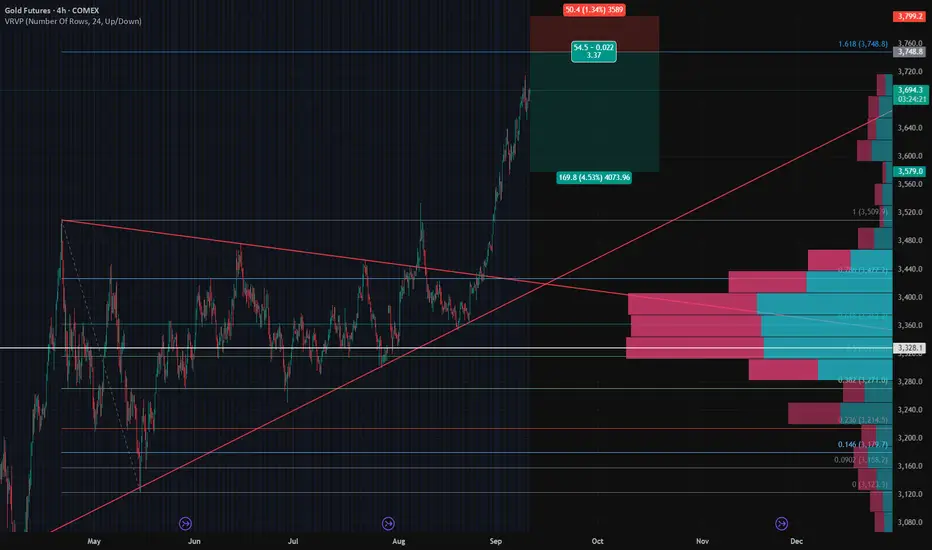
Gold Futures – Short Setup to Lock in Profits🟠 Gold Futures – Short Setup to Lock in Profits
Gold has had a strong breakout above the symmetrical triangle and has now pushed into an extended move near $3,700+. While the trend remains bullish on the higher timeframe, the current leg looks overextended, and I’m looking to hedge profits with a short setup.
🔑 Key Technicals
Pattern Breakout: Gold broke out of a long consolidation wedge and accelerated higher.
Resistance Zone: Price is testing the Fib 1.618 extension near $3,750, a potential exhaustion area.
Volume Profile: Strong demand zone sits between $3,300 – $3,360 where most volume is concentrated. A pullback could retest this area.
Risk-Reward: Setup gives ~1:3.4 RR with stop above recent highs and target into the HVN zone.
📉 Trade Idea – Protective Short
Entry: 3750
Stop Loss: 3800 (extension level).
Take Profit: $3580
⚖️ Strategy
This is not a reversal call – the larger trend is still bullish. The short setup is hedge/profit-protection only, aiming to capture a pullback after the parabolic leg.
I’ll be watching if buyers can defend $3,600 on the first dip; failure to hold could accelerate selling toward the high-volume zone.
📊 Bias
Short-term: Bearish (pullback expected)
Mid-term: Neutral to Bullish (trend intact above $3,300)
What do you think – do we see a healthy correction here, or is gold too strong to fade yet?
Gold Futures Day Trade Long EntryDont have enough time to go too into details on this one.
-Trade entry is based on Session Volume profile
- LVN on Visible range profile
- Entry at VAL - will likely get triggered during NY session today
- Weekly & Daily VWAP levels
Enjoy !!
Gold (MGC) – Watching 3725 Key Decision Point Ahead of CPIGold surged yesterday with aggressive bullish momentum, tagging into the 3725 BFH level. Price is consolidating just beneath it as we head into Tuesday’s London and NY sessions.
Upside: Break and hold above 3725 opens the door toward 3750+.
Downside: Rejection at 3725 + breakdown through 3700 could shift structure, with targets at 3680 and 3662.
CPI & Unemployment data in the NY session may provide the catalyst.
📌 Patience until reaction confirms — 3725 is the key battleground.

GOLD : just 1 day before a reversal zoneAs per Tom DeMark 's TD Combo a selling zone is anticipated above today's close
TD COMBO 13 will occur above from Tuesday 16th September
Gold Range ConditionsSome what similar pattern to one in February that was started last week on 9 Sept with a bearish engulfing hourly, 4 hour, 8 hour, and 12 hour that set near term resistance. The range during Feb lasted 17 days with a total of -3.45 toward the end with a fake out to the downside, that eventually broke upward toward the end of the month.
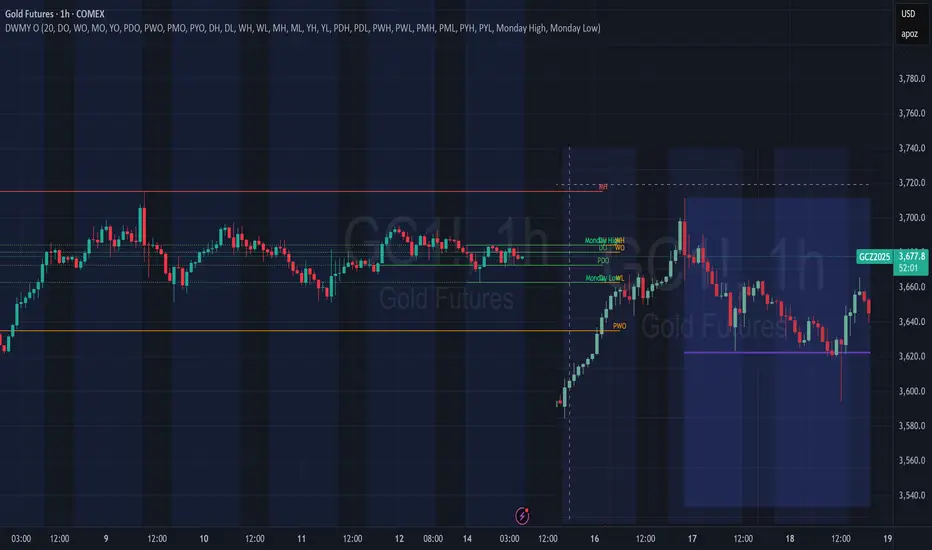
Gold Consolidation – Watching 3650 Break for Weekly MoveGold has opened the week consolidating under last week’s highs. Price continues to respect a bearish FVG on the 1H/4H chart, with heavy distribution around the 3675–3680 zone.
For direction:
Break above 3687 (D-H) = liquidity grab above highs before any reversal.
Break below 3654 (D-L) = bearish continuation into last week’s low (3626) and potentially the 8HR FVG around 3520–3550 later this week.
Bias is cautious bearish going into Asian → London session. I’ll be patient for confirmation — the cleanest trigger is an hourly close below yesterday’s low.

New Highs For Gold Or Perfect Opportunity for Reversal Gold (GC1!) Is Poised to set New Highs, as We've seen Gold (GC1) reach its highest Point in history and shows no intentions of Slowing Down. Gold May Start off Strong with high liquidity This Monday, This could be the lowest we get to see gold Prices For a long time and late investor may want to get in before we take off. all I know is this will be a fierce battle as 'Bears' may use this opportunity to enter their positions the 'Bulls' will have to fight! if they really want it.

Gold (XAU/USD) Forex SignalGold (XAU/USD) has been showing strong bullish momentum recently, but the latest Zig Zag pattern and RSI (Relative Strength Index) suggest a potential correction in the short term. Let’s analyze and provide a clear forex trading signal.
Market Overview
| Pair | Gold (XAU/USD) |
| -------------- | ------------------------------- |
| Current Price | \$3,680.7 |
| Trend | Bullish with minor pullback |
| Key Indicators | Zig Zag (5,10), RSI (14, close) |
| Volatility | High |
| Market Session | US Session |
Technical Analysis
Zig Zag Indicator: The last leg shows a peak around **\$3,679.3** followed by a small correction, signaling possible short-term weakness.
RSI (14): Currently near the **55 level**, coming down from overbought territory (>70). This indicates the bullish rally may be slowing, and sellers could test the downside.
Support Levels: \$3,650 – \$3,620
Resistance Levels: \$3,720 – \$3,750
Gold Trading Signal (September 14, 2025)
| Signal Type | Sell (Short-term) |
| ------------- | --------------------- |
| Entry Zone | \$3,680 – \$3,690 |
| Stop Loss | \$3,720 |
| Take Profit 1 | \$3,650 |
| Take Profit 2 | \$3,620 |
Analysis: Since RSI has cooled off from overbought levels and Zig Zag shows a minor top formation, a short-term selling opportunity is expected. However, the long-term trend remains bullish, so aggressive traders may wait for dips to re-enter long positions.
Alternate Scenario
If gold breaks above \$3,720, the bearish setup becomes invalid, and bulls may drive the price toward \$3,750 – \$3,800.
FAQs on Gold Forex Signals
Q1: Is gold still a good buy in September 2025?
Yes, gold remains in a long-term uptrend, but short-term pullbacks are expected.
Q2: What is the best strategy for XAU/USD now?
Swing traders can short near resistance with tight SL, while long-term investors can buy on dips.
Q3: Which indicators are most useful for gold trading?
RSI, Zig Zag, Moving Averages, and Fibonacci retracements work well with gold volatility.
Conclusion
Gold (XAU/USD) is consolidating after a strong bullish move. Short-term traders can look for sell opportunities near \$3,680 with targets at \$3,650 – \$3,620, while long-term traders should stay bullish and buy dips.

Gold futures forcast Bullish continuation steps in?@GoldenZoneFX Follow me for more valuable content and insightful ideas.
"GC1 is in a compression phase following a bullish impulse. Decision zone lies between 3,585 and 3,716. A breakout with volume signals continuation; a rejection points to a return toward support levels. Clean structure—worth monitoring.
Risk is dynamic. Stay adaptive, stay protected.

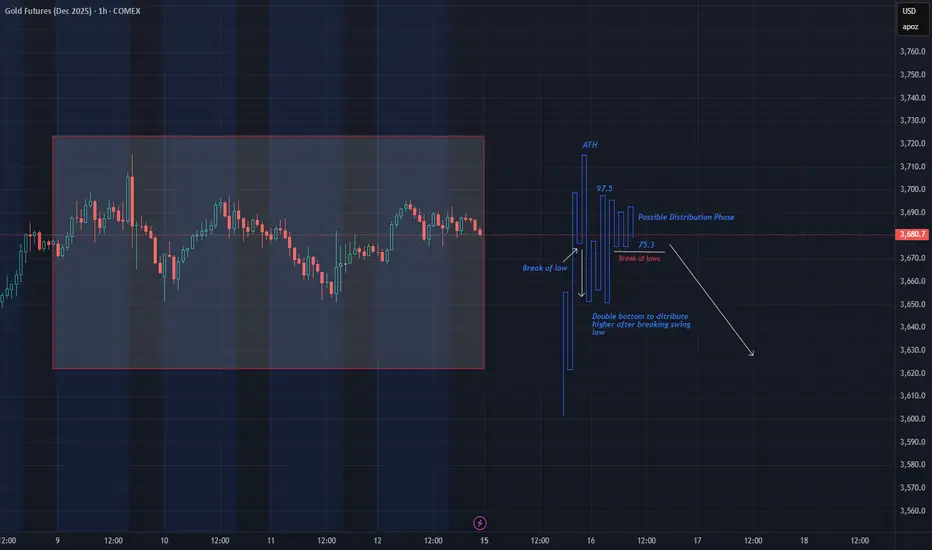
Possible distribution of Gold Futures - Hourly Swing ChartAfter reaching ATH we would have expected no hourly swings to break if it was to continue, however having a clear break of a swing low was a sign for the big players to sell out after moving market higher to distribute. It is a good idea to try to short the higer side of the distribution phase and if the high breaks go long or remain short should the lower end breaks.