4000 year old money EuphoriaKudos to my good friends that have patiently waited a decade for this ancient money to finally yield great returns. But it's my job here to urge caution and share the lessons of historical finance.
First, let's try to "value" silver historically:
Code of Hammurabi (1750 BC):
Minimum wage for common labor; 8 grains of silver (0.65 g) per day (0.021 oz)
Classical Athens – Periclean period (~450–430 BC):
Unskilled; 1 drachma = ~4.3 g per day (0.138 oz)
Skilled; 1.5–2 drachmae (0.21–0.28 oz)
Roman Republic (Early Empire – Augustus to ~200 AD):
Legionary; 2–2.3 g net per day (0.064–0.074 oz)
Urban unskilled; 3.5 g per day (0.1125 oz)
Roman Empire – Diocletian’s Edict (301 AD):
Farm labor; 0.5-1g per day (0.016-0.032 oz)
Sassanid Persia (~500–600 AD)
1 silver drachm ≈ 4 g per day (0.129 oz)
Medieval England – Statute of Labourers (1351, post-Black Death):
2-3 pence per day; 1 penny = 1.2-1.4g silver (0.077-0.135 oz)
United States – Early Federal period (1790–1800)
Common laborer $0.50–$1.00 per day; U.S. silver dollar = 24.06 g silver (0.39-0.66 oz)
United States – Coinage Act era average wage (1790s–1830s)
Unskilled labor ~$0.75–$1.25 per day (0.58–0.97 oz)
Throughout most of monetary history when silver was actually money, one day of common or semi-skilled labor bought roughly 0.05 to 0.28 troy ounces of silver (with 0.10–0.15 oz being the most common sweet spot in stable empires).
Today (Dec 3, 2025), with silver trading at $57.50/oz, an 8-hour low-skill U.S. wage at $17–$20/hr buys ≈ 2.37–2.78 troy ounces of silver per day — 10–25× higher than almost any pre-1900 historical benchmark.
So one could interpret this historic perspective in two ways:
Silver still has enormous upside to reapproach historical labor norms; An 8-hour U.S. production worker (~$31.50/hr) currently buys ≈ 4.4 troy oz per day — that is 4–7× higher than even the richest silver-standard societies ever paid free citizens, and 200–800× higher than the worst monetary collapses. For today’s wage to buy only the historical average of 0.12 oz/day, silver would need to trade around $2,100/oz.
We no longer pay wages in silver, so the comparison is meaningless; Labor is now paid in fiat, and silver is primarily an industrial/hedge asset. Monetary demand is only a fraction of what it once was, and productivity, technology, and energy inputs have exploded. A direct 1:1 labor peg is never coming back.
Now, let's dive back into the realm of historical analysis that is most relevant.
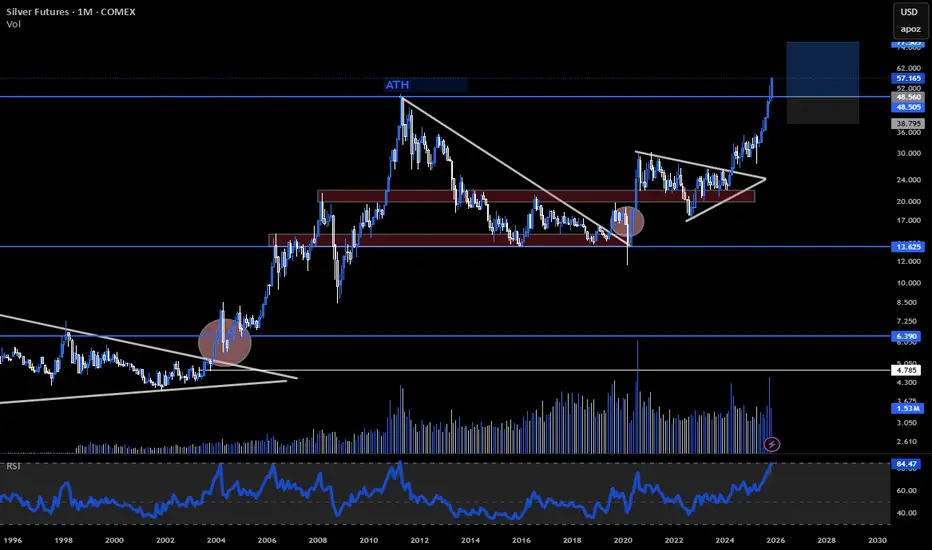
Much sooner than 4000 years ago (11 actually) silver had a great "yeet" which saw it rise bottom to peak by +493% (the current rise is at 412%). However, the drawdown from the 2011 high was -72%
If we go back half a century ago to 1976-1982 Silver rose +919% only to fall -88%.
The takeaway should not be that the rise in Silver might end here or anywhere. We just don't have enough data but we can infer historical parallels. Volatility is often a gift to investors but in silver, a 4000 year old money, it remains a double edged sword (as it may have been used to buy them back then).
Trade wisely.
Trade ideas

SI (Silver Futures) UpdateSI went oversold on MFI, since SLV options are so expensive, I decided to go long on GLD calls instead on that afternoon drop. Looked like a mistake for most of the evening, lol. Probably still is because SLV calls will have a better return tomorrow.
But, I will follow my rule, never kick yourself when you make money.
This is why I track 3 hr futures on everything.

Silver Futures at All Time HighsThe Silver Futures market has experienced an extraordinary, historic surge over the past year, with prices more than doubling since the start of 2025 and hitting new all-time highs above $59 per troy ounce in recent trading. This aggressive rally is fueled by a dual-catalyst narrative. On one hand, silver is benefiting from the same safe-haven demand driving gold, particularly amid global economic uncertainty and expectations of Federal Reserve interest rate cuts, which traditionally boost non-yielding assets. On the other, the metal's price action is heavily underpinned by a severe physical supply deficit. With mining output flat and industrial demand—particularly from the accelerating green energy transition rising sharply, inventories have dwindled, causing the cost to lease silver to soar and forcing an intense focus on physical delivery for futures contracts.
This exceptional outperformance by silver has profoundly impacted the Gold-to-Silver Ratio, which measures how many ounces of silver it takes to buy one ounce of gold. The ratio began 2025 at elevated levels (near 100:1 or higher), suggesting silver was historically cheap relative to gold. However, as silver's price surged by over 100%—far outpacing gold's robust 60% gain over the same period—the ratio has aggressively tightened, falling to levels around 75:1. This steep drop signals a market revaluation of silver, moving it out of gold's shadow and highlighting its critical, dual role as both a monetary metal and an indispensable industrial commodity. Many analysts view the narrowing ratio as confirmation of silver's powerful long-term bull market, driven by its unique positioning in the modern, electrified global economy.
If you have futures in your trading portfolio, you can check out on CME Group data plans available that suit your trading needs tradingview.com/cme/
*CME Group futures are not suitable for all investors and involve the risk of loss. Copyright © 2023 CME Group Inc.
**All examples in this report are hypothetical interpretations of situations and are used for explanation purposes only. The views in this report reflect solely those of the author and not necessarily those of CME Group or its affiliated institutions. This report and the information herein should not be considered investment advice or the results of actual market experience.

Why Silver Is Reaching New High?Why Is Silver Reaching New Highs?”
There are two key reasons for this:
First, it is due to de-dollarization. At this juncture, there are no other currencies ready to take over as the dominant reserve currency. Therefore, the market is turning to precious metals like gold and silver. We can also observe that each time the dollar trends lower, precious metals tend to move in the opposite direction.
Second, why is silver gaining momentum over gold this time? While gold is still trading below its October high, silver has already broken above it with strong momentum.
These are the two questions we will be discussing today.
Mirco Silver Futures
Ticker: SIL
Minimum fluctuation:
0.005 per troy ounce = $5.00
Disclaimer:
• What presented here is not a recommendation, please consult your licensed broker.
• Our mission is to create lateral thinking skills for every investor and trader, knowing when to take a calculated risk with market uncertainty and a bolder risk when opportunity arises.
CME Real-time Market Data help identify trading set-ups in real-time and express my market views. If you have futures in your trading portfolio, you can check out on CME Group data plans available that suit your trading needs www.tradingview.com

You want to be cautious on gold and silver which are bullish This is December 2nd with a follow up of yesterday's video. Both markets are very bullish but there may be a correction coming so I would be cautious and I explain that on the video. I spend a lot of time on the videos showing you how you look at minute changes on the bars before you actually take a trade.

!!! SILVER CLOSE TO HISTORICAL YEARLY BREAKOUT !!!!!! SILVER CLOSE TO HISTORICAL YEARLY BREAKOUT !!!
Those with a +10 year time horizon should do GREAT holding silver. Most likely hitting $250 before it ends.
Now, if we get a severe market downturn in 2026, it's also reasonable to expect a retest of that breakout line at $31.

It's Sunday and I'm looking at gold and silverSilver and gold are going up the silver looks very bullish but I would be looking for reversals and perhaps a retest to one of the areas where the market gapped higher I would expect some reversal here but the although this would have been a very profitable trade for both markets the gold and the silver if you'd gotten into these bars and the patterns aren't telling me that I I have to exit the markets because we don't see any real sellers so we need to wait a little bit.

Review and plan for 2nd December 2025Nifty future and banknifty future analysis and intraday plan.
This video is for information/education purpose only. you are 100% responsible for any actions you take by reading/viewing this post.
please consult your financial advisor before taking any action.
----Vinaykumar hiremath, CMT

SI - hourly chartT.A explained -
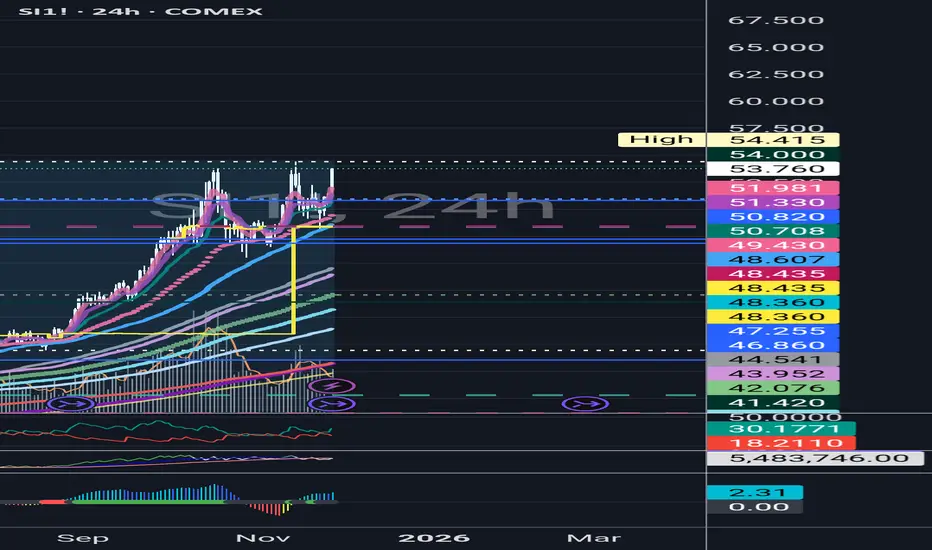
BackSide (BS)
FrontSide (FS)
Inverse BS (Inv.BS)
Inverse FS (Inv.FS)
BS & FS levels are expected support when dashed lines, tested when dotted and resistance when solid lines.
The inverse is true for the Inv. BS Inv. FS levels, they are resistance as dashed lines, tested as dotted and support as solid lines.
Monthly timeframe is color pink
weekly grey
daily is red
4hr is orange
1hr is yellow
15min is blue
5min is green if they are shown.
strength favors the higher timeframe.
2x dotted levels are origin levels where trends have or will originate. When trends break, price will target the origin of the trend. its math, when the trend breaks, the vertex breaks too so the higher timeframe level/trend that breaks, the more volatility there could be as strength in the orders flow in to fuel the move.

Silver MCX Future Forming Bullish Pattern - Ready to FlyMCX:SILVER2!
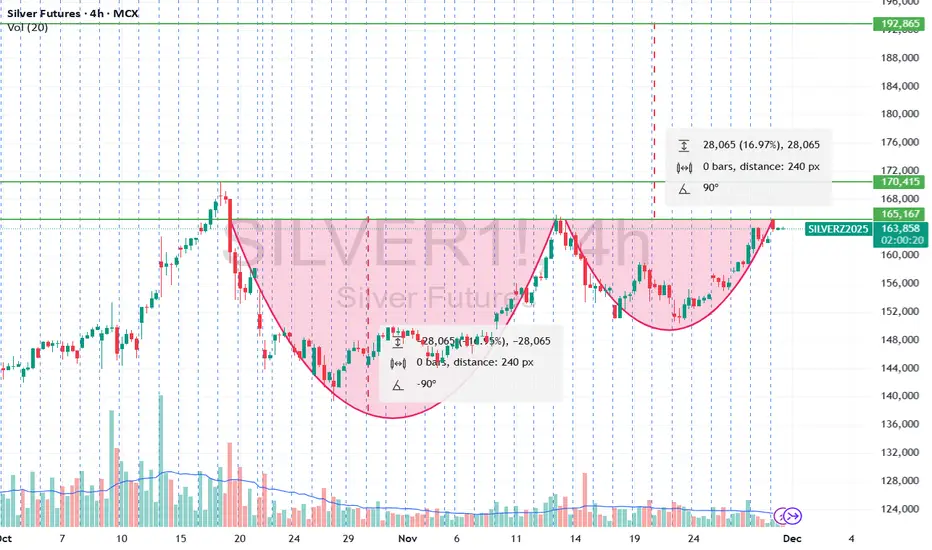
Silver MCX futures have formed a rounding‑bottom structure, where the left and right swings create a smooth “U” base and the latest consolidation builds the handle just under resistance near 1,69,000.
This pattern reflects accumulation – repeated buying on dips with sellers getting absorbed near the same resistance – and a breakout above the neckline often leads to a strong continuation leg higher.
The depth of the cup projected from the breakout area gives an approximate upside objective, which lines up well with your zones around 1,85,400 (Target 1) and 2,02,000 (Target 2).
Such swing setups work best when combined with strict money management – small fixed risk per trade and non‑negotiable exits when the pattern invalidates.
Execution Section – Educational Trade Idea
Instrument: Silver MCX Futures (4H)
Bias: Bullish above neckline only
Entry
Planned long entry above 1,69,000 once a 4H candle closes convincingly over this level (body closing above, not just a wick spike).
Stop‑Loss
Small stoploss: Around 1,60,000 – below handle support; if price closes under this, treat it as handle failure and reduce/exit.
Positional stoploss: Around 1,53,500 – below the major swing low of the cup; a close under this level invalidates the entire bullish structure.
Targets
Target 1: 1,85,400 – first measured‑move objective; good place to book partial profits and trail stop to cost or just below new support.
Target 2: 2,02,000 – extended target if momentum sustains; manage with a trailing stop under higher lows to lock in gains.
Risk Guidelines for Followers
Risk only 1–2% of trading capital on this idea and size the lot according to distance from entry to chosen stop (small or positional).
If either stop is hit, close without averaging or shifting stops; the goal is to survive many trades, not to be right on one trade.

A case for silver.Silver is currently under significant regulatory constraints, and its prevailing market price does not incentivize the allocation of capital toward ventures focused on increasing its supply. This creates a supply constraint for the asset.
Beyond its role as an inflation hedge, a characteristic shared by most commodities, silver possesses unique properties that are particularly valuable for industrial applications. As we stand on the brink of a new wave of industrial expansion, silver's conductivity and reflectivity make it indispensable in various technologies, such as solar panels (where China leads in production), antifreeze formulations, and numerous other applications.
Recently, President Putin announced that Russia will include silver in its strategic reserves. Meanwhile, China has been engaging in confidential agreements with miners and refiners to secure prices over extended periods. Due to China's relatively loose regulatory framework, these transactions are not publicly disclosed, and as a result, they are not reflected in silver's market price. This can be said for African, Latin-American, or other Asian countries with loose regulation for these kinds of markets. Silver pricing predominantly occurs on the futures market, which underscores cases where a disconnect arises between market prices and underlying realities, leading to potential distortions in valuation.
Case 1: JP Morgan commodities trading desk scandal.
" A federal jury in the Northern District of Illinois convicted a former trader at JPMorgan Chase and Credit Suisse today of fraud in connection with a spoofing scheme in the gold and silver futures markets.
According to court documents and evidence presented at trial, Christopher Jordan, 51, of Mountainside, New Jersey, was an executive director and trader on JPMorgan’s precious metals desk in New York from 2006 to 2009, and on Credit Suisse’s precious metals desk in New York in 2010. Between 2008 and 2010, Jordan placed thousands of spoof orders, i.e., orders that he intended to cancel before execution, to drive prices in a direction more favorable to orders he intended to execute on the opposite side of the market. Jordan engaged in this deceptive spoofing strategy while trading gold and silver futures contracts on the Commodity Exchange (COMEX), which is a commodities exchange operated by the CME Group. These deceptive orders were intended to inject false and misleading information about the genuine supply and demand for gold and silver futures contracts into the markets... Four other former JPMorgan precious metals traders were previously convicted in related cases. In August 2022, Gregg Smith and Michael Nowak... spoofing... In October 2018, John Edmonds pleaded guilty in the District of Connecticut... wire fraud, commodities fraud, price manipulation, and spoofing... In August 2019, Christian Trunz pleaded guilty in the Eastern District of New York to one count of conspiracy to engage in spoofing and one count of spoofing... "
This is the article if you'd like to read more: www.justice.gov
My thoughts; This type of practice is an example of how there always a disconnect with real life and markets. One must also remember how information travels and the infrastructure and systems in place that runs our financial system. I believe JP Morgan's swift settlement shows to me there was not much accountability addressed.
Case 2: Silver Thursday, Hunts Brothers, 1970s
" Nelson Bunker Hunt and William Herbert Hunt — oil company executives, investors and brothers — first began purchasing silver in the early 1970s at a price of less than $2 per ounce. The Hunt brothers’ fervor for silver accelerated dramatically following the death of their father in 1974, a Texas oil tycoon known as H.L. Hunt. His passing released a $5 billion fortune to members of the Hunt family.
Fueled by an enormous amount of capital, the Hunt brothers continued stockpiling silver and purchasing silver futures contracts. By early 1979, the price of silver had risen to about $6 per ounce. The Hunt brothers acquired roughly 195 million ounces of silver, about a third of the world’s total supply. They facilitated their silver purchases in part by investing in futures contracts through several brokers, including Bache Halsey Stuart Shields, Prudential-Bache Securities, and Prudential Securities. By December 1979, the market price for silver fluctuated between $20 and $25 per ounce.
Silver had become exorbitantly expensive even for practical uses. Doctors struggled to afford X-ray film for patients, families melted down their heirloom silver flatware, silver burglaries skyrocketed, and Tiffany’s & Co. was forced to drastically raise its jewelry prices. Tiffany’s even took out a full-page ad in the New York Times criticizing the Hunt brothers, writing, “We think it is unconscionable for anyone to hoard several billion, yes billion, dollars’ worth of silver and thus drive the price up so high that others must pay artificially high prices for articles made of silver.”
Silver reached a record high of $48.70 per ounce on Jan. 18, 1980. By some estimates, the Hunt brothers’ entire silver fortune peaked at a value of $10 billion.
Thursday, March 27, 1980
Facing out-of-control silver prices, COMEX (Commodity Exchange, Inc.), a division of the New York Mercantile Exchange (NYMEX), acted against the Hunt brothers. On Jan. 7, 1980, COMEX introduced Silver Rule 7, which placed heavy restrictions on the purchase of commodities on the margin.
Following its peak price of $48.70 per ounce, silver began its decline and the Hunt family’s silver fortune began to shrink.
On March 27, 1980, known as Silver Thursday, the price of silver dropped 50% in a single day, from $21.62 to $10.80 per ounce. The Hunt brothers failed to meet several margin calls and about $7 billion in paper assets suddenly turned into a $1.7 billion debt.
The sudden price drop threatened to collapse several investment firms and banks. To prevent widespread financial chaos, multiple banks joined together to issue the Hunt brothers a $1.1 billion line of credit..."
The original article: learn.apmex.com
My thoughts: Now you see that one entity can have huge influence on the market. Your once dusty silver mirror can become valuable enough for you to go and find it and clean it and sell it.
One actionable step you can take today is to capitalize on silver's current low valuation. There's clearly a lag between what's happening in the physical market and how that information gets reflected in exchange prices. Interestingly, we've seen noticeable price increases and premiums when buying physical silver, but there hasn’t been much movement in the more liquid instruments like the GLD or SLV ETFs—which, by the way, JPM vaults silver for. This disconnect exists because the market takes time to catch up to reality. What’s your take on this?
More articles:
marketsanity.com
www.justice.gov
www.reuters.com
www.investing.com
seekingalpha.com
investingnews.com
metalsedge.com
www.moneymetals.com

Silver - Warning #1 IssuedSilver has seen uninterrupted gains for a period of over 1.5 years. It's going to just keep going up forever right? Not necessarily...
Our systems at Bullfinder-official have identified potential risk in MCX:SILVER1! ,
issuing Warning #1.
Silver has been moving aggressively to the upside for some time now, hitting +166% since Feb of 2024, with momentum deemed as Bullish since March of 2024.
Although this may not be the exact top of this run, we would like to make note that current regions present greater levels of risk and may warrant greater caution.
We're inspired to bring you the latest developments across worldwide markets, helping you look in the right place, at the right time.
Thank you for reading! Stay tuned for further updates, and we look forward to being of service along your trading & investing journey...
Disclaimer: Please note all information contained within this post and all other Bullfinder-official Tradingview content is strictly for informational purposes only and is not intended to be investment advice. Please DYOR & Consult your licensed financial advisors before acting on any information contained within this post, or any other Bullfinder-official TV content.

SILVER (XAGUSD): Multi-Decade ATH Breakout Confirmed. $80+ Next?
The Thesis: After decades of forming a colossal base, Silver (XAGUSD) has confirmed a structural breakout above its multi-decade all-time high resistance zone, previously capped between $49.76 and $55.00. This is not a short-term trade; it marks the beginning of a new secular bull market for the metal.
Technical Confirmation
The Breakout: A sustained weekly/monthly close above the $55.00 level is critical and confirms the elimination of the 45-year resistance ceiling.
Measured Move Target: The completion of this massive basing pattern projects a minimum initial target toward the $75.00 - $80.00 range.
Momentum: Key momentum show strong upward conviction, indicating that this move is supported by heavy institutional volume.
Fundamental Drivers
Structural Deficit: Global mine supply and recycling are chronically insufficient to meet demand. The Solar/Photovoltaic and Electric Vehicle (EV) industries are creating a massive, unyielding demand floor. Analysts project a fifth consecutive year of significant supply deficit.
Monetary Tailwinds: Expectations of a dovish Fed and eventual rate cuts are pushing investors toward non-yielding assets. The Gold/Silver Ratio is falling, suggesting silver is playing catch-up to gold with amplified gains.
Risk Management
The current bullish thesis would be heavily invalidated if XAG/USD sees a decisive weekly close back below the psychological $50.00 level, which was the prior critical resistance turned support.
CUP & HANDLE✅ 1. Pattern Type: Double Cup (Twin Cup) With Horizontal Neckline
Your chart shows:
✔️ Two large rounded bottoms
✔️ Both bottoms reach nearly the same support area
✔️ Upside rejections happen at nearly the same level
✔️ A single flat resistance line (neckline) at ~165,100 – 170,400 zone
This is a very bullish basing structure.
✅ 2. Why this pattern is powerful
A single cup & handle is already a bullish pattern.
But you have two consecutive cups, meaning:
🔥 Strong accumulation
🔥 Repeated buying interest at lower levels
🔥 Sellers getting weaker on each test
🔥 Smart money accumulation phase
This is NOT random — it shows institutions loading positions over weeks.
✅ 3. Understanding the Structure
⭕ First Cup
Sharp fall
Long rounded bottom
Gradual rise to neckline
Heavy accumulation region
⭕ Second Cup
Pullback
Higher low compared with first cup → bullish sign
Final rally toward neckline
Volume starts increasing → breakout pressure building
✔ Neckline (Major Resistance): ~165,000–170,400
This is the critical breakout level.
Price tested the neckline three times.
Every time sellers pushed it down — but with reduced strength.
This often indicates:
➡ Buyers are absorbing all sell orders
➡ Breakout is only a matter of time
✅ 4. Target Projection (Breakout Target)
You have already plotted the measurement correctly:
Cup Depth = ~28,065 points (16.97%)
Classic Cup & Handle breakout rule:
📌 Breakout Target = Neckline + Cup Depth
If breakout occurs above ~170,400, then:
🎯 Target = 170,400 + 28,065 = ~198,500
Your chart shows similar levels (192,865 is conservative target).
198k is extended target.
✅ 5. What must happen next? (Breakout Conditions)
✔ Strong candle close above neckline (no wick rejection)
✔ Volume spike confirming buyer dominance
✔ Retest of neckline as support (optional but ideal)
✔ Follow-through higher highs
If breakout is real, Silver can trend strongly for weeks.
✅ 6. Failure Conditions (Invalidation)
Pattern fails if:
❌ Price closes below second cup bottom
(around 147,000 – 150,000 area)
That would indicate breakdown from accumulation → turning into distribution.
But right now, price is bullish.
✅ 7. Market Psychology Behind the Pattern
This pattern tells a story:
1️⃣ First Cup = Panic selling → slow accumulation
2️⃣ Resistance rejection = Profit booking
3️⃣ Second Cup = Higher low → buyers stronger
4️⃣ Repeated top rejections = sellers weakening
5️⃣ Breakout = Markup phase begins
This is how smart money loads positions quietly and then drives the breakout.
✅ 8. Trading Strategy
🔥 Aggressive Entry
Enter on breakout strong candle above 170,400.
🔥 Conservative Entry
Wait for retest of neckline:
Price breaks above
Comes back to test support
Holds
Then go long
Stop Loss
Below second-cup mid-point (~158,000–160,000 region).
Targets
T1: 178,000
T2: 185,000
T3: 192,865 (your marked target)
Extended: 198,500
Opportunity :: LONG Silver (Micro)As they say, data says it all.
Silver is systematically rising in a channel on the back of global news and issues.
Data suggests no weakness and upward targets of 189,000 and 202,000.
Good entry point could be near 179,000. This level is 5 EMA support too. Break down or closing below this level needs to be followed closely.

Silver and Gold Flag and Pole PatternBoth Silver and Gold are forming Flag and pole pattern on charts. If the breakout sustains and prices go higher with support of relatively higher volumes, both commodities can achieve higher prices in near term. The momentum is currently on bulls side in both commodities but silver has more relative strength than gold. So watch both commodities for breakout.

Silver Cup and HandleAfter some consolidation silver has started showing immense strength. Silver is buy on dips. Take long positions in silver in any dip you get. Check the chart for the cup and handle pattern on the daily timeframe.
Support will be the low of the handle as seen on the chart for big risk takers and for small risk takers sl can be around 157000.
Target- One can look for all time highs as target and then 180000.
Disclaimer- This is just for educational purpose.
Jai Shree Ram

$SI_F on its way to 65Once we break 54 again we will see Silver Futures and the silver related stocks AMEX:SLV AMEX:PSLV NYSE:PAAS NYSE:AG AMEX:AGQ move up and potentially a beautiful #shortsqueeze for those with high short volume.
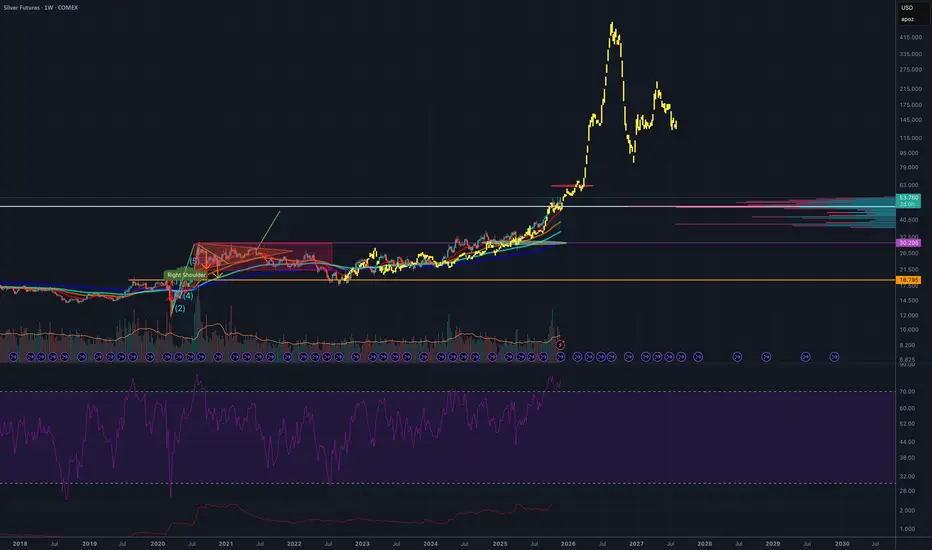
1970s Silver breakout pattern to 2025A technical analysis chart that overlays the 1970s silver breakout pattern onto the projected price action for 2025. The chart illustrates how the historical parabolic move that silver experienced during the late-1970s bull cycle could repeat in a modern context. By aligning the timeframes and scaling the price structures, the chart highlights a potential breakout setup forming in 2025 that mirrors the earlier pattern. This visual comparison is used to infer a possible target price for 2026 based on the magnitude and trajectory of the 1970s rally, offering a speculative projection grounded in historical market behavior.
Saturday Review This is Saturday the 22nd and I reviewed three markets that would have had winning long trades with very small stops. You will hear a lot of well known traders tell you should not scalp the markets and you'll find even more traders tell you not to short the market especially into to go lower indications that the market. Personally I believe you should be very careful about the stock market and personally I believe it's going to go a lot lower but that doesn't mean that you can't scalp the market when it is appropriate and where the market tells you where the small stop is. In difficult markets like this you need to be more patient as long as you know that the nature of the market isn't as easy as it is at other times these reversal setups happened yesterday when the markets were making their last move lower before the buyers came in. If you are starting trading and you are facing markets that we've had in the past couple of weeks you have to trade less and look for what is needed to trade successfully but you can't do it when you're impulsively trading or you're trading a style that you're not really connected with because you need more time and evidence.

DownIf price stay below red line or get reflected by red price line look for price to fall. Expect downside acceleration as RSI passes down through the solid red bull divergence line. Target close to 46.00 initial.

these are tough marketsI looked at a number of charts tonight to show you some pending long trades in a very difficult market and you must be cautious, and you must wait for the trigger

Possible topIf silver closes the week red then I believe near term top is confirmed and a sell off to 40.00 will happen. Weekly candles will update tomorrow market close. I may post lower times frames to show loss of momentum
