4000 year old money EuphoriaKudos to my good friends that have patiently waited a decade for this ancient money to finally yield great returns. But it's my job here to urge caution and share the lessons of historical finance.
First, let's try to "value" silver historically:
Code of Hammurabi (1750 BC):
Minimum wage for
Sorry, this is only available to registered users
MCX provides data to our registered users only, so to get it you'll need to sign up for a TradingView account.
Related commodities

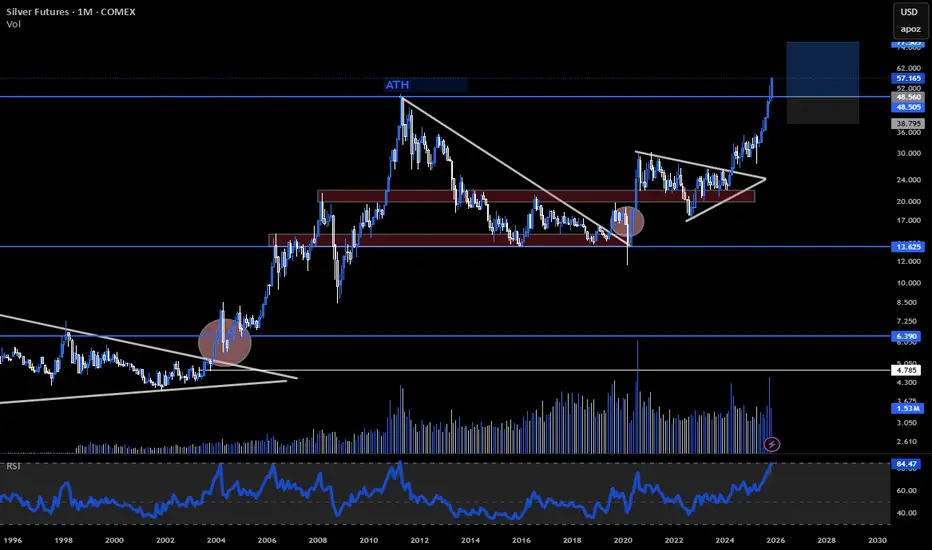
Silver Futures at All Time HighsThe Silver Futures market has experienced an extraordinary, historic surge over the past year, with prices more than doubling since the start of 2025 and hitting new all-time highs above $59 per troy ounce in recent trading. This aggressive rally is fueled by a dual-catalyst narrative. On one hand,

Why Silver Is Reaching New High?Why Is Silver Reaching New Highs?”
There are two key reasons for this:
First, it is due to de-dollarization. At this juncture, there are no other currencies ready to take over as the dominant reserve currency. Therefore, the market is turning to precious metals like gold and silver. We can also ob

You want to be cautious on gold and silver which are bullish This is December 2nd with a follow up of yesterday's video. Both markets are very bullish but there may be a correction coming so I would be cautious and I explain that on the video. I spend a lot of time on the videos showing you how you look at minute changes on the bars before you actually take a

!!! SILVER CLOSE TO HISTORICAL YEARLY BREAKOUT !!!!!! SILVER CLOSE TO HISTORICAL YEARLY BREAKOUT !!!
Those with a +10 year time horizon should do GREAT holding silver. Most likely hitting $250 before it ends.
Now, if we get a severe market downturn in 2026, it's also reasonable to expect a retest of that breakout line at $31.

It's Sunday and I'm looking at gold and silverSilver and gold are going up the silver looks very bullish but I would be looking for reversals and perhaps a retest to one of the areas where the market gapped higher I would expect some reversal here but the although this would have been a very profitable trade for both markets the gold and the si

Review and plan for 2nd December 2025Nifty future and banknifty future analysis and intraday plan.
This video is for information/education purpose only. you are 100% responsible for any actions you take by reading/viewing this post.
please consult your financial advisor before taking any action.
----Vinaykumar hiremath, CMT

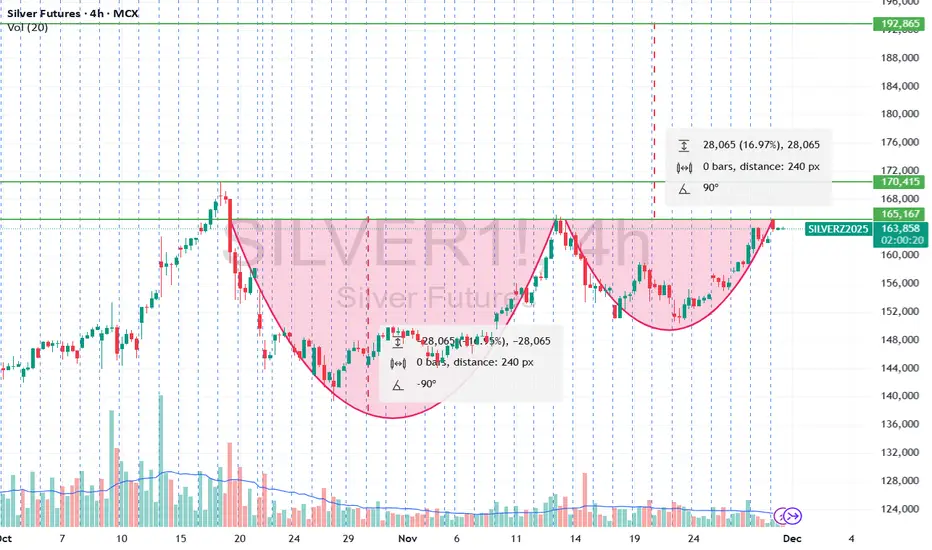
Silver MCX Future Forming Bullish Pattern - Ready to FlyMCX:SILVER2!
Silver MCX futures have formed a rounding‑bottom structure, where the left and right swings create a smooth “U” base and the latest consolidation builds the handle just under resistance near 1,69,000.
This pattern reflects accumulation – repeated buying on dips with sellers getting

CUP & HANDLE✅ 1. Pattern Type: Double Cup (Twin Cup) With Horizontal Neckline
Your chart shows:
✔️ Two large rounded bottoms
✔️ Both bottoms reach nearly the same support area
✔️ Upside rejections happen at nearly the same level
✔️ A single flat resistance line (neckline) at ~165,100 – 170,400 zone
This is a
SILVER (XAGUSD): Multi-Decade ATH Breakout Confirmed. $80+ Next?
The Thesis: After decades of forming a colossal base, Silver (XAGUSD) has confirmed a structural breakout above its multi-decade all-time high resistance zone, previously capped between $49.76 and $55.00. This is not a short-term trade; it marks the beginning of a new secular bull market for the m
See all ideas
A representation of what an asset is worth today and what the market thinks it will be worth in the future.
Sorry, this is only available to registered users
MCX provides data to our registered users only, so to get it you'll need to sign up for a TradingView account.
Displays a symbol's price movements over previous years to identify recurring trends.