London setup London will create the low of the day & NY session will be a continuation of London session today with greater portion of displacement.
Trade ideas
GC UpdateGold and silver appear to be stalled out right now, waiting for MFI to hit oversold.
Sucks they hit the sell button right before open, I was carrying EWZ (Brazil) calls overnight. Their market opens before the US, it was up big then reversed when futures went down. Brazil stock market tends to move with commodities.
Unfortunately you can't sell options premarket. Made a small profit though.

GOLD (XAUUSD): bullish-Neutral! Prepare To Buy!In this Weekly Market Forecast, we will analyze the Gold (XAUUSD) for the week of Dec. 8 - 15th.
Gold closed last week indecisive. It has been moving sideways inside a bullish FVG, that continues to act as support.
Prepare for a short term pullback.... and buy it.
Mindful that FOMC is Wednesday, and the USD is weakened with the expectation of a .25 rate cut.
Enjoy!
May profits be upon you.
Leave any questions or comments in the comment section.
I appreciate any feedback from my viewers!
Like and/or subscribe if you want more accurate analysis.
Thank you so much!
Disclaimer:
I do not provide personal investment advice and I am not a qualified licensed investment advisor.
All information found here, including any ideas, opinions, views, predictions, forecasts, commentaries, suggestions, expressed or implied herein, are for informational, entertainment or educational purposes only and should not be construed as personal investment advice. While the information provided is believed to be accurate, it may include errors or inaccuracies.
I will not and cannot be held liable for any actions you take as a result of anything you read here.
Conduct your own due diligence, or consult a licensed financial advisor or broker before making any and all investment decisions. Any investments, trades, speculations, or decisions made on the basis of any information found on this channel, expressed or implied herein, are committed at your own risk, financial or otherwise.

Silver now at $58.Way back in mid 2023, before gold and silver broke out.
I suggested silver (was $24) tracks gold's performance vs inflation.
Silver now at $58.

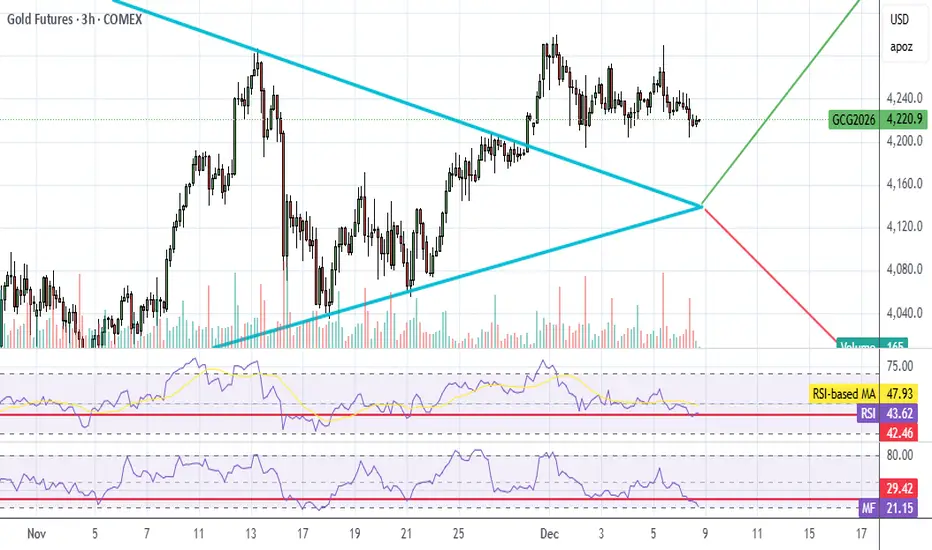
Triple Top - Double Bottom. Go Next Golden Shift4200 for a potential reload (supply area). 4300 - to take it more bag.
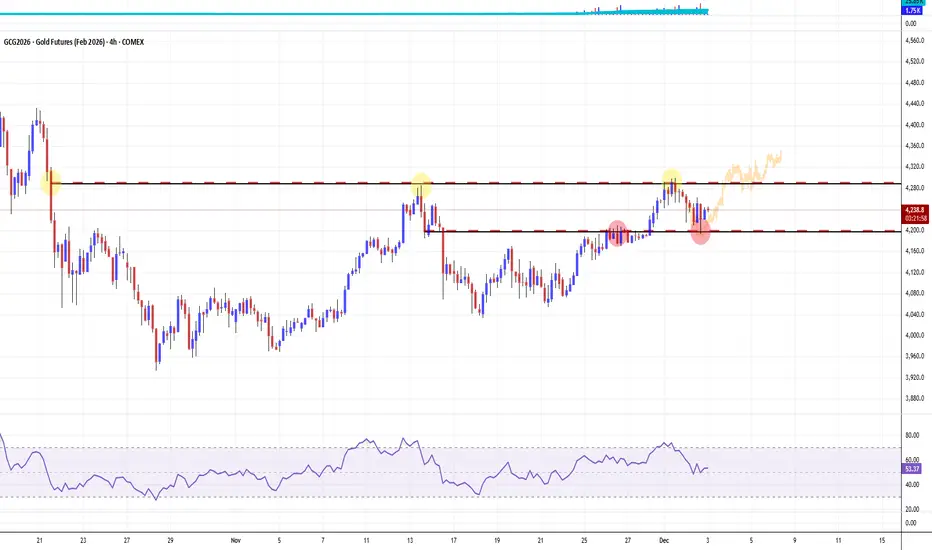
Looking to buy GCGC fell on Friday leaving inefficiency above. 4H closed bullish with expansion candle. Looking to buy from 15M engulfed candle (order block). Going for bit more than 2R. 4H candle high is the first target

Gold Weekly Playbook: Key Levels, Scenarios & Sentiment Triggers1. Macro Update
Gold continues to trade within a macro environment defined by shifting rate expectations and evolving recession probabilities. With the Fed maintaining a data-dependent stance, the market remains highly sensitive to inflation and employment prints. Cooling inflation supports the case for rate cuts, pulling real yields lower and creating a constructive backdrop for gold.
Conversely, stubborn inflation pushes the narrative toward “higher for longer,” often slowing upside momentum and encouraging more rotational price action. This doesn’t immediately turn GC bearish, but it does cap impulsive continuation as traders reassess forward guidance.
Recession sentiment is the second major driver. Rising recession odds tend to benefit gold as investors rotate into safe-haven assets, even without imminent Fed easing. A persistent soft-landing narrative—stable labor markets, steady consumption—can reduce defensive flows and temper gold’s velocity. Overall, the macro backdrop remains cautiously supportive, but still very catalyst-driven.
2. What Has the Market Done?
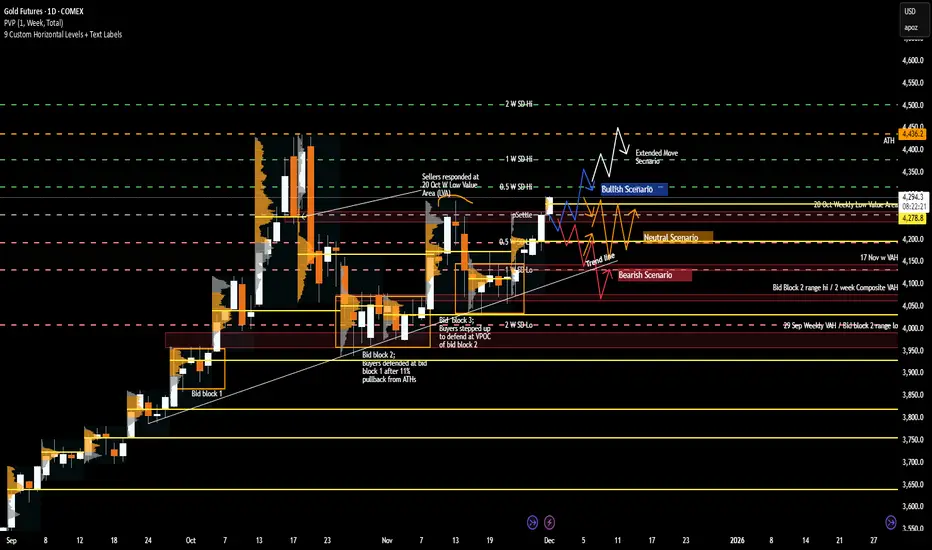
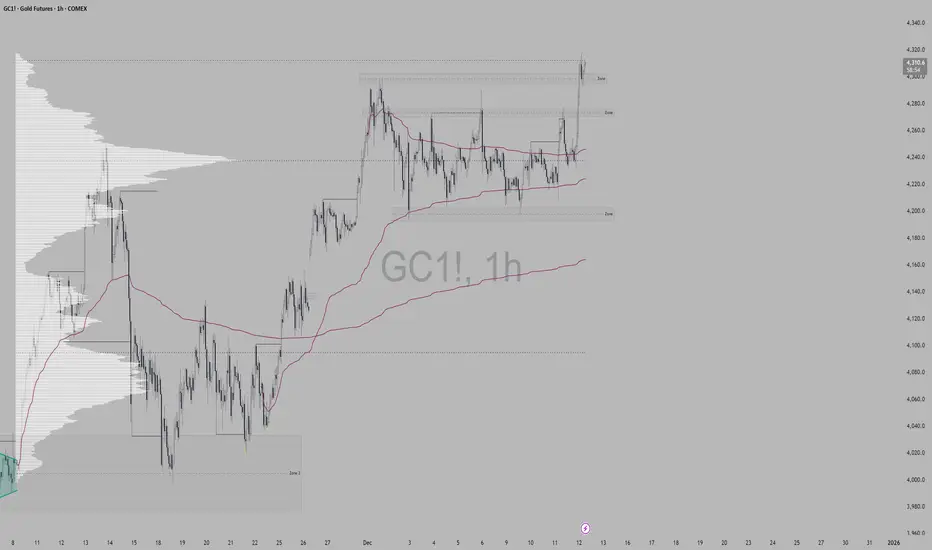
Gold has exhibited constructive price action, with the recent week imbalancing up and out of the 17 Nov weekly balance/value area. Importantly, the market closed at the highs of the week, signaling sustained buyer aggression and broad acceptance of higher prices.
Weekly value and Volume point of Control (VPOC) have shifted upward, reinforcing a meaningful change in participant behavior: buyers are willing to transact at progressively higher prices, and sellers have not shown the ability to force price back into prior balance. This upward migration of value marks a firm shift in short-term sentiment.
The market is also now at an important structural zone at 4251.3—the 13 Oct weekly VPOC and the 20 Oct weekly Low value area (LVA). How the market reacts at this level—rejecting, stalling, or accepting—will be a telling indicator of whether buyers maintain control or whether sellers can slow the advance.
3. What to Expect in the Coming Week
The key level to watch this week:
4254.9 - Previous week/month’s settlement price
This level acts as a major pivot for directional conviction. Holding above settlement supports the case for continuation; a sustained move below it increases the likelihood of rotation or deeper testing.
Bullish Scenario
If the market holds and accepts above 4254.9, upside continuation becomes likely.
Target 1: 4378.6 (Weekly 1 Standard Deviation (SD) High) – expect responsive sellers.
If market accepts above 4378.6:
Target 2: 4436.2 (ATH region) – extended bullish objective.
Bearish Scenario
If the market fails to hold above 4254.9, expect sellers to target 4195.3 (previous week’s VPOC).
Additional downside triggers:
If buyers cannot reclaim 4261.3 (previous week’s high), pressure may push price through prior value toward 4136.5.
If buyers then fail to reclaim back above 4195.3:
Next target: 4131.2 (Weekly 1 SD Low / 17 Nov VPOC / Bid Block 3 midpoint).
Continued seller control may extend the move toward 4070/80, aligned with the 2-week composite VAH and upper boundary of Bid Block 2.
Neutral Scenario
If neither buyers nor sellers show conviction, expect two-way consolidation around previous week’s settlement, 4254.9, between 4316.7 and 4193.1 (10 Nov weekly high / 20 Oct LVA / weekly 0.5 SD high).
This remains the most probable balance zone unless a macro catalyst drives breakout behavior.
This week’s structure is clean: one major pivot and clearly defined pathways for both sides. Whether GC breaks out or slips back into rotation will hinge on how price behaves around 4254.9.
What’s your outlook for Gold this week? Drop a comment and give this post a boost so more traders in the community can join the discussion!
Disclaimer: This is for educational purposes only and not financial advice. Always trade your own plan with proper risk management.
$GC, Gold: In Wave 5 upCSE:GC , Gold: I count it as having finished (IV) waves and we're in 5 of Wave (V). This wave can take us to $4900. A substantial correction follows after that, if this count is correct. However, the 5th wave can extend so we'll see how the technical indicators appear after reaching the 5th wave target.
I presently have a 3.1% portfolio allocation to gold through GLD.

GC UpdateIndicators and trend looks bearish for Monday.
I flipped my GLD calls in the morning, a bit early because I had a meeting to attend. It was a good day to be early than late though, lol.
No position. Not sure if it will go down enough to make any money off puts.

GOLD: Bullish! Look For Valid Buys!In this Weekly Market Forecast, we will analyze the Gold (XAUUSD) for the week of Dec. 1-5th.
Gold rallied last week, breaking the rangy consolidation. The strong close indicates the potential for some bullish follow through going into this week.
Look for valid buys.
Enjoy!
May profits be upon you.
Leave any questions or comments in the comment section.
I appreciate any feedback from my viewers!
Like and/or subscribe if you want more accurate analysis.
Thank you so much!
Disclaimer:
I do not provide personal investment advice and I am not a qualified licensed investment advisor.
All information found here, including any ideas, opinions, views, predictions, forecasts, commentaries, suggestions, expressed or implied herein, are for informational, entertainment or educational purposes only and should not be construed as personal investment advice. While the information provided is believed to be accurate, it may include errors or inaccuracies.
I will not and cannot be held liable for any actions you take as a result of anything you read here.
Conduct your own due diligence, or consult a licensed financial advisor or broker before making any and all investment decisions. Any investments, trades, speculations, or decisions made on the basis of any information found on this channel, expressed or implied herein, are committed at your own risk, financial or otherwise.

Gold. This is what the opportunity setup looked like.Gold.
This is what the opportunity setup looked like way back in August of 2023.
Price was $1922. Now $4226. Over 120% higher.
There is no such opportunity now.

Gold Bulls Are Making Hard Work of New HighsI remain sceptical of gold’s latest bounce and continue to look for signs of a swing high. A less-dovish — or relatively hawkish — Fed cut this week could be the catalyst for a stronger US dollar and lower gold. Either way, it’s hard to imagine gold breaking back above its record high without a meaningful dip first.
Matt Simpson, Market Analyst at City Index.

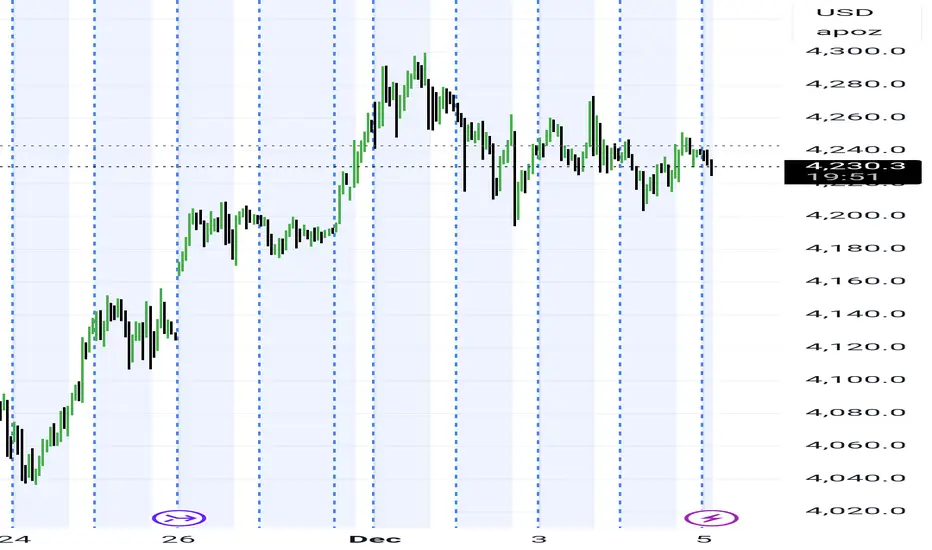
Gold trending or mean revertingTrading near the upper zone may indicate a potential reversal or pullback toward efficiency levels.
GC (gold) updateMFI is touching oversold....
Might take a shot at some GLD calls tomorrow, not sure because Fed meeting on Wed.
GC (gold) UpdateMFI hit overbought and SI (silver) hit overbought on RSI.
Decided it was easier to trade stock options than commodities today. No position.


Multi Top - Multi Bottom. Go Next Your Golden Shift4200 for a potential reload (supply area). 4300 (b/throgh) - to take it more bag.

GC daily trade plan for Dec 10, 2025Gold is in the consolidation range. Market is awaiting FOMC meeting. I do not expect any big moves ahead of that meeting however I will watch for trade signals at the extremes of that consolidation

How to Use ATR in TradingViewMaster ATR using TradingView's powerful charting tools in this step-by-step tutorial from Optimus Futures.
ATR, or Average True Range, is a volatility indicator that helps traders measure market movement, set appropriate stop losses, and adjust position sizing based on current market conditions.
What You'll Learn:
Understanding ATR as a volatility measurement tool that tracks price movement regardless of direction
How ATR calculates the average range between highs and lows over a specified period — typically 14
Why rising ATR signals increasing volatility and larger price swings
Why falling ATR indicates decreasing volatility and quieter market conditions
Using ATR to set dynamic stop losses that adjust to current volatility rather than arbitrary dollar amounts
How to calculate stop distances by multiplying ATR by factors like 2x or 3x
Applying ATR for position sizing to maintain consistent risk across different volatility environments
Setting profit targets based on ATR multiples to align with actual market movement
Filtering trade setups using ATR levels to avoid low-volatility periods or confirm breakout momentum
How to add ATR on TradingView via the Indicators menu
Understanding the default 14-period setting and how shorter or longer periods affect responsiveness
Practical examples using the E-mini S&P 500 futures chart
Applying ATR across daily, weekly, and intraday timeframes for risk management and trade planning
This tutorial is designed for futures traders, swing traders, and risk-focused analysts who want to integrate volatility-based risk management into their trading approach.
The methods discussed may help you set smarter stops, size positions appropriately, and adapt your trading strategy to changing market conditions across multiple markets and timeframes.
Learn more about futures trading with TradingView: optimusfutures.com
Disclaimer
There is a substantial risk of loss in futures trading. Past performance is not indicative of future results. Please trade only with risk capital.
We are not responsible for any third-party links, comments, or content shared on TradingView. Any opinions, links, or messages posted by users on TradingView do not represent our views or recommendations.
Please exercise your own judgment and due diligence when engaging with any external content or user commentary.
This video represents the opinion of Optimus Futures and is intended for educational purposes only. Chart interpretations are presented solely to illustrate objective technical concepts and should not be viewed as predictive of future market behavior.
In our opinion, charts are analytical tools, not forecasting instruments.

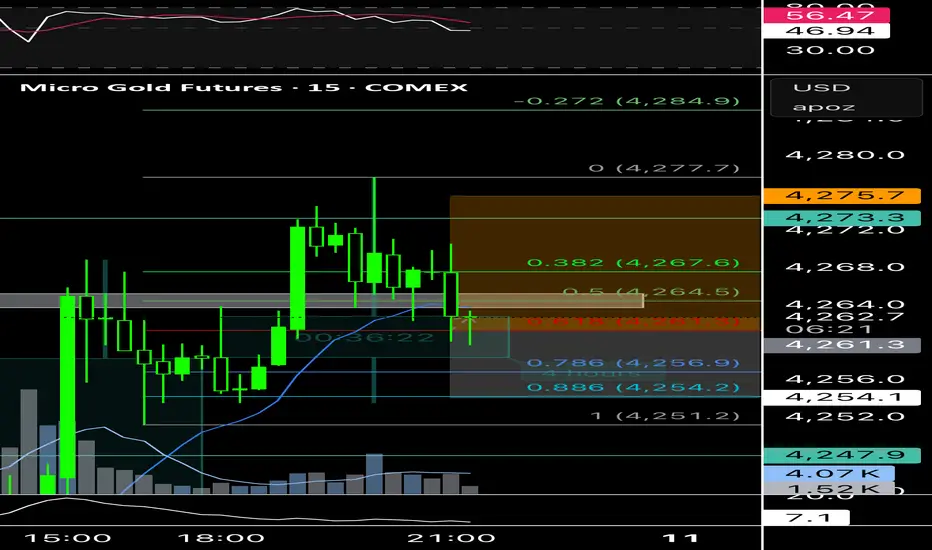
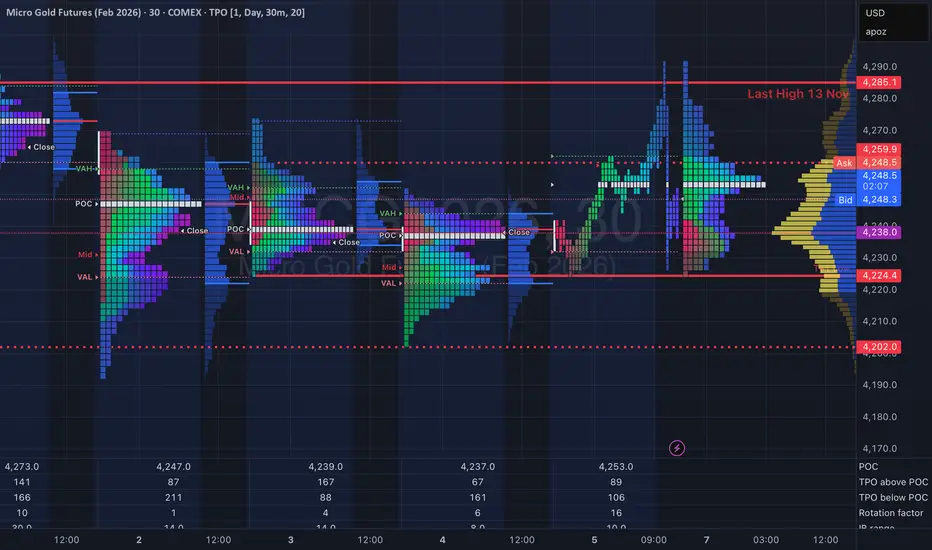
Gold Context: The 4290 Probe & Weekly Balance OutlookFOREXCOM:XAUUSD COMEX_MINI:MGCG2026 COMEX:GC1!
Traders. Weekly wrap-up and context outlook for the next auction.
Market Context (The Rejection):
Gold rejected the 4290 level, falling just short of the 4300 psychological magnet.
• Interpretation: While the day ended with a rejection (excess), we must not ignore that the auction did facilitate trade at these levels. This extension above our 3-day balance indicates intent.
• The Profile: The rally displays characteristics of short covering (squeezing weak shorts) rather than aggressive new buying. The rejection simply indicates the price was "too high" for the current timeframe, but the level remains a valid target for a revisit.
Structure & Outlook (Next Week):
We are monitoring the Weekly Balance zone roughly between 4220 – 4260.
• The Bull Case (Acceptance): If we see continued short covering transition into New Money (OTF) buying above this balance, we look for acceptance at these higher prices. This would open the door to trade through 4300.
• The Bear Case (Liquidation): There is a probability of long liquidation if the auction fails to hold the balance, but I am cautious/skeptical of the downside potential right now.
Plan:
Watch for acceptance vs. rejection relative to the 4220–4260 balance. We need "New Money" to sustain the break of 4300.
Talk to you for the next update.
Gold Long Swing - Set upLooking for Gold to push towards all time high. I am swing the Gold Buy. Using the Key low as point of reversal joined with a pattern the supports the Higher degree continuation. I took and entry and held gold set up from last week.

