Copper Futures (HGX2025): Bullish Continuation Setup Above 5.00
Copper Futures (Nov 2025) is showing renewed bullish strength as price sustains above the 50-day moving average and approaches the upper Bollinger Band.
After forming a strong base near $4.40–$4.50, buyers have gradually regained control, establishing a sequence of higher lows and higher highs.
As long as Copper holds above $4.80, the setup favors a continuation toward $5.50–$6.00.
A confirmed breakout above $5.20 could mark the start of a new bullish leg, potentially retesting yearly highs.
Copper is entering a bullish expansion phase after months of consolidation.
Momentum, structure, and volume all align for an upward bias — a potential trend continuation setup for swing traders and position holders.
Trade ideas

Dr. Copper breakout or breakdown?Copper has been in a channel for around 23 years. The wedge pattern that has formed over the years will come to a decision point in the next few months. My money is on copper staying in the channel. That is to say, the weakness in the economies of Europe, the US, and China will deteriorate into outright recession in 2026.

Long-Term Long HG1 1WScenario A (Correction -> Long):
If the current FVG zone (~$5.00-$5.25) holds the price (i.e. acts as resistance), then a correction will begin
The most likely target for this correction is a test of the support block at 4.56.
If this block holds the price (shows the strength of demand), this will confirm the completion of the correction and give a signal to continue long with the final target at ATX (6.0).
Scenario B (Deep Correction):
If the block at 4.56 is broken (BOS), then the second scenario comes into effect.
The next magnet for price will be the removal of EQL (equal lows) in the OTE zone at 3.92.
This will still be considered an adequate macro correction as long as the price remains above the 'strong low' 3.13."
This is not investment advice!!! Keep your risks low!!! Happy trading!

Copper (HG1) Market Watch Simple & Clear!Copper’s looking strong right now 💪 and it might be setting up for a big move.
Here’s the key level I’m watching:
📈 If copper breaks and closes above 5.41, that could open the door for a run all the way up to 7.13.
That’s a big potential move but only if we hold strong above that breakout level.
💡 Right now, it’s all about confirmation ; a clean close above 5.41 could shift the trend in a big way.
Want to see the chart setup I’m using and how I’m planning around that 5.41 breakout?
💬 DM me “COPPER” and I’ll send you the exact breakdown directly. 🚀
Mindbloome Exchange
Trade Smarter Live Better

COPPER - LONGMCX:COPPER1! New breakout on longer timeframe chart with volume and news may continue further rally like fast furious momentum.

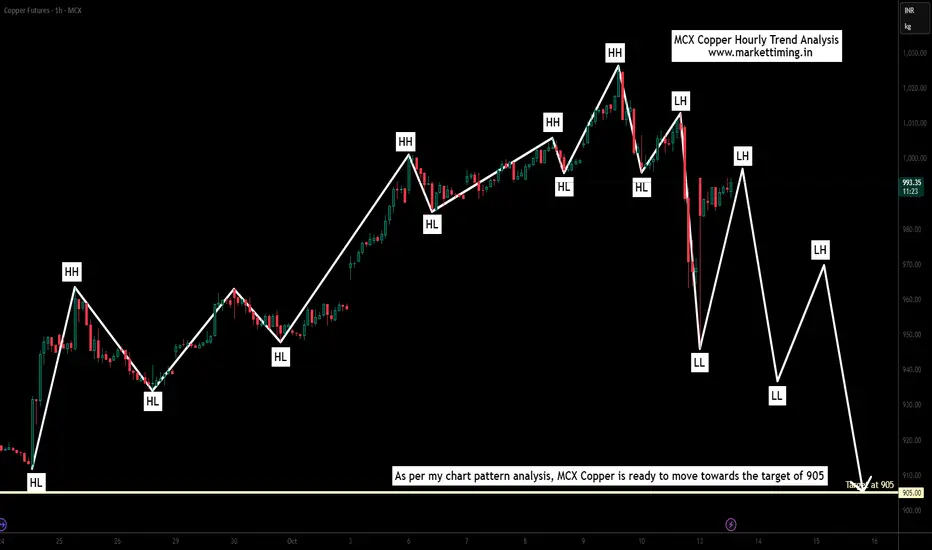
Copper Hourly Trend analysis As per my chart pattern analysis, MCX Copper is ready to move towards the target of 905.
Since this is my personal view, traders are suggested to conduct their own technical analysis for entries and exits.
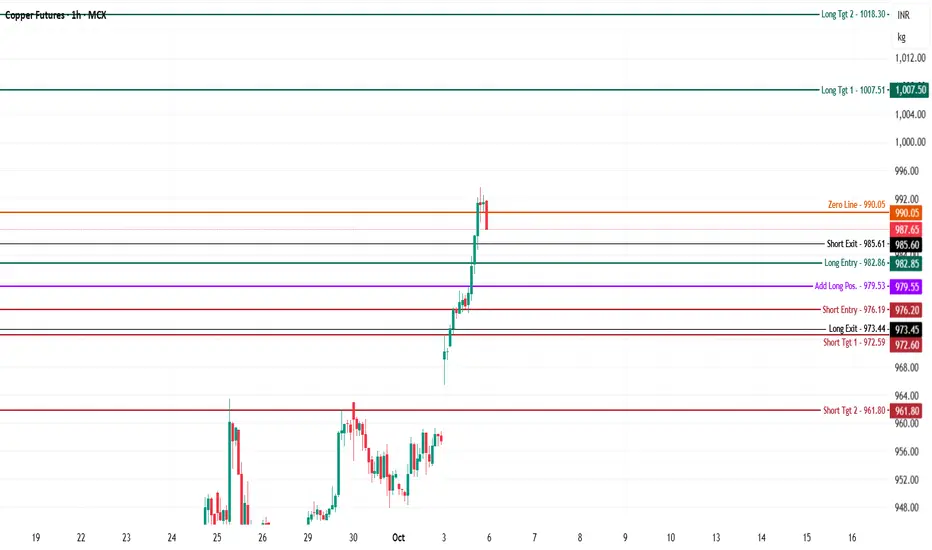
Copper Oct. Futures (MCX) – Intraday Analysis - 6th Oct., 2025MCX:COPPER1!
Copper is consolidating at 987.65, just below the zero line at 990.05 after a steep rally. Price action is testing short-term resistance, poised for either a breakout continuation or a pullback to short-term support.
Bullish (Long) Setup
Long Entry (982.85):
Initiate longs above 982.85, confirming recovery from recent support and continuation of bullish momentum.
Additional long exposure can be considered near 979.55 on dips, where price previously held and formed higher lows.
Upside Targets:
1,007.50 (Target 1): First supply zone; likely profit booking area on continued buying strength.
1,018.30 (Target 2): Extended target marking recent highs and channel resistance.
Stop Loss:
Place stops below 976.20 (short entry level) or 973.44 (long exit) to manage risk on failed reversals.
Bearish (Short) Setup
Short Entry (976.20):
Shorts become actionable below 976.20, signaling a breakdown of support and momentum turning bearish.
Downside Targets:
972.60 (Target 1): Immediate support where short covering may occur.
961.80 (Target 2): Extended support level if selling pressure accelerates.
Stop Loss:
Cover shorts if price sustains above 982.85 to avoid losses on failed breakdowns.
Technical Structure & Logic
The price is consolidating near a key decision zone (zero line), with volume and momentum signals required to confirm the next directional bias.
Persisting above zero line supports bullish continuation.
Failure to hold above support zones signals risk for a deeper pullback.
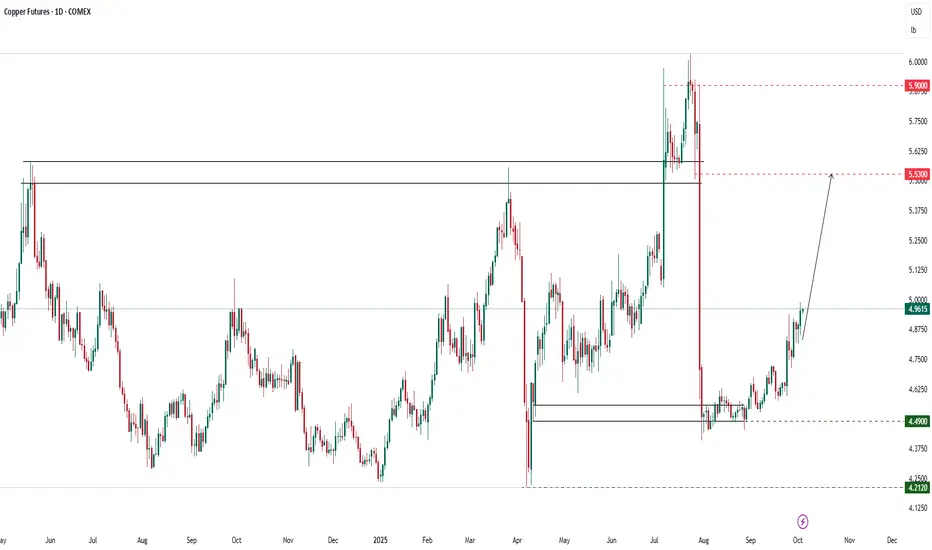
Analysis techniques – Copper Futures (Dec 2025)Analysis techniques – Copper Futures (Dec 2025)
Date: 03/10/2025 | Timeframe: D1 | Contract Code: HGZ25
1. Trend Overview and Price Structure
December copper rose slightly to 4.9610 USD/lb (+0.14%), sustaining its strong rebound from 4.49 support after a prolonged consolidation in August–September. The price has broken above short-term resistance and is approaching the psychological 5.00 mark. Medium-term structure remains bullish, targeting the key resistance zone of 5.53 – 5.90, a previous cycle high.
2. Key Technical Levels
Resistance: 5.53 – 5.90 – 6.00
Support: 4.90 – 4.49 – 4.21
3. Detailed Technical Analysis
Short-term trend: Breakout from the 4.49 – 4.70 base favors further upside toward 5.53.
Volume: Rising on the breakout, signaling fresh inflows.
Wave structure: Copper appears in a medium-term recovery wave (wave 3), with theoretical targets around 5.53 – 5.90 before a pullback.
Confirmation signals: Sustained closes above 5.00 would confirm momentum; failure below 4.90 risks a retracement to 4.70 – 4.49.
4. VNC View
Short term: Positive outlook as metals attract flows amid a softer USD.
Medium term: Refined copper supply disruptions in South America and persistent green demand (EVs, renewables) underpin prices.
Risks: Potential demand weakness from China could trigger volatility.
5. Suggested Technical Strategies
Preferred Long Setup:
Entry: 4.95 – 5.00
TP: 5.53 – 5.90
SL: 4.90
Probability: 65%
Counter-trend Short Setup:
Entry: 5.50 – 5.53
TP: 5.20 – 4.95
SL: 5.90
Probability: 40%
6. Corporate Hedging Guidance
Copper importers (Asia, Vietnam): Lock in purchases near 4.90 – 5.00 to mitigate upside risk.
Producers/sellers: Delay sales until prices approach 5.53 – 5.90 resistance for better margins.
well thought out bear idea got demolished, when in rome...do as the romans do...
great idea demolished..
look to the left I see huge wick down.
when price travels that fast down, it usually goes up slowly, or up just as fast. it's a good guess.
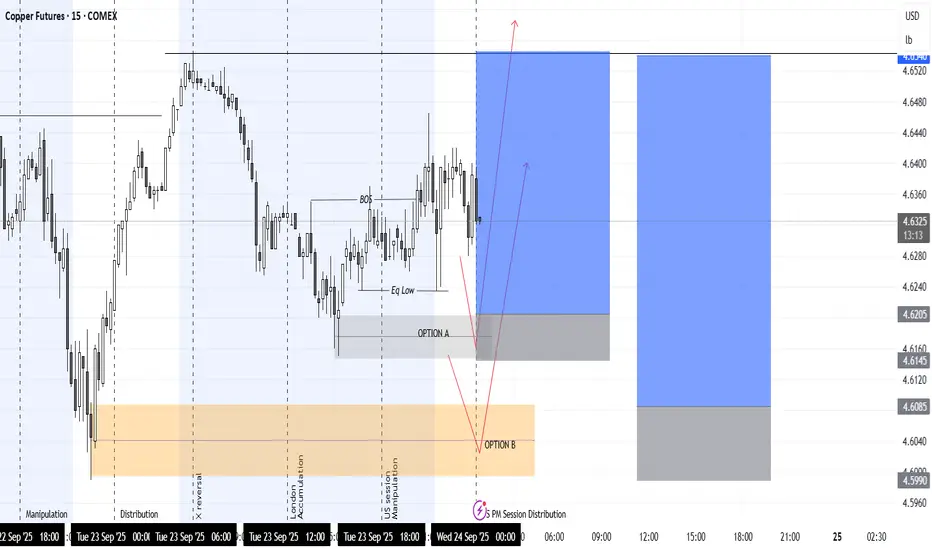
HG Making Distribution Move in NY PM SessionMarket Context
Current price: 4.6320/lb
Recent BOS (break of structure) marked, suggesting prior bearish leg was countered.
Price consolidating around equilibrium after BOS.
Zones
Option A (grey box ~4.620–4.625)
→ A smaller demand/OB zone just below current price.
→ If respected, we could see a quick bullish continuation targeting the upper liquidity pools (blue boxes).
Option B (orange box ~4.600–4.608)
→ Deeper discount OB/demand zone.
→ If price sweeps liquidity through Option A, this zone could be the “true” accumulation point before reversal up.
Directional Bias
Chart marks liquidity run + expansion higher as primary scenario.
Arrows show:
Scenario 1: Price bounces off Option A → quick long.
Scenario 2: Price dips into Option B → deeper liquidity grab before reversal.
Bullish target zones (blue) extend 4.650–4.680.
Session Labels
London accumulation, US session manipulation, PM session distribution → classic ICT intraday model.
Suggests NY PM session might complete distribution cycle before expansion.
Zinc & Copper Correlation is very healthyZinc and copper markets are closely related because both metals are used heavily in construction, manufacturing, and electrical applications, so demand often rises and falls together with industrial activity.
They’re also frequently mined from the same deposits, meaning supply-side disruptions can affect both. As a result, prices for zinc and copper tend to show a high degree of correlation, moving in similar cycles tied to global economic growth and infrastructure.
Comparing the Charts (Zinc on the left on a Monhtly TF), we see that Zinc has a lot of room left to the upside. Because it's goal is to go back to balance, which is the Centerline.
And because of the close correlation, I think the Chart of Copper HG1! is still OK.
So, in Copper, the Centerline target is still in play.

Copper’s Perfect Storm: Supply Strains Meet Fed TailwindsCaught between tightening global supply and shifting macro tailwinds, Copper is entering a pivotal phase.
CHINA’S COPPER OUTPUT CONTRACTION TO FIRE UP PRICES
As reported by Discovery Alert - a specialist mining research service provider - China’s refined copper output is set to fall 4–5% this month, the first seasonal drop since 2016.
The slowdown stems from smelter inefficiencies with scrap operating rates down by 8 percentage points to under 60%, and widespread maintenance amid a severe concentrate shortage. This is creating pressure on margins and forcing some facilities to operate at a loss.
LEANER COPPER INVENTORIES AND TIGHTER SUPPLY
Inventories are diverging across regions. Stocks on major exchanges such as the LME and SHFE have been falling. At the same time, inventory has been accumulating in CME warehouses, creating an uneven distribution. This leaves the global copper market more sensitive to any disruption, as supply tightness in one region can quickly drive up prices and premium volatility elsewhere.
Source: MacroMicro
Demand for copper remains resilient. Long-term drivers are strong with EVs, renewable energy, and power grid upgrades consuming ever more copper.
Put simply, copper faces low supply and steady demand. This combination makes the market tight and vulnerable to sudden price spikes, especially if global factors like a weaker US dollar or fresh Chinese stimulus kick in. With an 8.5 Mt supply deficit projected by 2030, the bias remains skewed to the upside.
TECHNICAL SIGNALS POINT TO BULLISHNESS TOO
CME Copper futures have steadily climbed above their Bollinger Band basis ($4.62/lb) since early September, with prices now testing the upper band, implying strengthening bullish momentum.
RSI has recovered above 50, confirming improving buying strength after a prolonged consolidation. At the same time, the MACD is nearing a bullish crossover with the histogram turning positive, indicating momentum is shifting upward.
Together, these signals highlight a market that has stabilized since August and is now priming towards a potential recovery if upside traction continues.
Copper futures are consolidating within a defined range, holding support at $4.65 and facing resistance at $4.88, reflecting a pause in upward momentum.
VOLATILITY EASES; CVOL & COT SIGNAL COPPER’S BULLISH TURN
Balance between calmer volatility and constructive skew points to a market in transition, as shown below.
Source: CVOL Index
Managed Money increased its long positions by 16% WoW, while its short positions dropped by 4.7% lifting net long positions by 25.6%.
Source: CME QuikStrike CoT
This shift signals stronger bullish sentiment and adds near-term upside pressure to copper prices as funds increase long exposure.
HYPOTHETICAL TRADE SETUP
Investors may consider a bullish copper futures trade setup, which is warranted given current supply-chain tightness, shifting inventory balance, macro tailwinds, and technical momentum confirmation.
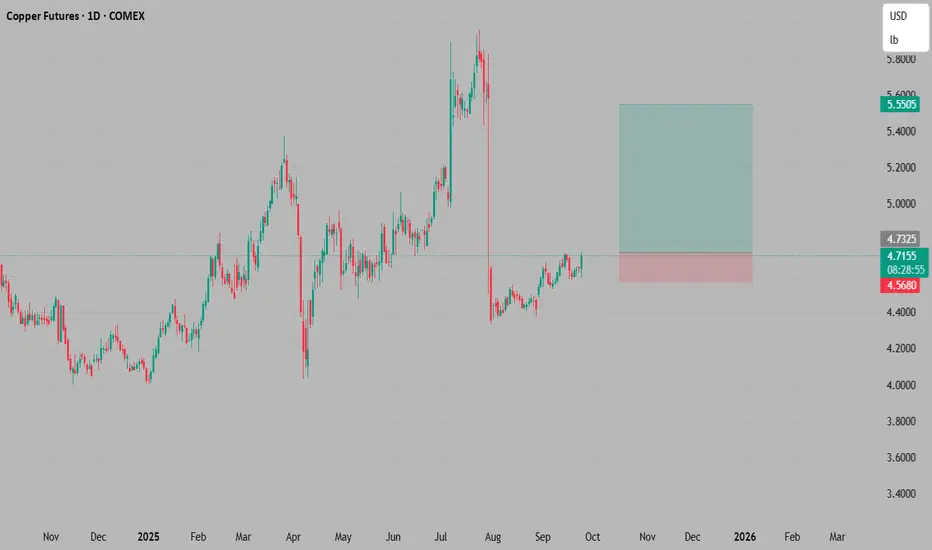
To express a bullish view on copper, investors can deploy a long position in CME Micro Copper Futures (each lot representing 2,500 pounds of copper) expiring in March 2026.
Traders can also express this bullish view through standard CME Copper Futures, with each contract representing 25,000 pounds of copper.
A hypothetical trade setup for this view is described below:
• Current Price ($/lb): 4.71
• Entry ($/lb): 4.70
• Target ($/lb): 5.00
• Stop loss ($/lb): 4.50
• Profit at Target ($/lb): 0.30 (USD 750 per lot of CME Micro Copper Futures)
• Loss at Stop ($/lb): 0.2 (USD 500 per lot of CME Micro Copper Futures)
• Reward to Risk: 1.5x
MARKET DATA
CME Real-time Market Data helps identify trading set-ups and express market views better. If you have futures in your trading portfolio, you can check out on CME Group data plans available that suit your trading needs tradingview.com/cme .
DISCLAIMER
This case study is for educational purposes only and does not constitute investment recommendations or advice. Nor are they used to promote any specific products, or services.
Trading or investment ideas cited here are for illustration only, as an integral part of a case study to demonstrate the fundamental concepts in risk management or trading under the market scenarios being discussed. Please read the FULL DISCLAIMER the link to which is provided in our profile description.

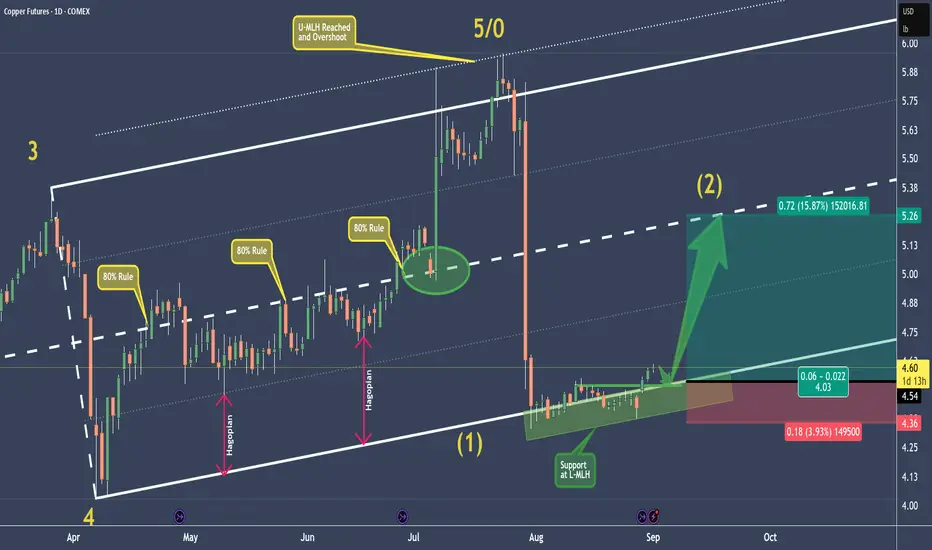
HG - Copper Setting Up For A Long Opprtunity At Extreme📊 Fundamentals first:
- Short-term: The copper market is turbulent—marked by sharp price spikes, crashes, and global shifts in stock levels.
- Medium-term: Despite forecasted surpluses from ICSG, technology innovations and steady demand (especially from China and green sectors) may underpin prices.
- U.S. risk factor: The tariffs remain a major wildcard, likely restructuring trade flows, increasing domestic input costs, and distorting global price differentials.
📈 Now the Chart:
P5/0 at the U-MLH marked the end, and price dropped into the void.
Now, at the L-MLH we see support has built up.
The momentum we see now will probably lead in a pullback before the potential massive run-up to the Centerline.
💡 If the trading God gives me a pullback, I am willingly risk my 0.5% in this trade to make at least 4x more. 🦊
Happy new week to all §8-)
COPPER Multi-year Support held. Strong Buy Signal.Last time we had a look on Copper (HG1!) was almost 2 months ago (July 17, see chart below) and it delivered an instant return on our sell as it got rejected at the top of the Rising Wedge, quickly hitting our 4.700 Target:
The price just broke above its 1W MA50 (blue trend-line) again this week after completing 5 weeks below it. With the 1W MA200 (orange trend-line) intact as Support, the multi-year Rising Wedge should now technically initiate its new Bullish Leg.
Check also the 1W RSI, which just hit and rebounded on its 2-year Support Zone.
We expect a new Higher High on the Rising Wedge, targeting $6.000.
-------------------------------------------------------------------------------
** Please LIKE 👍, FOLLOW ✅, SHARE 🙌 and COMMENT ✍ if you enjoy this idea! Also share your ideas and charts in the comments section below! This is best way to keep it relevant, support us, keep the content here free and allow the idea to reach as many people as possible. **
-------------------------------------------------------------------------------
💸💸💸💸💸💸
👇 👇 👇 👇 👇 👇

return to solid buyers with confluences spells out continuation 1->3 : higher high which makes
number 2 a solid major low ,
as number 2 buyers surpassed
number 1 sellers making the number
3 pivot
3->4 : return to major buyers
what do I think will happen next ?
* hidden bullish divergence ( continuation )
* LRC 2nd standard deviation
* vwap reaction after 1st deviation, similar
to the reaction of the previous upswing
in similar standard deviation from vwap
* buy trade seems justified

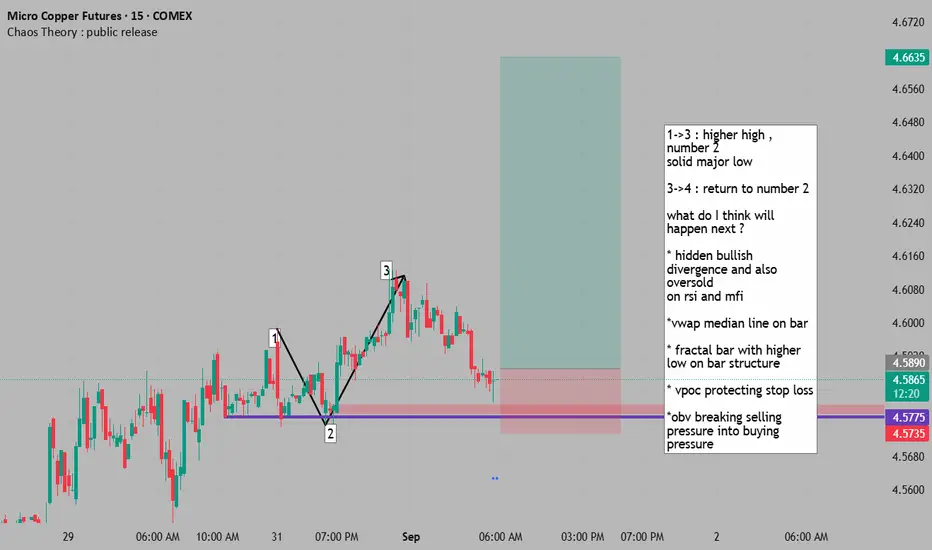
return to solid buyers presents =BUY +mfi+rsi+obv+vwap+volume1->3 : higher high , number 2
solid major low
3->4 : return to number 2
what do I think will happen next ?
* hidden bullish divergence and also oversold
on rsi and mfi
*vwap median line on bar
* fractal bar with higher low on bar structure
* vpoc protecting stop loss
*obv breaking selling pressure into buying pressure
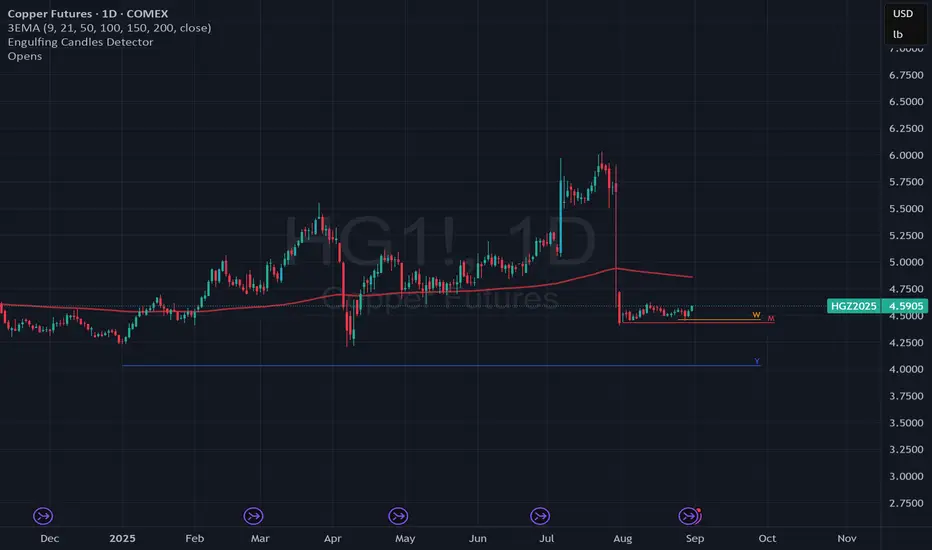
Is the price of copper cheap or is something else occuring?Is the price of copper cheap or is the price of copper indicating coming weakness in the economic cycle?

super volitile selloff brings us back to major =BUYers1->5 : solid uptrend ,
number 3 surpasses number 1 making number 2
a solid major low ,
number 5 surpasses number 3 , making number 4
a solid major low
5->6: a reutrn to the highly volitile solid major low
number 4
what do I think will happen ?
* this is just a theory, my opinion on what could
occur in a similar case.
* as number 5 sellers contend with buyers from number
4, we can see that we have a bullish divergence on 3 indicators, the RSI , MFI and accumumation/distribution. we also have oversold indications on the rsi and mfi which is helpful
* looking at dow theory, we are in an uptrend, and in fact have returned to major buyers, though the way we returned was 8 months of buying soldoff in a single day... regardless, we returned to major buyers, and are seeing micro bullish sort of uptrend forming even on the day, if we talk about cheap, it does not get much better than this.

Serve yourself a coffee and have a look at Dr. Copper!Serve yourself a coffee and have a look at Dr. Copper’s chart this morning.
It’s hinting at something bigger…

a return to proven sellers presents a =SELL opportunity1->4 : represents a buildup of orders, a consolidation and determination
of where market players think the value of this asset belongs.
4->5: sellers decide the market is overpriced and begin to sell off
the copper futures, this flux of orders fills the market and due to supply
and demand the price drops
* this could have been forseeable as number 3 was a bit below number 1,
showing the sellers from 2 were stronger than the buyers from 1 , but
it was not super obvious
what do I think will happen ?
* a return to the proven sellers presents an opporuntity to join on trend
with a tight stop at a logical location, the genesis the the most recent leg down
which took out an entire set of buyers and re-established the trend to be
solid
* we have hidden divergence on RSI , MFI and accumulation/distribution indicators, which is a good sign, an ontrend divergence is always preferred.

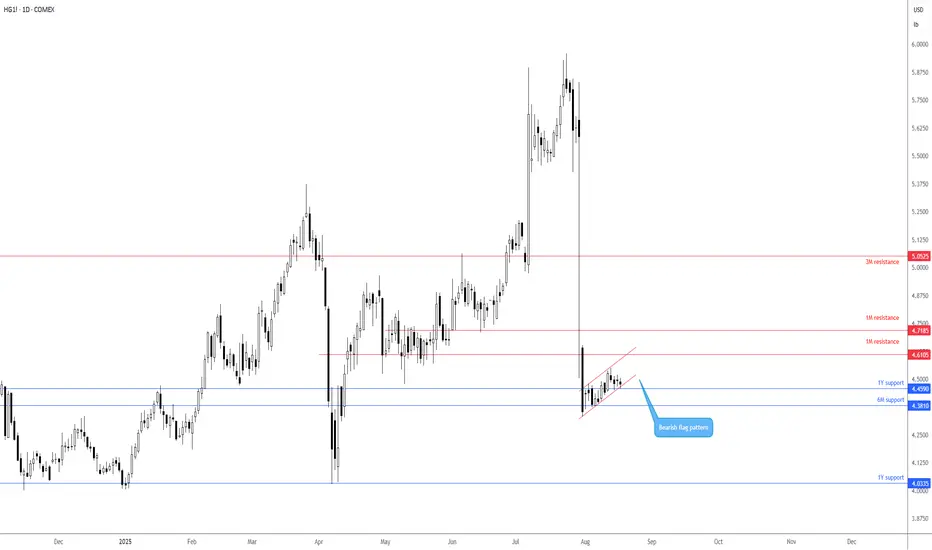
Potential bearish flag pattern on Copper futuresPrice action on Copper Futures shows that buyers and sellers have been confined between two ascending lines since the beginning of August, taken from the low of US$4.3325 and a high of US$4.4800. While this offers a potential bearish flag pattern to work with, the base metal is seen rebounding from support between US$4.3810 (6M) and US$4.4590 (1Y), with room for price to continue pushing higher until reaching resistance between US$4.7185 and US$4.6105 (1M levels).
As a result, price could continue to grind higher within the confines of the bearish flag until reaching resistance at US$4.7185-US$4.6105 before sellers attempt to push things lower.
Written by the FP Markets Research Team
AI, Copper, and the Energy SupercycleThe rise of Artificial Intelligence is more than just a tech story, it’s also a massive commodities story.
AI adoption requires massive infrastructure buildouts... high-performance data centers, advanced semiconductors, and power-intensive cloud networks. Each of these components relies heavily on copper for wiring, cooling systems, and energy transmission.
At the same time, AI-driven demand accelerates the broader electrification trend... more servers, more grid upgrades, more renewable energy projects, all of which are copper-intensive.
Historically, copper has been a reliable barometer for economic expansion, often called “Dr. Copper” for its ability to forecast global growth. But in this cycle, demand is not just cyclical it’s structural.
With supply growth constrained by limited new mining projects and rising costs of extraction, the long-term balance is setting up for potential substantial price appreciation.
The same story applies to energy :
AI and cloud computing are electricity-hungry, and global utilities are already projecting significant demand spikes. This suggests that both copper and energy markets could be among the biggest beneficiaries of the AI-driven decade ahead.
For traders and investors, the takeaway is pretty clear...while the headlines are dominated by AI’s impact on technology stocks, the real long-term winners may lie in copper and energy markets which are the raw inputs powering the digital revolution.
COMEX:HG1!
