Gold continuation underway?On a 4 hour time frame, looking like we potentially completed a reacc model.
Price potentially continuing to retest and blow through highs.
Will be looking for entries on day trades in the green highlighted area if we start to squeeze.
Ultimate target will be the 1.61 fib of the range. (I use fibs as targets when we are running blue skies.
I will want to see us riding the 10EMA on the hour, entries will be made on the 1 min on flag breakouts while above and riding the 10EMA on the 1 min.
Trade ideas

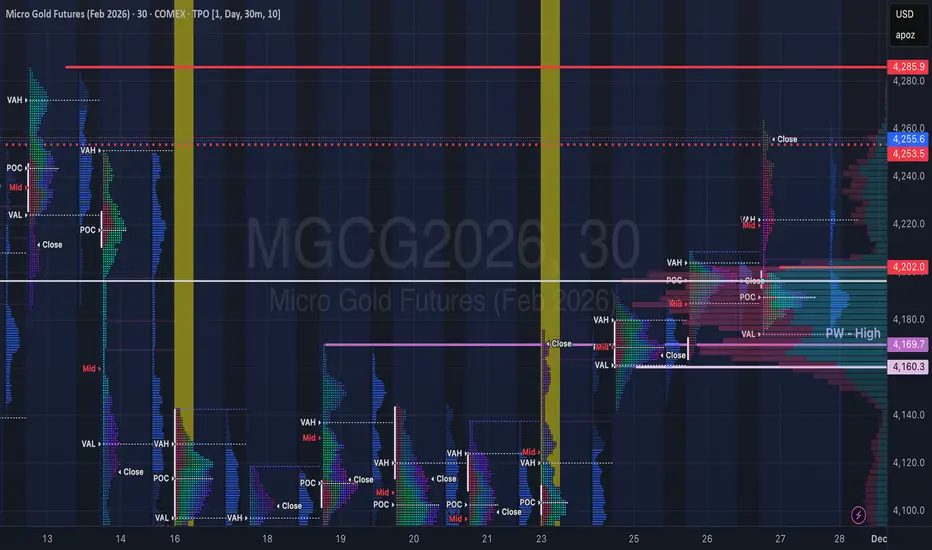
Gold Context: December Open & Holiday Inventory CheckCOMEX_MINI:MGCG2026 COMEX:GC1!
Traders. Here is the context update as we transition into the new month.
Market Context (Holiday Drift): The auction drifted higher on thin volume during the Thanksgiving and Black Friday shortened sessions. This extension was largely driven by a lack of sellers rather than aggressive buying, leaving us with a "thin" structure.
Structure & Inventory: We have significant inventory resting back at 4200 – 4170, sitting just above the Previous Week High (PWH).
Current Action: Price is holding the holiday extension.
The Problem: The move up lacks heavy volume support. We have "unfinished business" below at the breakout zone.
Plan & Execution: Monday marks the start of fresh December flows. I am not interested in chasing this extension at these highs.
Stance: Flat / Patient.
The Test: I want to see Gold rotate back to test the inventory at 4200 – 4170 first.
Decision: We need to verify if buyers will defend this zone (turning old resistance into support) before committing to a new directional bias.
Talk to you for the next update.
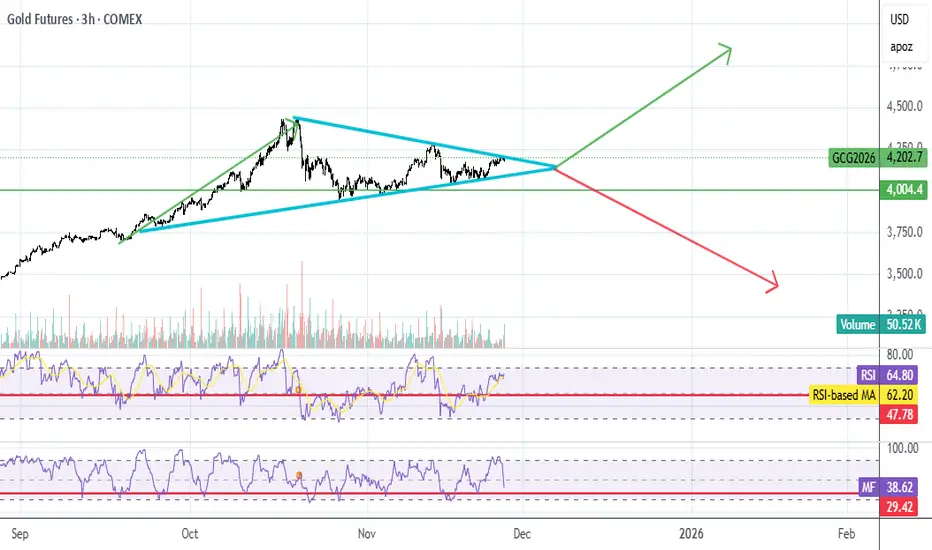
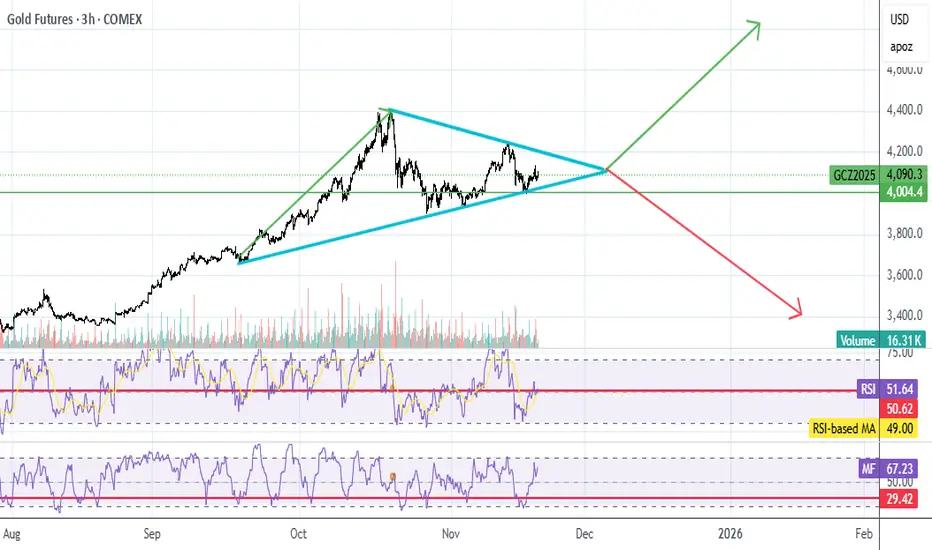
GC UpdateMFI hasn't quite hit oversold, but it looks like it's melting up out of the pennant. Went long on Dec 26 GLD calls, going for a longer term strategy this time, so I'm not just cycling when MFI goes oversold on the 3 hr.
With longer term calls, it's not a big deal if it does dip.
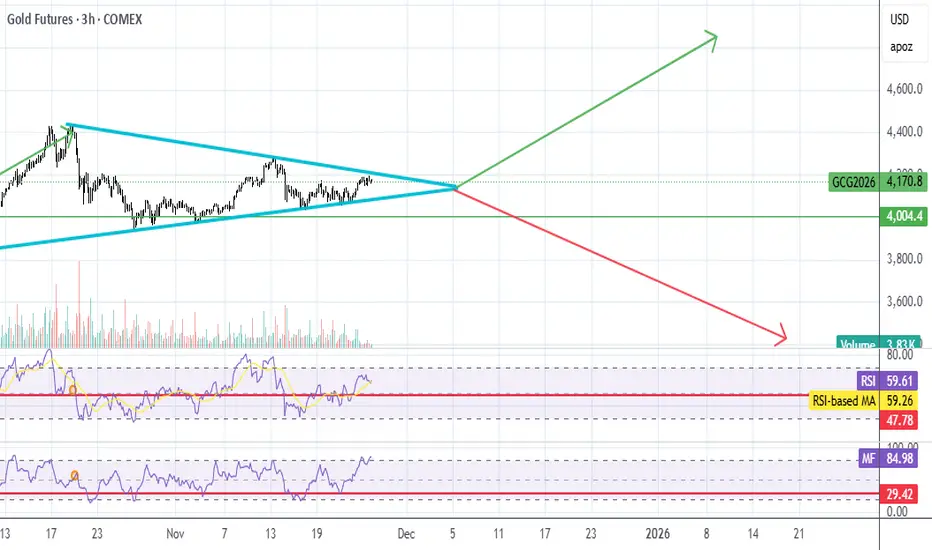
GC UpdateI probably should have gone long when it hit the bottom of the pennant. Waiting for it to come back down.
Triple Top - Double Bottom. Go Next Golden Shift4125 for a potential reload (supply area). 4275 - to make it all back.

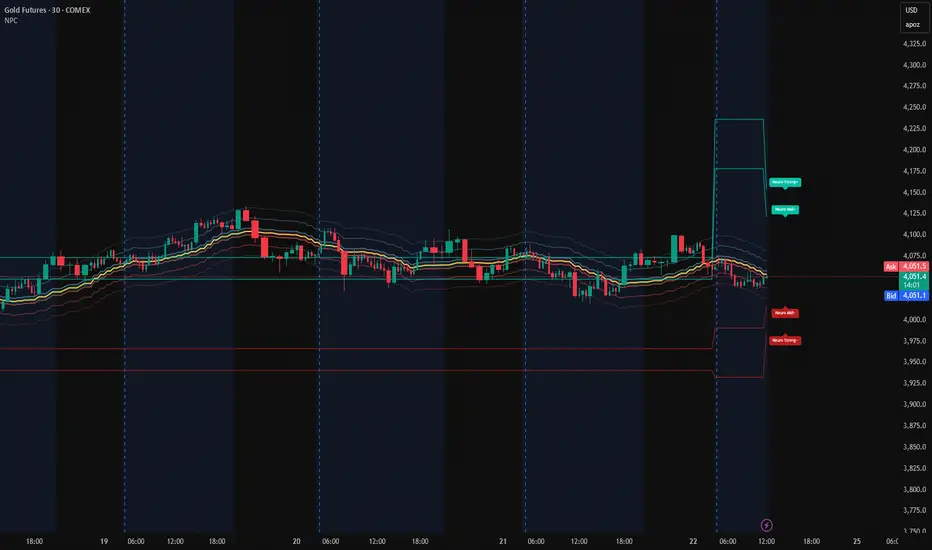
Gold (30m) – NPC Volatility Zones After Range CompressionGold Futures (COMEX), 30m using NeuroPolynomial Channel (NPC)
After the recent range compression, Gold is sitting inside a nonlinear stabilization pocket rather than a momentum phase.
Current Statistical Position:
• Price hovering near NPC Core Cluster
• Distance from lower stress band: ~1.2%
• Distance from upper expansion band: ~2.0%
• Compression vs prior leg: ~0.58
NPC Volatility Map:
• Upper Expansion Zone: +1.8% → +2.3%
• Core Equilibrium: Current range
• Lower Rejection Band: −1.2%
• Breakdown Re-Entry Zone: −2.6%
Scenarios (not predictions):
Holding above core → rotation towards upper band
Losing core → retest lower volatility zone
This is a structure + probability map, not a trade signal.
GOLD (XAU-GC) BUY PLAN📊 Market Sentiment
Market sentiment for GOLD remains strongly bullish. One of the key drivers is the aggressive accumulation by global central banks. Recession concerns and persistent inflation fears continue to position gold as one of the most attractive safe-haven assets.
📈 Technical Analysis
Price has completed the expected accumulation phase and broke out strongly from the accumulation range. This former range has now turned into a clear demand zone. Price has pulled back into this zone again and is currently testing the $4060 level.
📌 Game Plan
The $4060–$3900 zone is my primary buy zone. I will continue accumulating within this range.
My first target is $4250, followed by $4400, which aligns with new all-time-high expectations.
If price closes below $3900 on the daily, this idea becomes invalid. Therefore, my stop is a daily close under $3900.
💬 If this breakdown aligns with your outlook, like and comment below.
For deeper sentiment and strategy insights, subscribe to my Substack free access available.
⚠️ This analysis is for educational purposes only and does not constitute financial advice. Always conduct your own research before trading or investing.

1H Rally-Base-Rally Long Setup | Weekly & Daily AlignedMarket structure remains bullish across the higher timeframes with the Weekly, Daily, and 1H all trending upward. I’m focusing on the most recently created valid 1H Rally-Base-Rally demand zone for a potential long entry.
This zone is high quality because it:
✅ Removed opposing supply zones
✅ Broke a valid trendline on departure
✅ Shows strong impulsive buying pressure
✅ Is the most recent institutional demand on the 1H
Plan is to wait for price to return into this zone for continuation with the higher-timeframe trend. As always, patience and risk management first no chasing price.

MGC LongsPrice is forming a rounded double-bottom structure right on the rising trendline (blue), suggesting buyers are quietly stepping back in after multiple rejections from the lower demand zone (4,050–4,060).
We’re currently pushing into a key mid-range resistance at 4,085–4,095. This level has acted as a heavy decision zone for several sessions, so I’m watching for one of two things:
Primary Bias (Bullish)
A controlled pullback into the 4,060–4,065 demand zone
Buyers hold structure above the trendline and EMAs
Break and hold above 4,090
Then continuation toward 4,110 → 4,130 liquidity pockets
The white projection illustrates the ideal retest-and-continue scenario.
Key Notes
EMAs are beginning to curl up and tighten — early sign of momentum shift
Liquidity sits above 4,105–4,115 from prior wicks
Clean invalidation below the trendline / demand at 4,050
Overall, this is a reversal-structure forming at higher-timeframe support, with a potential push into the next major supply zone if intraday demand continues to hold.

Gold Bearish OutlookExpecting CSE:GC TVC:XAU to be bearish for the rest of the month
- Seasonals lean bearish till EOM
- Commercials are highly short while Small traders are highly long
- OI relatively high
- CLEAR Market structure break
- CLEAR IRL to ERL target

Thursday1. How do I read the open and close price of each candle after it prints?
2. Can I get out of a trade before it stops out? Like right before it stops out.
3. Was there any way to have made this trade a winner?

The Calm Before the Expansion — Gold Pre-Setup MapGold rejecting the Asian Range low and showing early signs of reversal. Missed the London setup after oversleeping, but tonight I’m watching for a retrace back into the H1 FVG + lower HVN. That pocket sits just under 50% of yesterday’s Asian range and lines up with weekly volume sitting just outside of value. If price pulls back into that zone and shows displacement, I’m looking for continuation to the upside and potential expansion toward the H4 FVG above. Premature breakouts tonight may be traps.

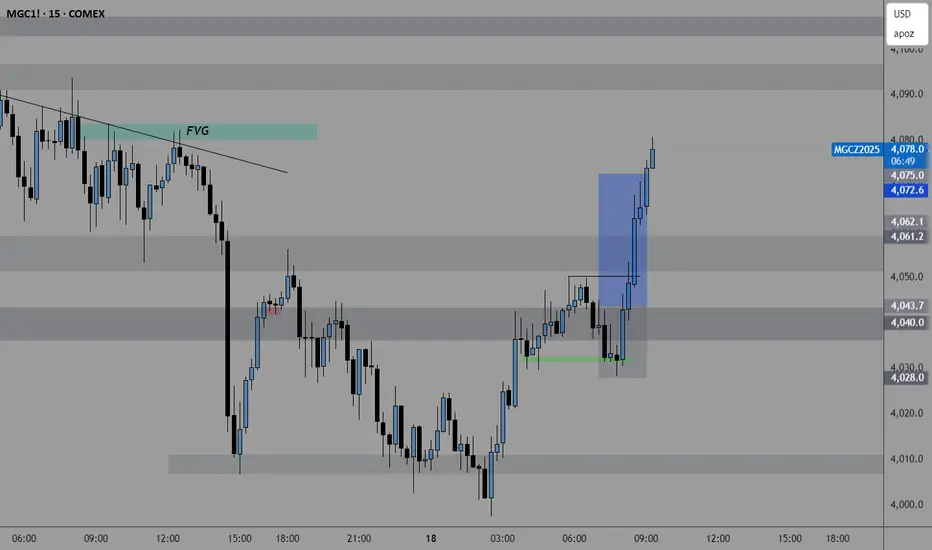
Gold Mega MCX Futures — Inverse Head & Shoulders - Pattern TradeMCX:GOLD1!
By Chart Pathik | 20 November 2025
Gold Mega MCX Futures — Inverse Head & Shoulders Breakout Suggests Positional Bullish Reversal
Market Overview
Gold Mega MCX Futures
have constructed a textbook Inverse Head & Shoulders pattern on the 15-minute chart, indicating a notable bullish reversal opportunity after an extended downtrend. This structural pattern reflects gradual absorption of supply, leading to a strong recovery scenario for positional traders.
After testing the lows near 121,800 (forming the head), gold has rebounded to repeatedly test resistance at the neckline around 124,455. The right shoulder completed with a swift reversal, and prices are now pressing against breakout territory. Sustained closes above the 124,455 neckline confirm classic breakout conditions for a multi-session rally.
Technical Structure and Pattern Logic
The Inverse Head & Shoulders structure, observed here, is a high-probability bullish reversal setup favored by institutional participants at the end of persistent downtrends.
The "head" forms at the extreme swing low (121,800), with each "shoulder" forming on higher lows, reflecting indifference turning into accumulation and finally conviction.
The pattern's neckline resistance is sharply defined at 124,455, which, when broken decisively, unlocks the full post-breakout measured move potential. Early aggressive entries are possible on high-volatility tests of the right shoulder at 123,255, setting up for add-on positions if a neckline breakout occurs.
Breakout Validation and Volume Confirmation
Key volume expansion on rallies above the neckline is crucial for confirming the breakout. A surge in open interest or strong momentum during/after a breakout candle provides additional confirmation and increases the probability of a sustained move.
Pattern Target Projection
Pattern Target: 128,100
This target is projected by measuring the distance from the neckline (124,455) to the head (121,800), then adding it above the neckline breakout.
Key Levels to Watch
Early Entry: 123,255 (for aggressive traders on pullbacks toward the right shoulder)
Break-Out Entry: 124,455 (confirmation on a convincing breakout and close)
Stoploss (Positional): 121,800 (well below head formation, protecting capital and structure)
Pattern Target: 128,100 (full measured move from bottom to neckline)
Scenario Analysis
If gold closes above 124,455:
Momentum is likely to accelerate toward 128,100, with the trend reinforced by any volume spike and reduced selling pressure at higher prices.
If gold fails at the neckline and closes back below 123,255:
A failed breakout or pattern trap could lead to a retest of 121,800 or even a deeper corrective phase if macro sentiment or global cues turn adverse.
Broader Market Context
This reversal setup comes as broader market volatility in precious metals fades and macro conditions appear stabilizing. Physical demand, safe-haven flows, and a potential resurgence in global risk aversion could further support the bullish thesis.
Historical Significance
The Inverse Head & Shoulders pattern is respected by traders for timing momentum shifts at major turning points. A similar structure triggered a sharp rally in gold Mega MCX Futures during Q4 2020, and the post-breakout rally then lasted for several weeks.
Market Psychology and Trader Positioning
This pattern shows a market transitioning from capitulation and fear (the head), through reluctant bullishness (shoulders), to widespread conviction (neckline breakout).
Large players will often accumulate around the shoulder and neckline and then aggressively push prices through resistance once weak hands exit.
Outlook
In the coming sessions, a sustained breakout above 124,455, validated by strong candle closes and higher volume, should favor multi-session long positions targeting 128,100. Pullbacks into the 123,255–124,455 area are accumulation zones for swing or positional traders.
Chart Pathik View
This pattern marks a structural turning point after a corrective phase. Patience on retests, strict risk management with stoploss at 121,800, and riding the full pattern target are the ideal tactics.
As gold transitions from a downtrend into a potential expansion phase, structure, discipline, and measured scaling are essential to positional success.
Last time this Inverse Head & Shoulders pattern on MCX Gold Futures produced a similar outcome was in June 2020, leading to a 10% rally in the following weeks.

Gold Holds $4000Gold has retraced lower from last week’s high, though it is holding above 4000 for now. Two bullish pinbars have also formed on the daily chart, hinting at a potential swing low. A break above yesterday’s high could see bulls target the 4200 handle, with a move through the 4250 high bringing the 4300 handle and monthly S1 into view.
However, keep in mind the weekly chart may be forming a Wave B within a broader ABC correction. I’ll also be watching for signs of a swing high on the daily chart and a potential resumption of the move lower from the record high. A 100% projection of Wave A from B implies a downside target near 3800.
Matt Simpson, Market Analyst at City Index.

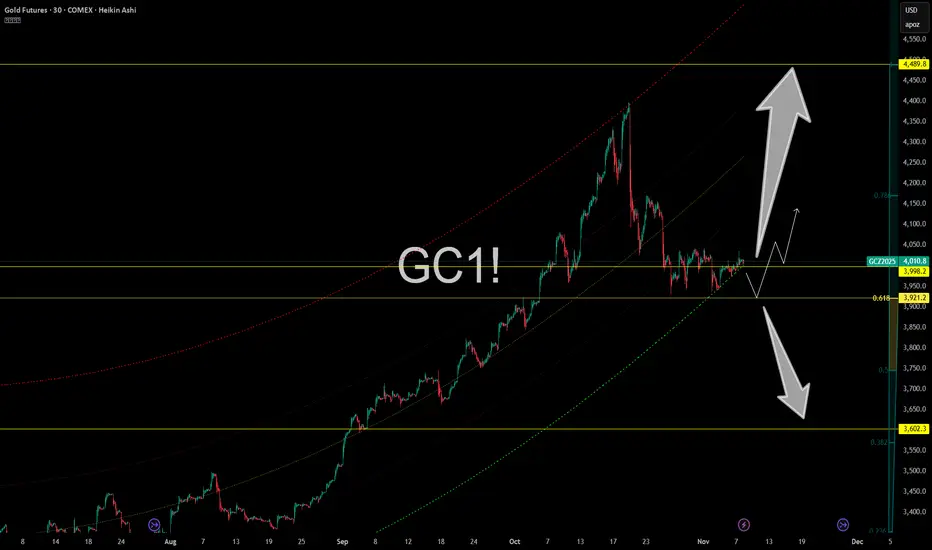
Gold Futures – Compression Before Explosion?Gold (GC1!) is coiling tightly just above the $3,998 level, teasing a big move as it hugs the 0.618 fib zone at $3,921. It’s the definition of compression — and when gold coils like this, something always gives.
📍 Key levels on the radar:
$3,998 – Current pressure zone
$3,921 – Fib support + breakout base
$3,602 – Worst-case flush if demand fails
$4,489 – Fibonacci extension target if this rips
We’ve got an ascending pitchfork, clean market structure, and a massive range breakout setup. These kinds of patterns don’t sit idle for long.
Gold remains a beast in uncertain macro conditions — don’t underestimate what happens when fear, rates, and inflation mix.
Trading Wisdom 📜
The bigger the coil, the nastier the move. Don’t focus on direction — focus on readiness. Gold pays those who stay patient and deadly.
Disclaimer: What you read here is not financial advice — it’s high-level market philosophy from the FXPROFESSOR himself. Risk is real, and your capital is your responsibility. Learn, adapt, evolve.
One Love,
The FXPROFESSOR 💙
GC UpdateLooks to me like gold is forming a big pennant, more than likely a continuation pennant.
Certainly not acting like it;s topped out.
Gold Takes out Swing High??If we can break the previous resistance, Thad be in indication buyers are in control. A simple pullback off a 15m would be an ideal entry

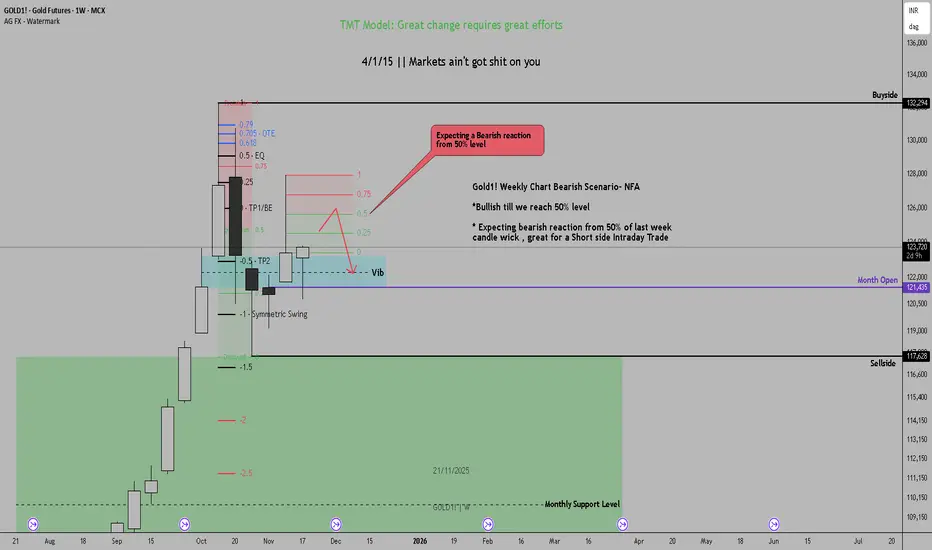
Gold1! Weekly Chart Bearish Scenario- NFAGold1! Weekly Chart Bearish Scenario- NFA
*Bullish till we reach 50% level
* Expecting bearish reaction from 50% of last week candle wick , great for a Short side Intraday Trade
Gold hold this trendline and we see a move upwards.If gold can hold this trendline at $4000 we could see a move up, wait for the daily open.

GoldBoth symbols look bullish to me, even though the overall price has been moving down — they’re targeting mitigated areas that usually don’t hold for long.

Looking for the Sweep leading into a bigger Play! Price bled lower through the entire Asian session after yesterday’s late breakdown, continuing the move away from the prior value area. We’re now trading inside a cluster of intraday inefficiencies with clean liquidity sitting below at 4013 and the psychological 4000 level.
My focus going into London and NY is patience.
Asia’s slow descent is typically a continuation phase, not the actual entry. I want to see:
A sweep of 4013 or 4000
A clear displacement reaction
A retrace back into a fresh M5–M15 FVG
Then structure confirming continuation or reversal
Until that happens, this remains a bearish environment with untested Weekly imbalance still below. If buyers don’t defend 4013 with force, the algo will likely reach for the 4000 liquidity pocket next.
Staying reactive, not predictive.
London will reveal whether this breakdown continues or sets the trap for a reversal.

GOLD: The Daily and Weekly +FVGs Hold The Key! In this Weekly Market Forecast, we will analyze the Gold (XAUUSD) for the week of Nov. 17-21st.
Gold is still strong, but struggled to move higher last week. It is currently inside a bullish FVG, and this would be the key PD Array to watch. If the market shows respect to the +FVG, then expect higher prices. If it fails, and we see the market close below it on a daily close basis, buys should be avoided until the Weekly +FVG is reached.
Enjoy!
May profits be upon you.
Leave any questions or comments in the comment section.
I appreciate any feedback from my viewers!
Like and/or subscribe if you want more accurate analysis.
Thank you so much!
Disclaimer:
I do not provide personal investment advice and I am not a qualified licensed investment advisor.
All information found here, including any ideas, opinions, views, predictions, forecasts, commentaries, suggestions, expressed or implied herein, are for informational, entertainment or educational purposes only and should not be construed as personal investment advice. While the information provided is believed to be accurate, it may include errors or inaccuracies.
I will not and cannot be held liable for any actions you take as a result of anything you read here.
Conduct your own due diligence, or consult a licensed financial advisor or broker before making any and all investment decisions. Any investments, trades, speculations, or decisions made on the basis of any information found on this channel, expressed or implied herein, are committed at your own risk, financial or otherwise.
