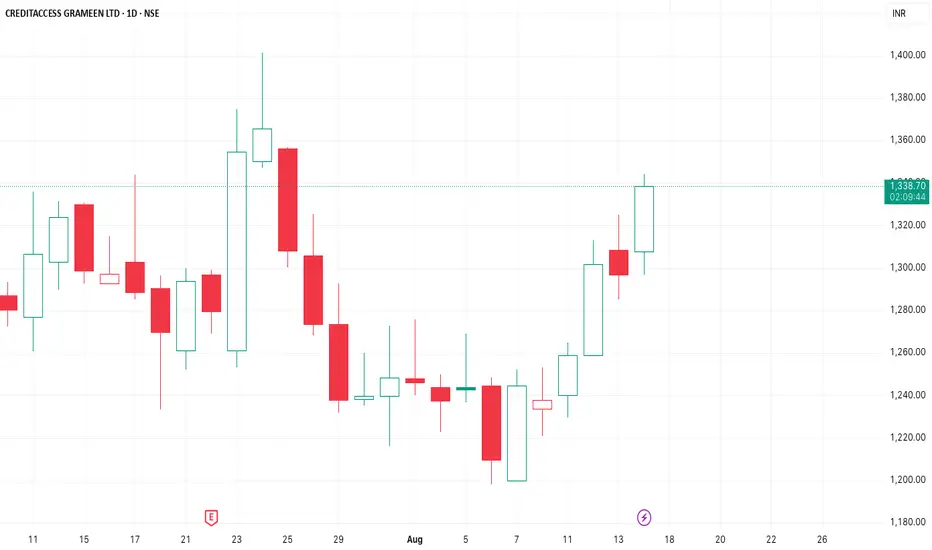
Strong Momentum With balanced ReturnsIt shows a more Robust BTST setup which cleaner breakout, confirmations across technical indicators CREDIT ACCESS GRAMEEN is a promising candidate
Next report date
—
Report period
—
EPS estimate
—
Revenue estimate
—
12.15 INR
5.31 B INR
57.27 B INR
53.58 M
About CreditAccess Grameen Ltd.
Sector
Industry
CEO
Ganesh Narayanan
Website
Headquarters
Bangalore
Founded
1999
ISIN
INE741K01010
FIGI
BBG00L2NWM97
CreditAccess Grameen Ltd. engages in the provision of micro finance services. It offers life insurance, emergency loans, family welfare loans, home improvement loans, retail finance, Jagruti program, and workshops. The company was founded by Vinatha Madhusudhan Reddy in May 1999 and is headquartered in Bangalore, India.
Related stocks
CREDITACCESS GRAMEEN LTD – Weekly Chart Analysis📊 Summary:
CreditAccess Grameen has shown a strong recovery from the ₹800 zone and is forming a rounding bottom pattern, suggesting the potential start of a long-term uptrend. The long-term channel from 2020 remains valid, and price is gradually making its way toward the upper range.
🔍 Technical Br

CreditAccess Grameen (CREDITACC) – Bullish Breakout SetupStock Name: CreditAccess Grameen (CREDITACC)
Trend : Bullish
Timeframe : Daily
Trade Setup
Entry Point: ₹1,163
Stop Loss: ₹1,089 (Risk: ~6.4% from entry)
Targets:
Target 1: ₹1,205.70
Target 2: ₹1,248.75
Target 3: ₹1,294.15
Target 4: ₹1,337.15
Final Target: ₹1,385
Technical Rationale f

Creditacc , 1WVery Good Pattern is Breakout , looking very Good
Risk for 5% , if you want to play very safe then decrease your position size and increase your risk to 10% (according to your own capacity Risk )
Follow for More Swing Ideas Like this

Diamond Bottom Pattern in CreditAccess GrameenThis pattern is not a common but has a good strike rate if correctly identified. The breakout level is close 1020 and projected target is above 1500.


good volume at support zonestock has seen good volume in support zone can bounce back rsi also in oversold zone

CREDITACCESS GRAMEEN LTD S/RSupport and Resistance Levels:
Support Levels: These are price points (green line/shade) where a downward trend may be halted due to a concentration of buying interest. Imagine them as a safety net where buyers step in, preventing further decline.
Resistance Levels: Conversely, resistance levels (re

$NSE:CREDITACCNSE:CREDITACC
Good company
At support level
Details of stock will upload on y.tube
Target and support will discuss there.

CreditAccess Grameen: Making a Difference in Microfinance◉ Abstarct
The Indian microfinance sector has grown significantly, reaching a total loan amount of about ₹4.33 lakh crore (around $52 billion) by March 2024, which is a 24.5% increase from the previous year. CreditAccess Grameen Limited plays a vital role by providing loans mainly to low-income wom

See all ideas
Summarizing what the indicators are suggesting.
Neutral
SellBuy
Strong sellStrong buy
Strong sellSellNeutralBuyStrong buy
Neutral
SellBuy
Strong sellStrong buy
Strong sellSellNeutralBuyStrong buy
Neutral
SellBuy
Strong sellStrong buy
Strong sellSellNeutralBuyStrong buy
An aggregate view of professional's ratings.
Neutral
SellBuy
Strong sellStrong buy
Strong sellSellNeutralBuyStrong buy
Neutral
SellBuy
Strong sellStrong buy
Strong sellSellNeutralBuyStrong buy
Neutral
SellBuy
Strong sellStrong buy
Strong sellSellNeutralBuyStrong buy
Displays a symbol's price movements over previous years to identify recurring trends.
960CAGL25
CreditAccess Grameen Limited 9.6% 23-NOV-2025Yield to maturity
27.02%
Maturity date
Nov 23, 2025
925CAGL26
CreditAccess Grameen Limited 9.25% 07-JUN-2026Yield to maturity
11.53%
Maturity date
Jun 7, 2026
940CAGL27
CreditAccess Grameen Limited 9.4% 07-NOV-2027Yield to maturity
11.36%
Maturity date
Nov 7, 2027
10CAGL27
CreditAccess Grameen Limited 10.0% 23-NOV-2027Yield to maturity
9.42%
Maturity date
Nov 23, 2027
970CAGL28
CreditAccess Grameen Limited 9.7% 07-SEP-2028Yield to maturity
9.30%
Maturity date
Sep 7, 2028
CAGL27
CreditAccess Grameen Limited 0.0% 07-NOV-2027Yield to maturity
−2.94%
Maturity date
Nov 7, 2027
CAGL26
CreditAccess Grameen Limited 0.0% 07-JUN-2026Yield to maturity
−20.67%
Maturity date
Jun 7, 2026
CAGL25A
CreditAccess Grameen Limited 0.0% 23-NOV-2025Yield to maturity
−81.36%
Maturity date
Nov 23, 2025
CAGL28.NE
CreditAccess Grameen Limited 0.0% 07-SEP-2028Yield to maturity
—
Maturity date
Sep 7, 2028
CAGL27A.N6
CreditAccess Grameen Limited 0.0% 23-NOV-2027Yield to maturity
—
Maturity date
Nov 23, 2027
See all CREDITACC bonds
SMALLCAP
Mirae Asset Nifty Smallcap 250 Momentum Quality 100 ETF Units Exchange Traded FundWeight
0.98%
Market value
747.33 K
USD
MIDSMALL
Mirae Asset Nifty MidSmallcap400 Momentum Quality 100 ETFWeight
0.39%
Market value
158.33 K
USD
Explore more ETFs
Frequently Asked Questions
The current price of CREDITACC is 1,410.90 INR — it has increased by 0.72% in the past 24 hours. Watch CreditAccess Grameen Ltd. stock price performance more closely on the chart.
Depending on the exchange, the stock ticker may vary. For instance, on NSE exchange CreditAccess Grameen Ltd. stocks are traded under the ticker CREDITACC.
CREDITACC stock has fallen by −0.60% compared to the previous week, the month change is a 1.65% rise, over the last year CreditAccess Grameen Ltd. has showed a 19.26% increase.
We've gathered analysts' opinions on CreditAccess Grameen Ltd. future price: according to them, CREDITACC price has a max estimate of 1,530.00 INR and a min estimate of 1,150.00 INR. Watch CREDITACC chart and read a more detailed CreditAccess Grameen Ltd. stock forecast: see what analysts think of CreditAccess Grameen Ltd. and suggest that you do with its stocks.
CREDITACC reached its all-time high on Dec 14, 2023 with the price of 1,796.00 INR, and its all-time low was 242.05 INR and was reached on Oct 26, 2018. View more price dynamics on CREDITACC chart.
See other stocks reaching their highest and lowest prices.
See other stocks reaching their highest and lowest prices.
CREDITACC stock is 2.73% volatile and has beta coefficient of 1.55. Track CreditAccess Grameen Ltd. stock price on the chart and check out the list of the most volatile stocks — is CreditAccess Grameen Ltd. there?
Today CreditAccess Grameen Ltd. has the market capitalization of 225.56 B, it has decreased by −2.67% over the last week.
Yes, you can track CreditAccess Grameen Ltd. financials in yearly and quarterly reports right on TradingView.
CreditAccess Grameen Ltd. is going to release the next earnings report on Nov 6, 2025. Keep track of upcoming events with our Earnings Calendar.
CREDITACC earnings for the last quarter are 3.80 INR per share, whereas the estimation was 6.40 INR resulting in a −40.63% surprise. The estimated earnings for the next quarter are 10.05 INR per share. See more details about CreditAccess Grameen Ltd. earnings.
CreditAccess Grameen Ltd. revenue for the last quarter amounts to 9.81 B INR, despite the estimated figure of 9.50 B INR. In the next quarter, revenue is expected to reach 9.96 B INR.
CREDITACC net income for the last quarter is 601.90 M INR, while the quarter before that showed 472.10 M INR of net income which accounts for 27.49% change. Track more CreditAccess Grameen Ltd. financial stats to get the full picture.
Yes, CREDITACC dividends are paid annually. The last dividend per share was 10.00 INR. As of today, Dividend Yield (TTM)% is 0.71%. Tracking CreditAccess Grameen Ltd. dividends might help you take more informed decisions.
CreditAccess Grameen Ltd. dividend yield was 0.00% in 2024, and payout ratio reached 0.00%. The year before the numbers were 0.69% and 11.00% correspondingly. See high-dividend stocks and find more opportunities for your portfolio.
As of Oct 5, 2025, the company has 20.97 K employees. See our rating of the largest employees — is CreditAccess Grameen Ltd. on this list?
EBITDA measures a company's operating performance, its growth signifies an improvement in the efficiency of a company. CreditAccess Grameen Ltd. EBITDA is 26.37 B INR, and current EBITDA margin is 81.71%. See more stats in CreditAccess Grameen Ltd. financial statements.
Like other stocks, CREDITACC shares are traded on stock exchanges, e.g. Nasdaq, Nyse, Euronext, and the easiest way to buy them is through an online stock broker. To do this, you need to open an account and follow a broker's procedures, then start trading. You can trade CreditAccess Grameen Ltd. stock right from TradingView charts — choose your broker and connect to your account.
Investing in stocks requires a comprehensive research: you should carefully study all the available data, e.g. company's financials, related news, and its technical analysis. So CreditAccess Grameen Ltd. technincal analysis shows the strong buy rating today, and its 1 week rating is buy. Since market conditions are prone to changes, it's worth looking a bit further into the future — according to the 1 month rating CreditAccess Grameen Ltd. stock shows the buy signal. See more of CreditAccess Grameen Ltd. technicals for a more comprehensive analysis.
If you're still not sure, try looking for inspiration in our curated watchlists.
If you're still not sure, try looking for inspiration in our curated watchlists.