TradeCity Pro | CRV Testing Key Support Zone for Trend Reversal👋 Welcome to TradeCity Pro!
In this analysis, I will be reviewing the CRV coin, one of the popular DEXs, with a market cap of $954 million, currently ranked 81 on CoinMarketCap.
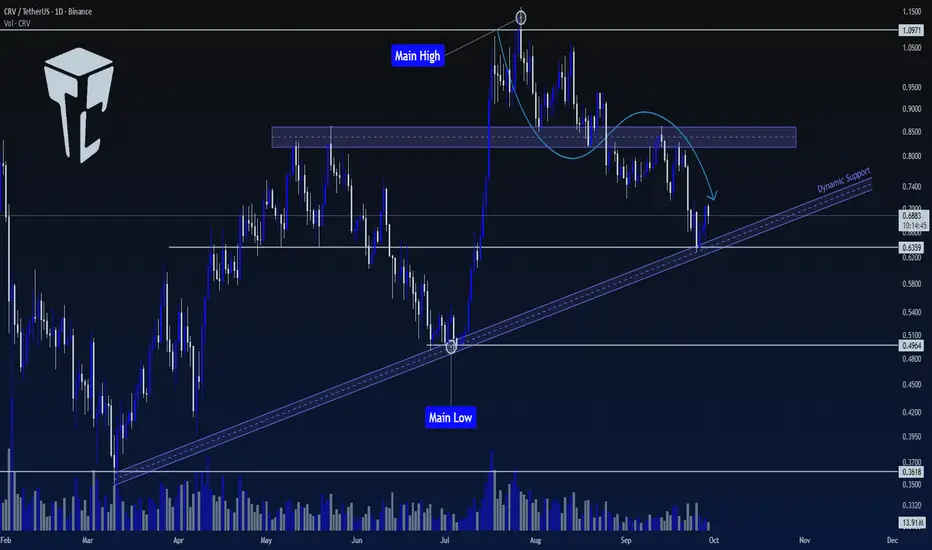
📅 Daily Timeframe
In the daily timeframe, this coin is in an uptrend with a trendline, and the price has currently reache
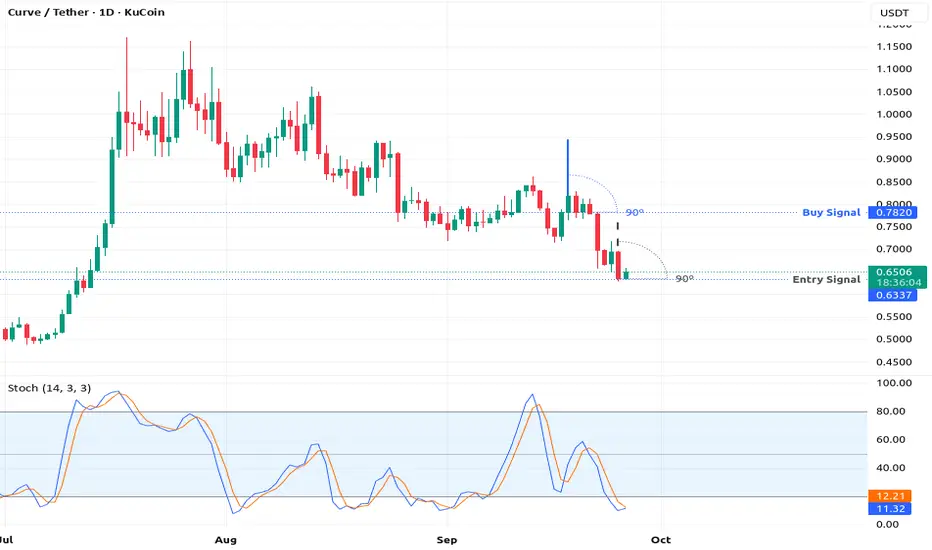
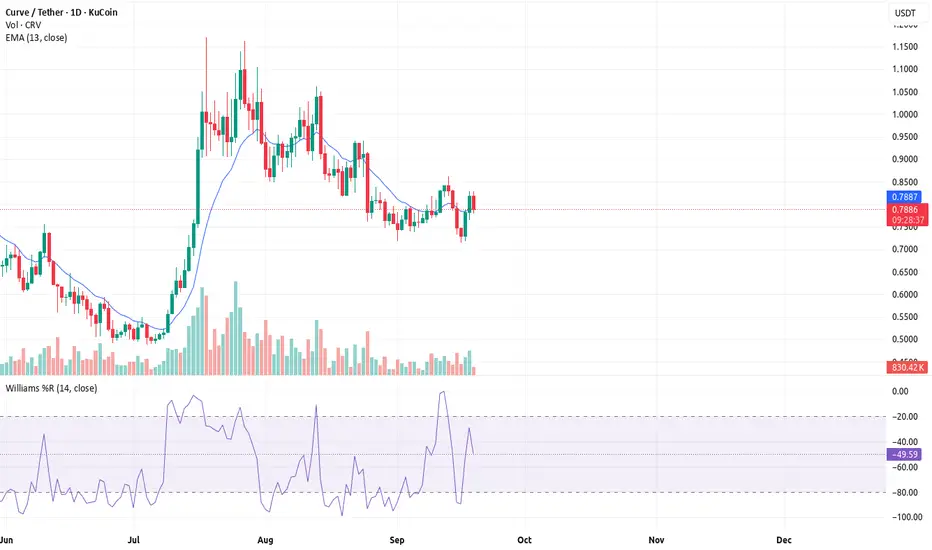
CRV/USDT: Range Breakdown Targets 0.57CRV/USDT: Range Breakdown Targets 0.57
Price broke out of type of range between 0.707 (resistance) and 0.674 (support).
Now, it is testing the lower side of the range, showing weakness. CRV can take a small pause in this area to reflect a bit more before it takes a clear downward movement..
If

The #1 Bearish Chart PatternThere is something so powerful;
about technical analysis
that's very hard to put together
but once you do piece them together
you will begin to see the power of it
Tracking the price for
these alt coins
has been the best hing
i have ever witnessed.
Seeing the pennant bearish
price pattern


My Opinion on CRV cryptocurrenciesWith Fibonacci Extension, I found potential that the price have high possibility to go higher to price 1usdt. But this is just my opinion, this is not financial advice, PLEASE DO YOUR OWN RESEARCH
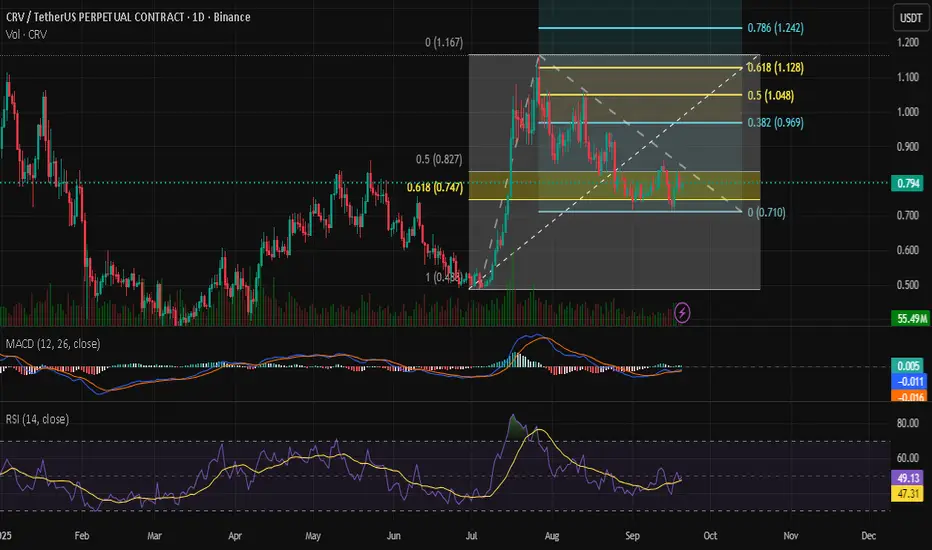
Is it a time for CRVUSDT. 30% potential target 1 $
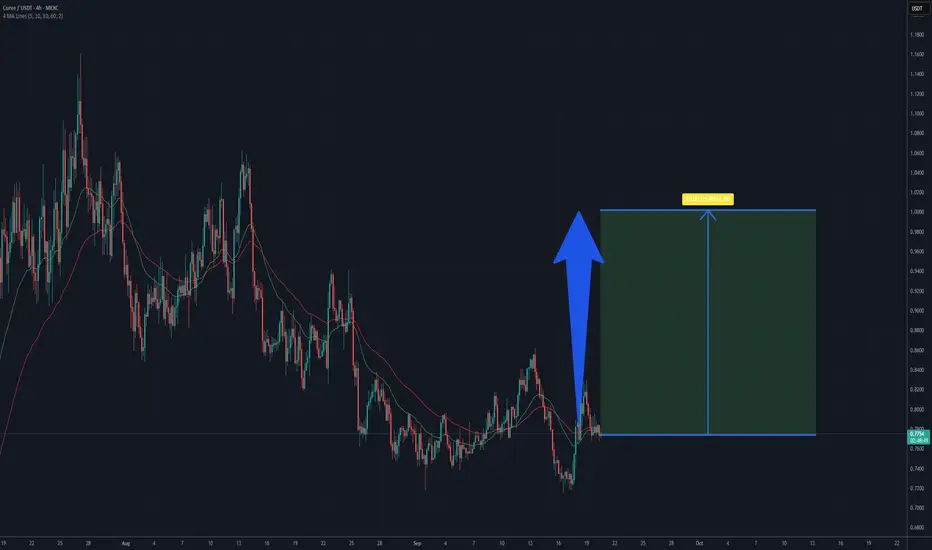
On the 4-hour Curve/USDT chart the market shows a period of sideways consolidation after a recent rebound from the 0.72 USD area. Price is hovering around 0.77 USD, moving in a relatively tight range and testing both short-term moving averages.
The shorter moving average has started to flatten and
The 13 EMA System On Re- Entry (Swing Trading)So am sitting on my computer desk.
Trying to register my publishing business..
then it hit me man.
Its more affordable to start a business
than to get a driving license.
So which one would you do?
Would you start a business or get a driving
license?
Starting a business is something
i wish i did
CRVUSDT 1D#CRV is moving inside a falling wedge pattern on the daily chart. Currently, it has bounced nicely from the daily EMA200 and is on the verge of breaking out above the wedge resistance and the daily SMA50. Keep an eye on it. If it happens, the potential targets are:
🎯 $0.8762
🎯 $0.9744
🎯 $1.0538
🎯 $


See all ideas
Summarizing what the indicators are suggesting.
Oscillators
Neutral
SellBuy
Strong sellStrong buy
Strong sellSellNeutralBuyStrong buy
Oscillators
Neutral
SellBuy
Strong sellStrong buy
Strong sellSellNeutralBuyStrong buy
Summary
Neutral
SellBuy
Strong sellStrong buy
Strong sellSellNeutralBuyStrong buy
Summary
Neutral
SellBuy
Strong sellStrong buy
Strong sellSellNeutralBuyStrong buy
Summary
Neutral
SellBuy
Strong sellStrong buy
Strong sellSellNeutralBuyStrong buy
Moving Averages
Neutral
SellBuy
Strong sellStrong buy
Strong sellSellNeutralBuyStrong buy
Moving Averages
Neutral
SellBuy
Strong sellStrong buy
Strong sellSellNeutralBuyStrong buy
Displays a symbol's price movements over previous years to identify recurring trends.