US30 (DOW30) At a Critical Juncture Amid Distribution Signs
The US30 consolidates near its all-time high of 45,223.8, showing early signs of exhaustion. Our multi-faceted analysis suggests a pivotal moment is at hand, with a bearish bias for the short term. The key level to watch is the recent high at 45,250, which is acting as a formidable resistance.
Intraday Trading Strategy (5M - 4H Charts)
Bearish Scenario: A rejection from the 45,150 - 45,250 resistance zone, confirmed by a bearish candlestick pattern (like a bearish engulfing) on the 1H chart, signals a short opportunity. Initial target is the 44,900 support (recent swing low), followed by 44,750. Use a tight stop above 45,300. The 1H RSI showing divergence and price action below the VWAP support this move.
Bullish Scenario: A decisive 4H close above 45,250 invalidates the immediate bearish outlook and could trigger a momentum buy. The target would then be an uncharted rally towards 45,500. However, low volume on any breakout would signal a potential bull trap.
Swing Trading Outlook (4H - Daily Charts)
The larger picture reveals a market potentially in a Wyckoff distribution phase. The failure to sustain new highs, coupled with rising volume on downswings, points to smart money distributing shares. An Elliott Wave count suggests we may be in a final Wave 5 extension or have completed it, priming for a larger corrective (ABC) pullback.
Swing Sell: A daily close below the key support at 44,500 would confirm a shift in medium-term momentum, opening targets down to 43,800 (50-day EMA and a significant psychological level).
Swing Buy: A sustained hold above 45,250, supported by strong volume and a bullish RSI crossover on the daily chart, would delay the bearish count and target new highs.
Key Technical Rationale:
RSI Divergence: The daily RSI is forming a bearish divergence against the higher price highs, indicating weakening momentum.
VWAP & Volume: Anchored VWAP from the last significant low shows price is extended. Recent up-moves appear on weaker volume, characteristic of a weak bullish trend.
Gann & Ichimoku: Price is trading at the upper range of a Gann square, suggesting a potential reversal zone. The Ichimoku Cloud on the 4H is thin, offering little dynamic support below 44,800.
Market Context: Geopolitical tensions and political uncertainty are injectting volatility, making risk assets like the DJI susceptible to sharp pullbacks. Traders should remain agile.
Disclaimer: This is technical analysis, not financial advice. Always use stop-losses and manage your risk accordingly.
Trade ideas

Us30 analysis I believe the market is symmetrical; this symmetry occurs at all levels and is fractal in nature.
Given that the bullish cycle has not yet completed and we are in the third leg of the ascent, the best area for buying, with a margin of 300-400 points, is right at this point.
This is a long-term bullish swing.

US30 SENDS CLEAR BULLISH SIGNALS|LONG
US30 SIGNAL
Trade Direction: long
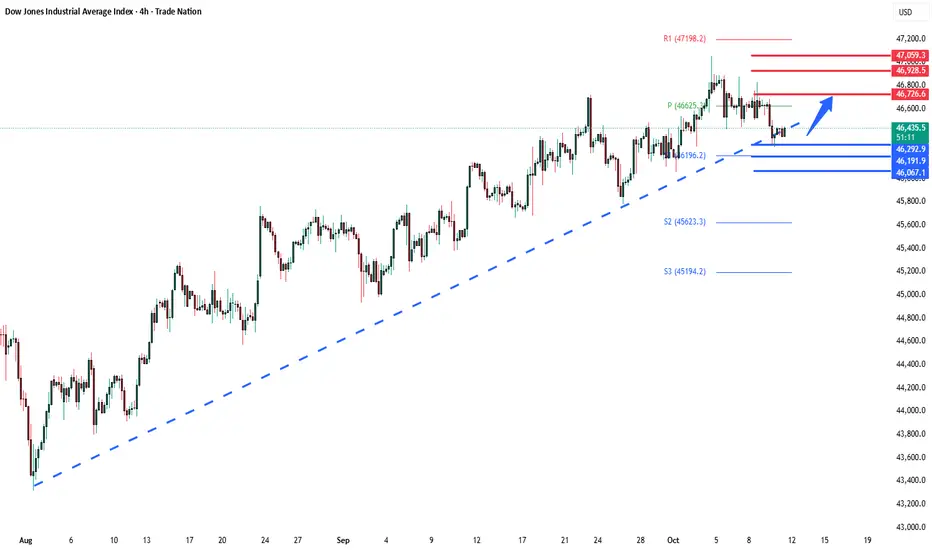
Entry Level: 45,553.8
Target Level: 46,661.5
Stop Loss: 44,818.8
RISK PROFILE
Risk level: medium
Suggested risk: 1%
Timeframe: 1D
Disclosure: I am part of Trade Nation's Influencer program and receive a monthly fee for using their TradingView charts in my analysis.
✅LIKE AND COMMENT MY IDEAS✅

DJI : The ENDAll good things must come to an END.
Enjoy it while you can.
The same goes for Bitcoin.
In the end, all that matters is CASH in the pocket.
Good luck.

DJI : Remember what I wrote on 26/11/2024Long ago, I put up this chart.
Thanks to Trump, it is finally a reality.
Price has nowhere else to go but DOWN.
This is the kind of MONEY you can make by being patient.
Good luck.
SELLER'S WIN-MARKET TOOK A DEEP DIVE-US30Today was total domination by the Seller's. FVG's on higher timeframes were in totally in sync. 4hr,1hr,30min,15min,3min,1min.

Dow Jones - US30 My Love — US30 💕
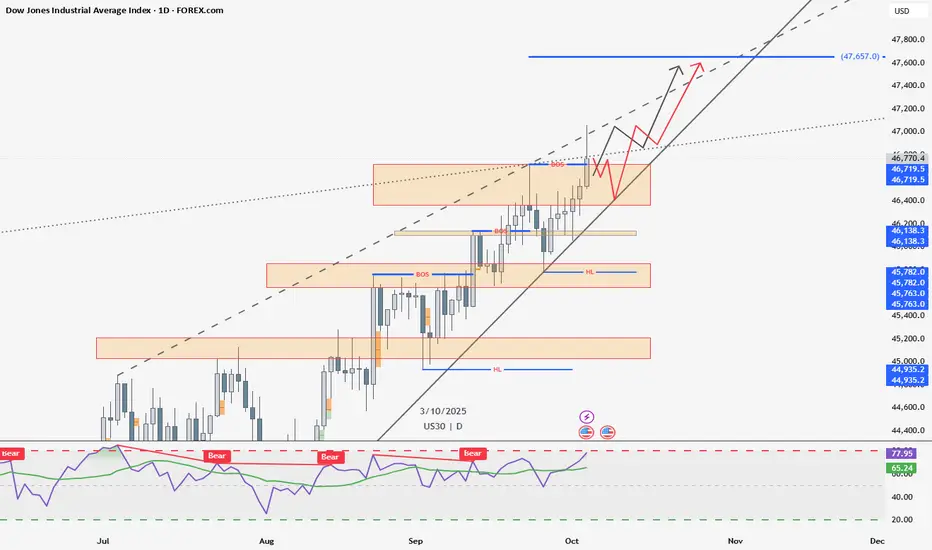
On the daily timeframe , the last daily candle closed slightly above the previous Higher High (46719.5) , creating a Break of Structure (BOS) — but it’s still below the trendline resistance (dotted line).
For next week, price could go either way :
Bullish scenario: Break the trendline resistance and continue higher, forming a new Higher High (HH) — possible target around 47,657.
Bearish retrace: Pull back to retest the lower trendline support before attempting another push to create a new HH.
Always fun watching how US30 reacts to trendlines 😄📈
FOREXCOM:US30
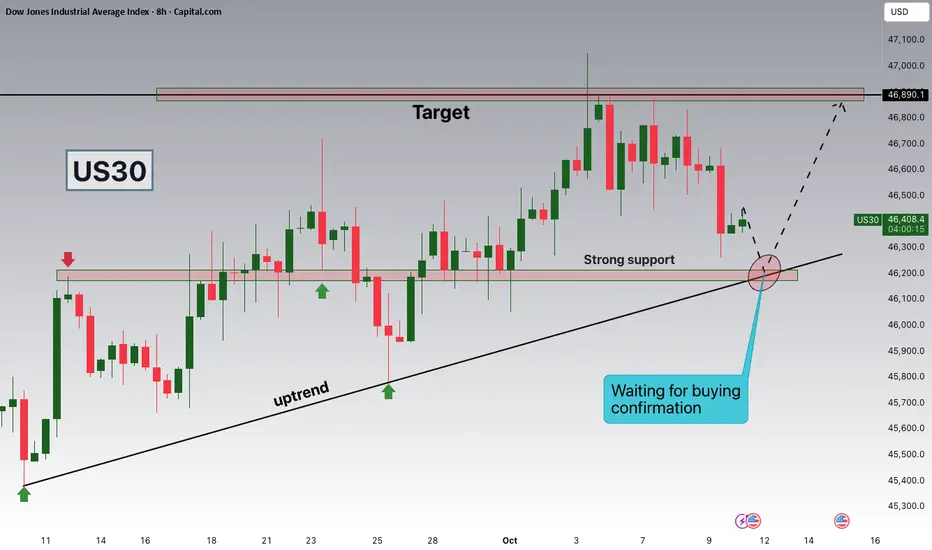
US30 - Potential LongHi Traders,
US30 has been in an UPTREND for a long time and looking for buy trades is only logical.
What now?
Wait for a retracement or a pull back
Look for lower time frame buy.
Good Luck
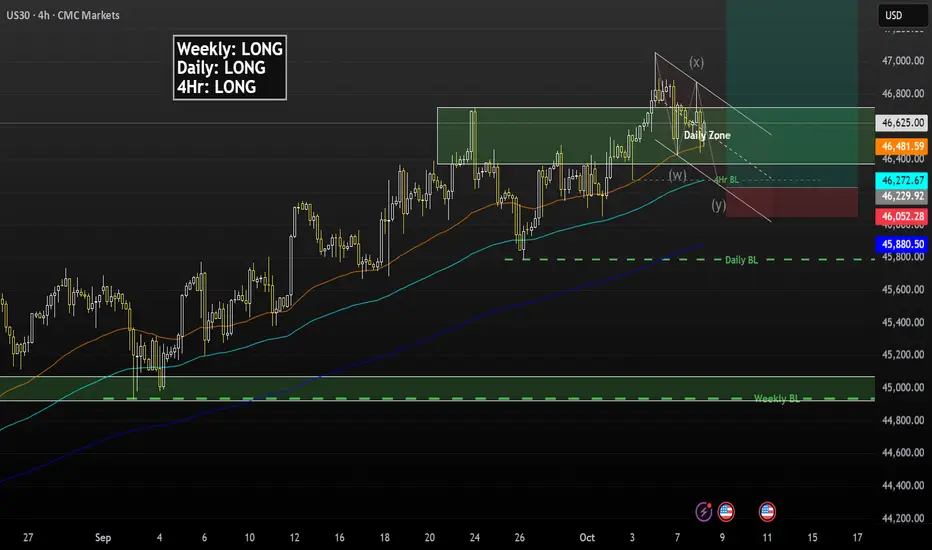
US30US30 – H4 Chart Analysis
Price action currently forming Higher Highs and Higher Lows, confirming a bullish structure.
After the recent Higher High, price retraced back to the zone where it had previously formed a Higher Low.
📍 From this Higher Low to Higher High, a Fibonacci Retracement was applied.
✅ Entry taken from the 0.5 Fibonacci level, aligning with a potential bullish continuation.
🛑 Stop Loss (SL) placed just below the previous Higher Low for structure-based invalidation.
🎯 Risk to Reward: 1:1
Structure: Bullish
Strategy: Pullback Entry in Uptrend
Timeframe: H4
Tool: Fibonacci Retracement

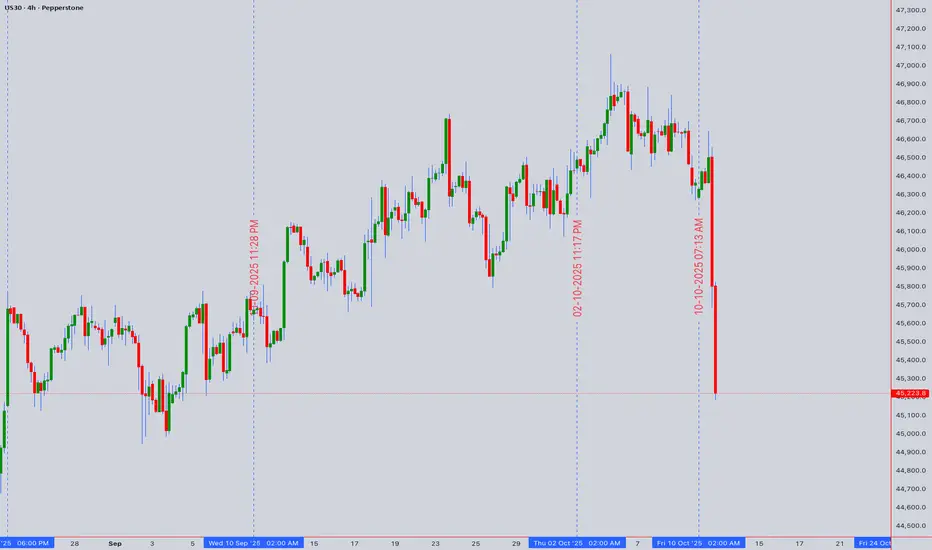
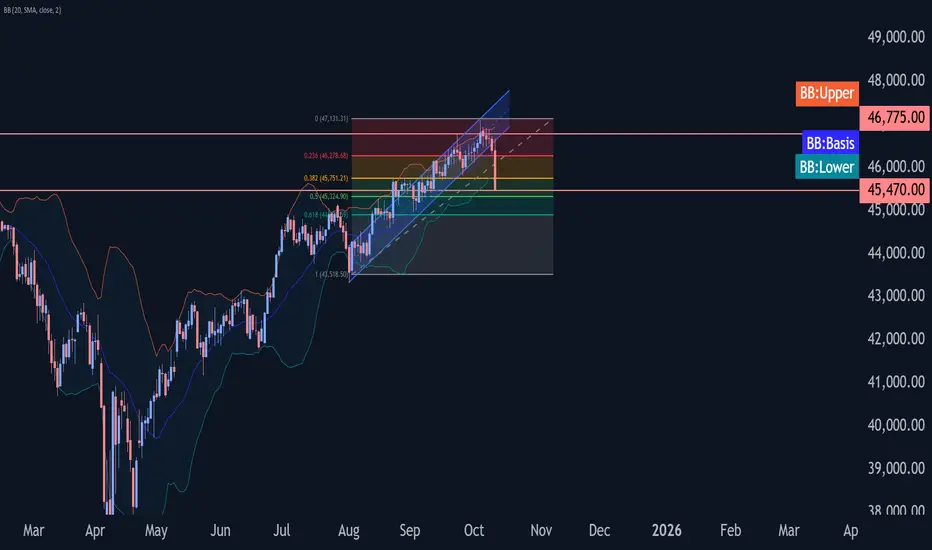
Dow Jones index Wave Analysis – 10 October 2025- Dow Jones index broke daily up channel from
- Likely to fall to support level 45470.00
Dow Jones index recently broke the daily up channel from end of July – which was preceded by the downward reversal from the key resistance level 46775.00 (former monthly high from last month).
The breakout of this up channel from accelerated the active short-term downward correction ii from the start of October from resistance level 46775.00.
Given the strength of the resistance level 46775.00 and the bearish divergence on the daily Stochastic indicator, Dow Jones index can be expected to fall to the next support level 45470.00 (target price for the completion of the active correction (ii)).
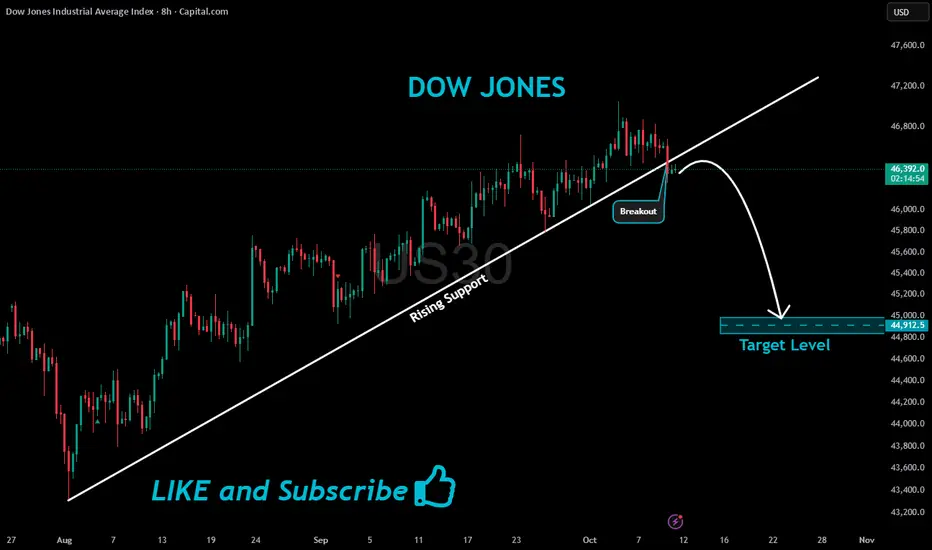
US30 Bearish Breakout!
HI,Traders !
#US30 made a bearish
Breakout of the rising support
Line and we are bearish biased
So we will be expecting a
Further bearish move down !
Comment and subscribe to help us grow !
US30 Bulliash BiasLooking at US30 bullish idea today . Volume more likely to be created at 2.30pm uk time for me . looking for a rection from these zones

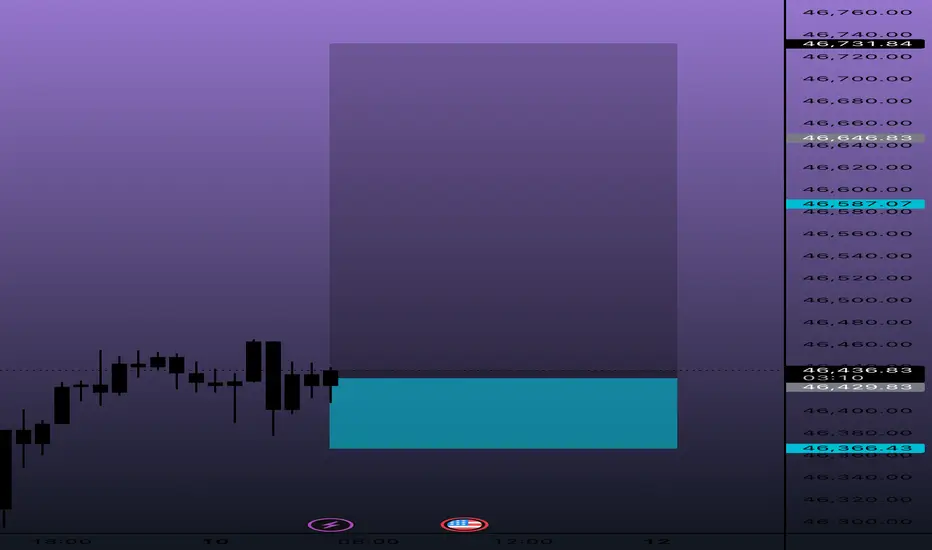
US30: Absolute Price Collapse Ahead! Short!
My dear friends,
Today we will analyse US30 together☺️
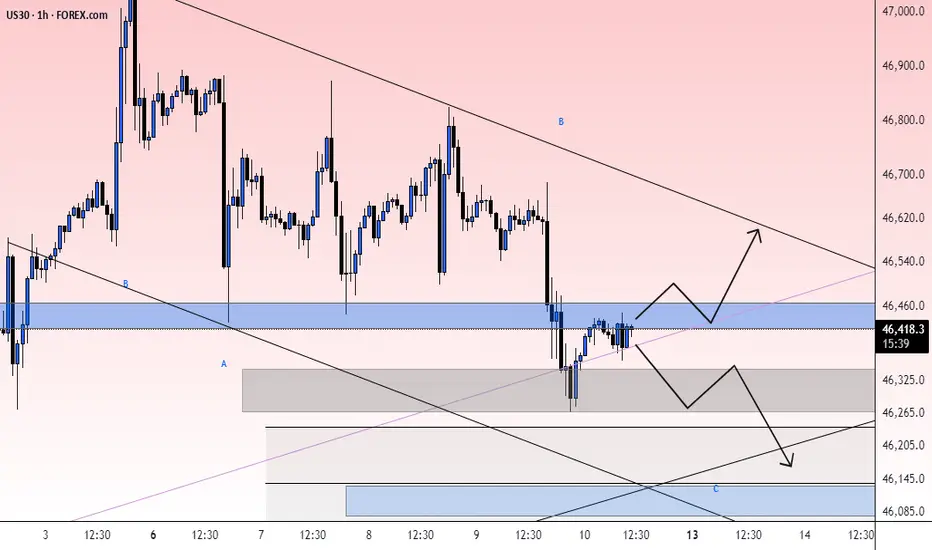
The recent price action suggests a shift in mid-term momentum. A break below the current local range around 46,434.34 will confirm the new direction downwards with the target being the next key level of 46,322.75 and a reconvened placement of a stop-loss beyond the range.
❤️Sending you lots of Love and Hugs❤️
DowJones key trading levels Friday 10th OctoberKey Support and Resistance Levels
Resistance Level 1: 46726
Resistance Level 2: 46930
Resistance Level 3: 47060
Support Level 1: 46290
Support Level 2: 46190
Support Level 3: 46070
This communication is for informational purposes only and should not be viewed as any form of recommendation as to a particular course of action or as investment advice. It is not intended as an offer or solicitation for the purchase or sale of any financial instrument or as an official confirmation of any transaction. Opinions, estimates and assumptions expressed herein are made as of the date of this communication and are subject to change without notice. This communication has been prepared based upon information, including market prices, data and other information, believed to be reliable; however, Trade Nation does not warrant its completeness or accuracy. All market prices and market data contained in or attached to this communication are indicative and subject to change without notice.
Us30 Trade Set Up Oct 10 2025Price pushed down hard yesterday confirming bearish structure and creating a 4h FVG and 1h FVG which i want to see price trade into, respect them and form internal 1m IFVG/CISD to target PDL
www.tradingview.com

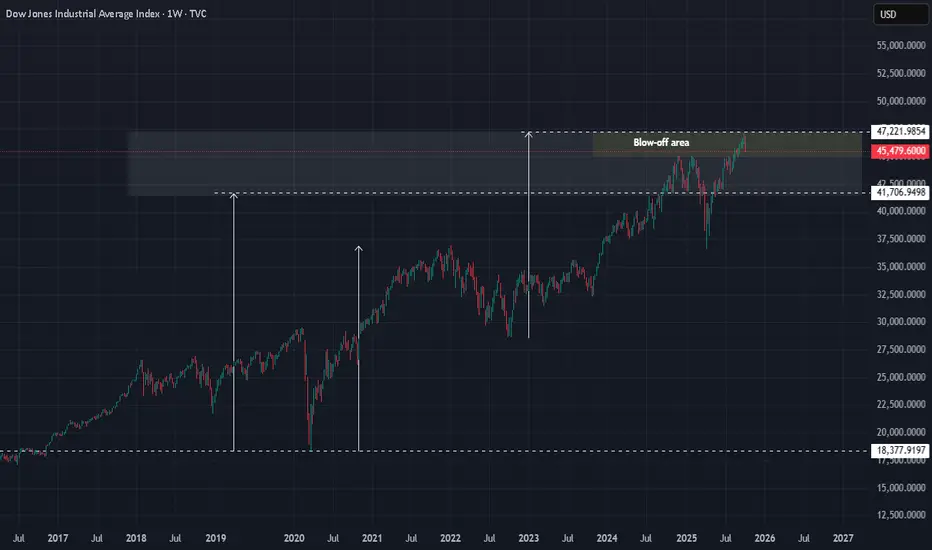
Dow Jones v/s Gold Ratio — History Repeating?Currently both DJI & Gold are at there peak levels, but the ratio has already breached a historical support, signaling further downfall.
Whenever the Dow-to-Gold ratio tests or breaks the 12.0 level, stories are created in history.
* 1929: Great Depression hit — stocks crashed, gold outperformed.
* 1973: Oil shock & stagflation — gold surged as inflation soared.
* 2008: Global Financial Crisis — stocks collapsed, gold became the safe haven.
- 2020: COVID tested the level but failed to break it.
Now, in 2025, the ratio has again breached the historic level of 12.0 — the same zone that preceded past market meltdowns.
Each time stocks looked strong relative to gold, the cycle turned
* Gold rallied.
- Stocks corrected.
----------------------------------------------------------------------------------------------------------------
What is the Dow-to-Gold Ratio?
Dow/Gold Ratio = Value of Dow Jones Index ÷ Price of Gold (per ounce)
This ratio tells us how many ounces of gold it takes to buy one unit of the Dow Jones Industrial Average.
For example:
If Dow = 46,000 and Gold = 4000 → Ratio = 11.5.
That means it takes 11.5 ounces of gold to buy one unit of Dow.
If the ratio falls to 6, which the chart is signaling, then it will mean:
1. Stocks might weaken or
2. Gold might become stronger or
3. If both weaken, then stocks will fall more than gold
----------------------------------------------------------------------------------------------------------------
Interpretation
1. Whenever the ratio is high, it means stocks are expensive compared to gold (risk-on period) .
2. Whenever the ratio falls, it means gold is outperforming stocks (risk-off, crisis or correction phase) .
Overall, the Dow to Gold ratio suggests that this is not a normal period - a period of crisis & correction - a risk-off period
Each time this ratio reached around current levels, a major stock market downturn followed

Us30Last post up…
Full porting for $46,600s run the remains.
Cutting Nasdaq. Go long smack out ,336 into extensions…
Have a great weekend!!!
💼

Dow Jones (US30) Analysis:The Dow Jones index continues to move in a short-term bearish trend, currently testing a key support level around 46,300.
🔻 Bearish Scenario:
If the price breaks below 46,300 and holds, it may head toward the liquidity zone near 46,100.
🔺 Bullish Scenario:
If the index rebounds from the current support and breaks above 46,490, it could push higher toward 46,650.
📌 Best Buy Zones: On a rebound from 46,300 or 46,100
📍 Best Sell Zone: Below 46,300

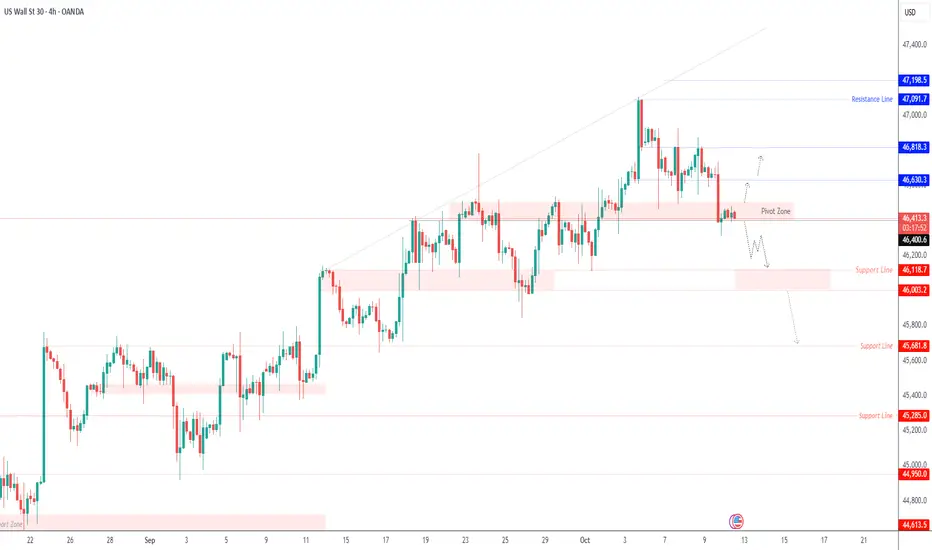
US30 – Key Pivot Test at 46,400 Before Directional BreakoutUS30 – Overview | Key Levels in Focus Before Next Move
The Dow Jones remains in a consolidation phase, awaiting a clear breakout signal as traders weigh broader U.S. market uncertainty.
The price is holding around a key technical zone, with 46,400 acting as the short-term pivot between bullish and bearish momentum.
Technical Outlook
A 1H close below 46,400 would confirm a bearish continuation, targeting 46,120 → 46,000, and a sustained break below this zone could extend toward 45,680.
On the other hand, if the price closes above 46,510, it would reinforce bullish momentum toward 46,630 → 46,810, with potential to test 47,090 if buying pressure strengthens.
Pivot Line: 46,400
Resistance: 46,630 · 46,810 · 47,090
Support: 46,120 · 46,000 · 45,680
Us30.Shoot a long here…. Looks worth it…
Last one on the night, time to drink 🥂
Have a great weekend!!!
Everyone!!!! 🧘☺️
US30 Eyes 46,200 Support as Bulls Prepare for Next Leg Higher!Hey Traders,
In today’s session, we’re monitoring US30 for a potential buying opportunity around the 46,200 zone. The Dow Jones remains within a clear uptrend, and price is currently in a healthy correction phase, approaching a key confluence of support and trendline structure near 46,200.
A sustained reaction from this level could signal a continuation of bullish momentum in the broader equity market.
Trade safe,
Joe.
check the trendGiven the index is located between the two resistance and support areas, with the price breaking and stabilizing, the continuation of the movement in the same direction is likely.