support and resistance in DOTUSDTyou can see the support and resistance levels of the dotusdt in the chart
Trade ideas
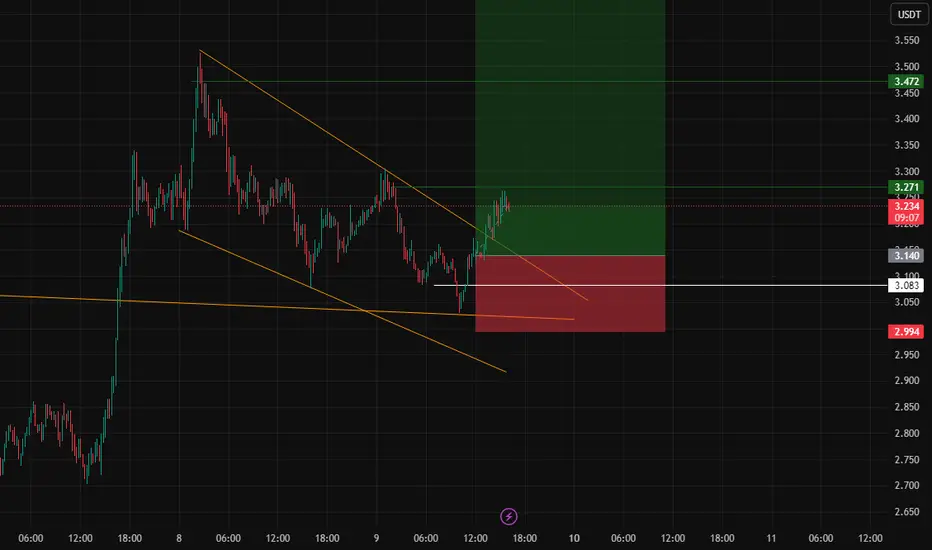
DOT USDT LONG SIGNAL📢 Signal Alert
🔹 Pair: DOT / USDT
📈Trade Type: Long
💰Entry Zone: 3.140 – 3.085
🎯 Take-Profit Targets (Partial Management):
▫️TP1 = 3.270
▫️TP2 = 3.470
▫️TP3 = 3.675
▫️TP4 = 4.000
🛑 Stop-Loss: 2.990
📊Timeframe: 15m
⚖️Risk/Reward Ratio: 6.35
📌Suggested Leverage: 5x – 10x
⚠️ Capital management is mandatory.
💬Please review the chart before entering the trade.
---
🧠 Technical Overview:
DOT is consolidating near a strong support zone.A hold above the 3.08-3.14 area could initiate a new upward impulse towards higher resistance levels. The exceptionally high Risk/Reward ratio suggests a favorable potential move if the support holds.
RSI is positioned for a potential bullish reversal, and a break above the local resistance could confirm strength for targets TP1 and beyond.
---
⚙️ Trade Management Tips:
· Take partial profit at TP1 and move SL to entry to secure risk-free exposure.
· Trail your stop-loss for the remaining positions as price progresses through TP2 and TP3.
· A decisive candle close below the 2.990 stop-loss level invalidates the bullish structure.
---
⚠️ Disclaimer:
This signal is for educational purposes only and not financial advice.
Always perform your own analysis and apply strict risk management.
---
DOT USDT LONG SIGNAL---
📢 Signal Alert
🔹 Pair: DOT / USDT
📈 Trade Type: Long
💰 Entry Price: 3.082
🎯 Take-Profit Targets (Partial Management):
▫️ TP1 = 3.270
▫️ TP2 = 3.310
▫️ TP3 = 3.439
▫️ TP4 = 3.676
▫️ TP5 = 4.000
🛑 Stop-Loss: 2.850
📊 Timeframe: 1H
⚖️ Risk/Reward Ratio: 10.14
📌 Suggested Leverage: 5x – 10x
⚠️ Capital management is mandatory.
💬 Please review the chart before entering the trade.
---
🧠 Technical Analysis Summary:
DOT is forming a bullish continuation pattern above key support at 2.85–2.90, showing strong reaction and volume accumulation.
If price sustains above 3.08, a breakout toward 3.43–3.67 is likely.
RSI is turning upward from the mid-zone (≈50), suggesting renewed bullish momentum, and the EMA20 crossover supports a move to higher highs.
---
⚙️ Trade Management Tip:
• Take partial profits at TP1 and move stop-loss to Entry.
• Use a trailing stop after TP2 to lock in gains.
• Avoid re-entry if price closes below 2.85 on the 1H timeframe.
---
⚠️ Disclaimer:
This signal is for educational purposes only and not financial advice.
Always DYOR and apply strict risk management.
---

Scalp Long – DOT💎 Scalp Long – DOT
Price has broken out of the downtrend, confirming a shift in short-term momentum. RSI is in the buying zone, and buying volume is increasing, signaling renewed strength. On the 1H timeframe, RSI has also broken out, reinforcing bullish sentiment.
🎯 Trade Setup:
→ TP: 2.976 | SL: 2.491 | RR: 1 : 2.77
Market structure and momentum align for a clean scalp long setup, favoring a continuation move following the breakout.

DOT/Polkadot DropDOT is facing a supply zone (the green area), and the neckline (green) on the RSI has been broken. When the blue line breaks and the RSI pulls back to its broken neckline, that's one of the optimal entry points. This is because stop hunting is highly likely in supply and demand zones, I've drawn the probable path of movement. BINANCE:DOTUSDT

DOT USDT LONG SIGNAL📢 Signal Alert
🔹 Pair: DOT / USDT
📈 Trade Type: Long
💰 Entry Zone: 2.745– 2.700
🎯 Take-Profit Targets:
TP1 = 2.795
TP2 = 2.820
TP3 = 2.863
🛑 Stop-Loss: 2.69
📊 Timeframe: 1H
⚖️ Risk/Reward Ratio: 3.88
📌 Suggested Leverage: 5x–10x
🔄 After TP1 is reached, move Stop-Loss to Entry to secure profits.
🧠 Technical Analysis Explanation
DOT is forming a bullish structure with higher lows and is currently retesting the 2.70–2.71 support zone, which previously acted as a strong demand level. The price is holding above the EMA 50 on the 1H chart, confirming a short-term uptrend continuation.
RSI is recovering from the 50 zone, signaling renewed buying momentum. The entry range (2.756–2.700) provides an optimal setup for a continuation move toward 2.86 resistance, aligning with Fibonacci and price action confluence.
The stop-loss at 2.710 is well-placed below structural support, maintaining a solid R/R ratio of 3.88.
⚙️ Trade Management Tip: Wait for a bullish confirmation candle (e.g., 1H engulfing or strong bounce) before entering. Take partial profits at TP1, and move SL to entry afterward for optimal risk control.
---

$DOT (WEEKLY): this coin was BORN in 2021 to be DISTRIBUTED CRYPTOCAP:DOT - whole existance on this WEEKLY chart. Ugh.
Coclusion: it exists only to be DISTRIBUTED.
Peaked in the previous cycle, no signs of recovery ever since.
#dot2.0 was merely the last attempt to re-distribute a dying coin with terrible tokenomics.
This is not an argument, these are facts.
You can argue with Wyckoff Schematics if you want to.
💙👽

DOT USDT SHORT SIGNAL---
📢 Trade Idea: DOT/USDT
Type: Short
Entry Price: 3.070
🎯 Take-Profit Targets:
• TP1 = 3.010
• TP2 = 2.863
• TP3 = 2.724
• TP4 = 2.597
• TP5 = 2.460
🛑 Stop-Loss: 3.173
⏱ Timeframe: 1H
⚖️ Risk/Reward Ratio: 6.3
💥 Suggested Leverage (if used): 5x–10x
---
Technical Analysis:
DOT is forming a clear bearish structure, with price failing to hold above the key resistance zone at 3.10–3.17.
A rejection from this level, combined with a lower-high formation and EMA crossover to the downside, confirms short momentum.
RSI also shows bearish divergence, signaling potential continuation toward the 2.86–2.60 range.
A clean break below 3.00 would validate further downside targets, with 2.46 as the extended goal.
---
Trade Management Tips:
• Consider partial profit-taking at each TP level.
• Move SL to entry once TP1 is hit.
• Setup invalid if price closes above 3.18 on 1H timeframe.
---
⚠️ Disclaimer:
This analysis is for educational purposes only and not financial advice.
Always DYOR and apply proper risk management before trading.
---
📌 Hashtags for visibility (TradingView SEO):
#DOTUSDT #Polkadot #CryptoTrading #ShortSetup #TechnicalAnalysis #TradingViewIdea #CryptoSignals
---

DOT - Up or Down?Afternoon fellow traders,
So, will UP or DOWN be the destine for Polkadot?
I gotta say, whole lotta ppl shorting thinking BTC will close that gap at 111k bucks give or take, but if that were to happen, I think we could just touch the support trendline and break up, now problem is, even if it breaks upwards, it could just fake it and come back down aggressively.
Anyway, regardless of the end result, theres money to be made both ways! Take advantage!
Trade thirsty, my friends!

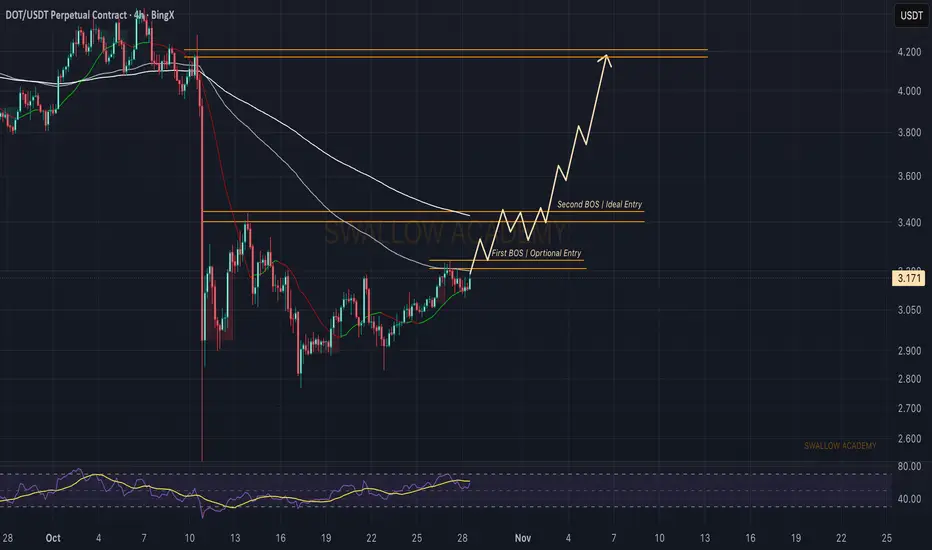
Polkadot (DOT): We Might Get Soon a Good R:R Setup!For DOT, we’re waiting for the first BOS to form — that would be the first step toward a possible upside movement. Once that happens, we’ll look for the second BOS as the main confirmation for the setup.
Good R:R trade can be taken here, but patience is key; we want to see structure shifts play out properly before going in.
Swallow Academy
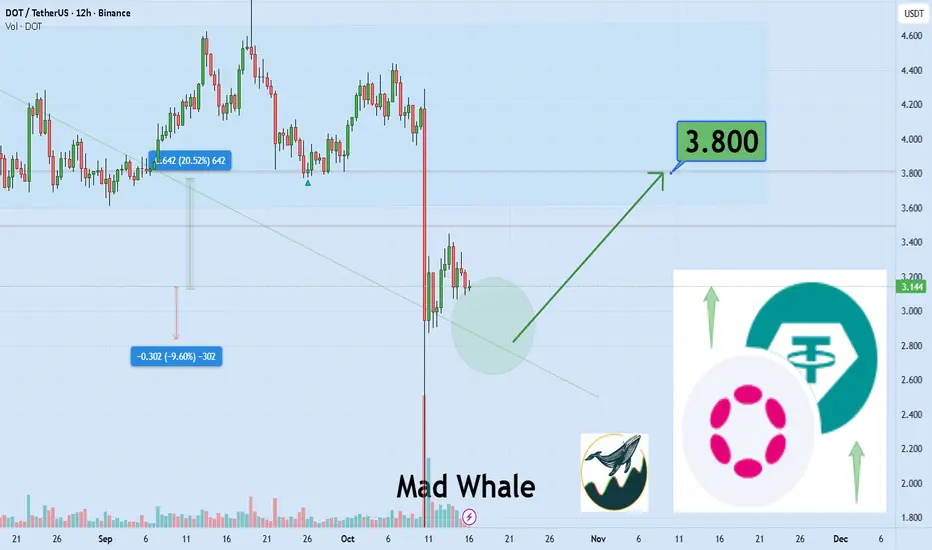
Dot can hit the upper targets if it holds the support areaHi the support and resistances on the chart are based on the previous data and weekly candlesticks if BINANCE:DOTUSDT holds this last support the potential of 20% gain is logical toward 3.80$
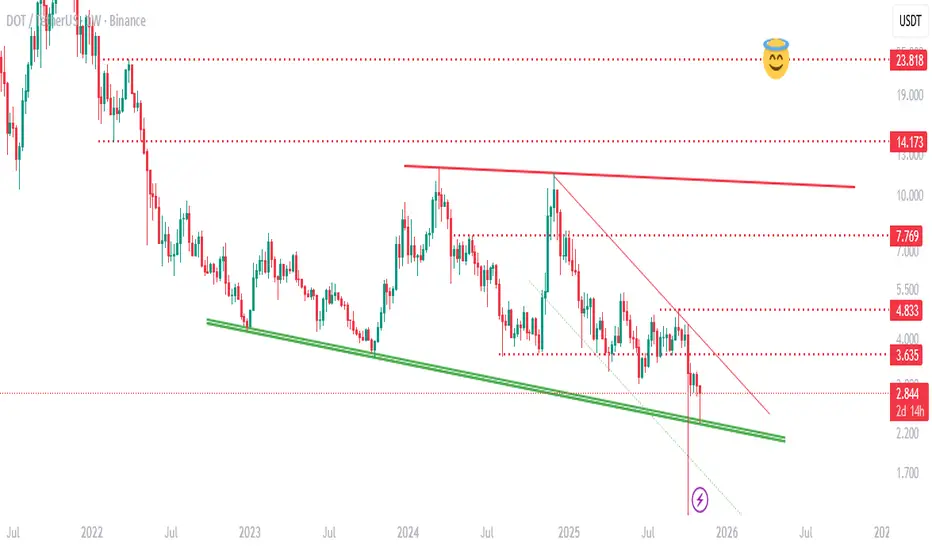
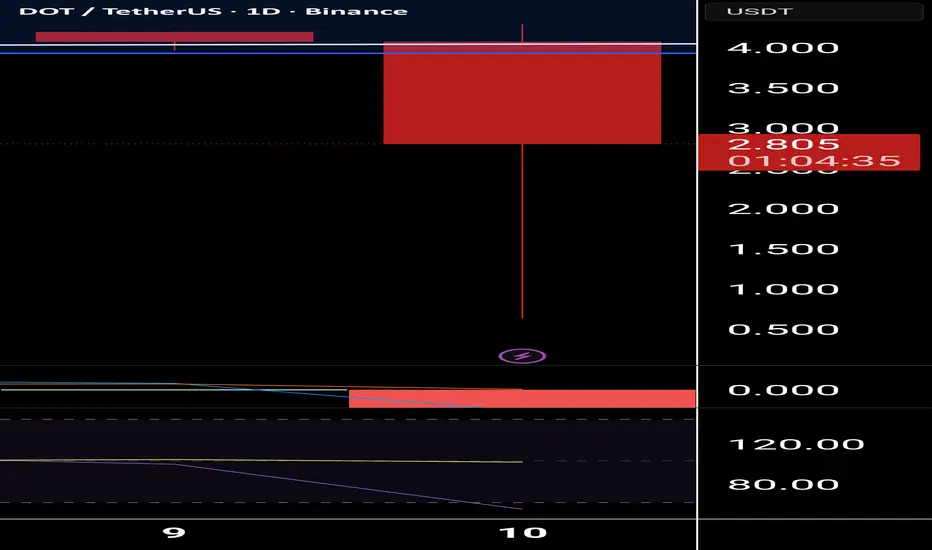
DOT : A 300% Opportunity with 2% RiskAlright, listen up, folks, this ain't no con, it's the real deal!
The DOT coin's pullin' off a textbook Wyckoff Spring pattern, and let me tell ya, it's a beaut!
We're talkin' 'bout a three-year accumulation phase—patience like that sets up somethin' big.
Right now, at $3.08, this is your shot, your golden ticket, and you don't wanna miss it. Set your stop-loss below $3 on a weekly candle close—yep, just a measly 2% risk. But the payoff? Oh, boy, the target’s sittin’ pretty at $10-$11. That’s a 300% gain, partner! And get this: the Wyckoff Spring pattern’s got a success rate hoverin’ around 75% when it’s this clean. So, you in, or you gonna sit there and watch the train leave the station?
BINANCE:DOTUSDT CRYPTOCAP:DOT COINBASE:DOTUSD BYBIT:DOTUSDT.P

$DOT (DAILY): LOWEST prices in 5 years, DEATH-SPIRALLING?CRYPTOCAP:DOT has started going into a DOWNSPIRAL due to poor adoption and terrible tokenomics.
The lowest prices since its launch in the previous crypto cycle, what else to add?
This project has built-in inflation of 8%+, daily emmissions of roughly 330k tokens, freshly minted, entering circulation every day.
Nobody wants it, nobody needs it, that's the realest truth, and I know how many die-hard fans and holders it's got. This coin should not be valued in billions ($4.7B market-cap).
Too late for this wreck to do anything, it's destined for sub-dollar prices in the coming years.
In Q4, even if it gets lucky and ends up rallying a bit due to a wider market run... I see no coming back, and nothing positive to say about the DAILY chart, either.
Very weak bounce, below all lows and support levels, that's just illustrates clearly how bad the fundamentals are for this project this year. 👽💙
#Dot #bearmarket #coin

$DOT Technical Analysis And Price forecast: DOT could fall to 2.DOT dropped to 0.6$ during the crash last week, and now DOT is showing bearish momentum, 3.5$ was previously reacting as a key support level and now it is reacting as resistance the DOT has faced rejection from this price.
At the time of writing this on Saturday DOT is trading at 2.92$ making lower lows and lower highs indicating short term bearish momentum.
The next key psychological support level is 2.55$-2.60$, CRYPTOCAP:DOT Could retest this support.
The price sentiments for Dot are bearish until it will not make a day close above 3.5$.
Relative strength Index RSI is at little higher from the over sold level indicating strong bearish momentum. Moving Average Convergence Divergence MACD is also showing higher selling pressure in DOT.
#Polkadot

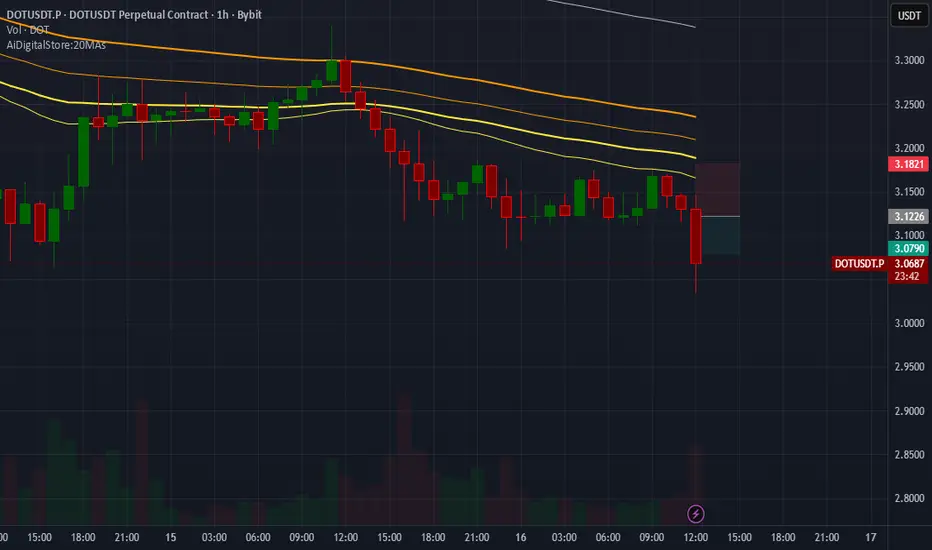
DOTUSDT.P SHORTDOTUSDT.P SHORT
The market has the potential for an downtrend
Price: 3.1226 $
Main target 3.0790 $
SL 3.1821 $
Dot What just happened? Does anyone know what just happened?
Also could either be the start of the Bull run for this coin or its demise? Be safe guys, I just lost a lot on this one, At the moment.
$DOT WEEKLY CHART UPDATE #DOT is showing a strong long-term CRYPTOCAP:DOT WEEKLY CHART UPDATE
CRYPTOCAP:DOT is showing a strong long-term accumulation pattern around the $3-4 zone. This level has acted as a solid historical support since 2022. If it holds, we could see a major reversal ahead with potential upside targets around $10–$20 by 2026.
The structure looks bullish, and early accumulation here could pay off big in the next cycle. 🚀

$DOTPolkadot’s architecture includes a central Relay Chain with non-native blockchains running on top of the network called Parachains. The Relay Chain handles the network’s security, consensus, and interoperability, secured using a Nominated Proof-of-Stake (NPoS) consensus model. Many parachains are written using the Polkadot Runtime Environment SDK, which allows developers to create their own parachains to operate on the Polkadot network.
There are many types of parachains each specialised for its own uses cases, such as:
System parachains, which uses Polkadot’s native token, DOT
Bridge parachains to connect to external network like Kusama, Polkadot’s Canary Network
Smart contract parachains for hosting EVM dApps.

DOT MIGHT GO UPTRENDCan’t tell if the breakout will happen from here. Seems so..
3.6–3.8 was strong support, with a few false breakdowns.
Accumulation since February
1D MA50 above MA200 (Golden Cross "soon")
Dip Zone
Low Volatility

DOT: Still bullish and well-positioned for further gainsDOT: Still bullish and well-positioned for further gains
DOT continues to extend its upward move. The price reached 4.34 so far with minor moves.
Momentum looks weak considering BTC is testing strong territory again. However, considering all altcoins have plenty of room to grow further, the chances of a larger upward move still remain high.
It may take a short pause, but as long as it stays above 4.1, the chances of a bullish wave remain intact.
🎯 Key upside targets:
$4.43
$4.60
$4.85
You may find more details in the chart!
Thank you and Good Luck!

Can DOT/USDT Sustain Its Bullish Momentum This Week?🎯 DOT/USDT: The Kijun Breakout Heist 💎 | Swing/Day Trade Setup
📊 Market Overview: POLKADOT vs TETHER
The DOT/USDT pair is flashing some serious bullish signals, and this setup is looking too good to ignore! We've got a Kijun moving average breakout brewing alongside a CCI momentum oscillator golden cross — the kind of technical alignment that makes traders smile. 😏
🎯 The "Thief Strategy" Game Plan
Trading Style: Swing/Day Trade Hybrid
Bias: BULLISH 🚀
Confirmation: Kijun MA breakout + CCI golden cross momentum surge
💰 Entry Strategy: The Layered Limit Order Approach
Here's where it gets interesting. Instead of market buying like a rookie, we're using multiple limit orders (the "layering strategy") to scale into this position like professionals:
Suggested Entry Layers:
🎯 Layer 1: $4.150
🎯 Layer 2: $4.200
🎯 Layer 3: $4.250
You can add more layers based on your position size and risk appetite. The beauty of layering? You average into the move instead of gambling on one entry!
🛡️ Risk Management Zone
Stop Loss: $4.050 🚨
⚠️ IMPORTANT DISCLAIMER:
Dear Ladies & Gentlemen (Thief OG's) — this is MY stop loss level based on MY analysis. You are NOT obligated to use this level. Trading is YOUR responsibility, YOUR risk, YOUR reward. Set YOUR own stop loss based on YOUR risk tolerance. Manage your money, take your profits, and protect your capital at your own discretion.
🎯 Profit Target: Know When to Exit the Heist
Target Zone: $4.600 💰
This target aligns with:
Strong historical resistance
Overbought RSI/CCI conditions (potential trap zone)
Natural profit-taking area
🚨 Exit Strategy Reminder:
Dear Ladies & Gentlemen (Thief OG's) — this is MY target based on MY technical analysis. You are NOT required to follow this target. Take profits when YOU feel comfortable. Lock in gains, scale out, or let it ride — it's YOUR choice and YOUR capital. Make money, then take money at your own risk.
🔍 Key Technical Indicators Breakdown
✅ Kijun Moving Average: Bullish breakout confirmed
✅ CCI Momentum Oscillator: Golden cross formation (bullish momentum shift)
✅ Price Action: Higher lows forming, trend structure improving
✅ Volume Profile: Increasing buying pressure on breakout levels
💎 Related Pairs to Watch (Correlation Play)
Keep an eye on these correlated assets for confluence:
CRYPTOCAP:DOT Dominance — Overall Polkadot ecosystem strength
$KSM/USDT (Kusama) — Polkadot's canary network, often moves in tandem
$ATOM/USDT (Cosmos) — Similar interoperability narrative
$AVAX/USDT (Avalanche) — Competes in similar L1 smart contract space
$BTC/USDT — King Crypto correlation; DOT typically follows BTC trend direction
$ETH/USDT — Ethereum's strength often lifts altcoins including DOT
Why watch these? If CRYPTOCAP:DOT rallies while CRYPTOCAP:BTC and CRYPTOCAP:ETH consolidate, that's relative strength — a bullish divergence. If ASX:KSM pumps, CRYPTOCAP:DOT often follows. Smart traders watch the whole ecosystem, not just one chart! 👀
🧠 Final Thoughts: Trade Smart, Not Hard
This setup combines:
📈 Momentum confirmation (CCI golden cross)
📊 Trend confirmation (Kijun breakout)
💰 Smart entry execution (layered limits)
🛡️ Defined risk (clear stop loss)
🎯 Clear target (resistance + overbought zone)
The "Thief Strategy" isn't about greed — it's about stealing profits from the market with precision and discipline. Layer in, manage risk, and take profits when the market gives them to you. 💼
📌 Disclaimer
⚠️ This is the "Thief Style" trading strategy — for educational and entertainment purposes only. This analysis is NOT financial advice. Trading crypto carries substantial risk of loss. The "Thief" approach is a fun, stylish way to describe disciplined layered entries, but YOU are responsible for your own trading decisions, risk management, and capital. Trade what you can afford to lose. Do your own research (DYOR).
Not a registered financial advisor. Just a chart enthusiast sharing ideas. 🎨📊
✨ If you find value in my analysis, a 👍 and 🚀 boost is much appreciated — it helps me share more setups with the community!
#DOTUSDT #DOT #Polkadot #CryptoTrading #SwingTrading #DayTrading #TechnicalAnalysis #CCIOscillator #KijunBreakout #CryptoSignals #AltcoinSetup #LayeredEntry #RiskManagement #ThiefStrategy #BullishSetup #MomentumTrading

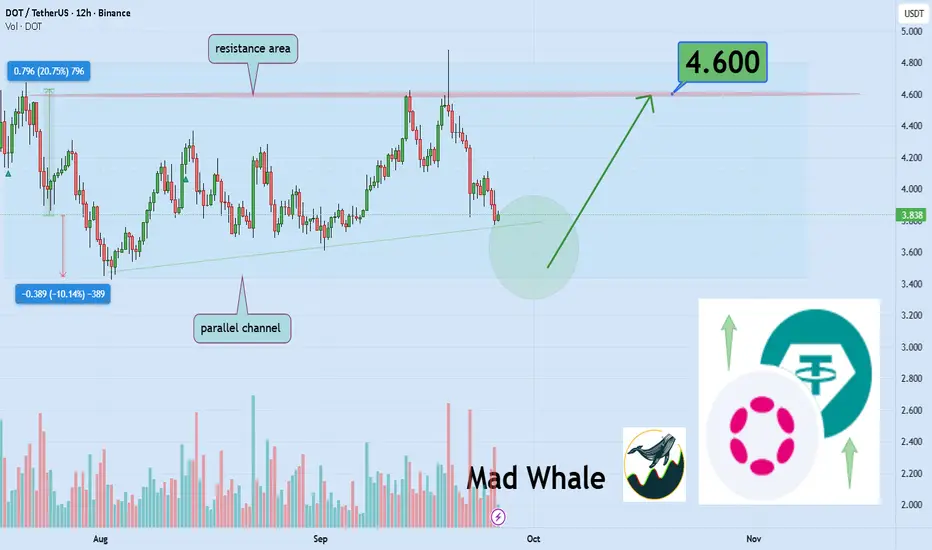
Polkadot testing strong support, potential 20% upside to 4.60Hello✌️
Let’s analyze Polkadot’s price action both technically and fundamentally 📈.
🔍Fundamental analysis:
Polkadot (DOT) is rolling out the JAM upgrade in Q4 2025, aiming for 1M TPS and stronger scalability for apps and enterprises.
With supply capped at 2.1B and inflation reduced, DOT could see stronger scarcity effects going forward.
📊Technical analysis:
BINANCE:DOTUSDT is trading near strong support within a parallel channel; if this zone holds, a 20% upside could push price toward $4.60 📈💹
📈Using My Analysis to Open Your Position:
You can use my fundamental and technical insights along with the chart. The red and green arrows on the left help you set entry, take-profit, and stop-loss levels, serving as clear signals for your trades.⚡️ Also, please review the TradingView disclaimer carefully.🛡
✨We put love into every post!
Your support inspires us 💛 Drop a comment we’d love to hear from you! Thanks, Mad Whale
DOT Follows BTC’s Bullish LeadDOT Follows BTC’s Bullish Lead
This week, Bitcoin staged a sharp recovery, flipping its outlook from mildly bearish to decisively bullish with a +9% surge in just three days.
That momentum has reignited optimism across all altcoins.
Polkadot (DOT) responded swiftly, completing a textbook Inverse Head and Shoulders pattern and rallying +9% since yesterday.
As shown in the chart, a short-term pullback toward $4.00 remains possible before the next leg higher.
🎯 Key upside targets:
$4.43
$4.60
$4.85
You may find more details in the chart!
Thank you and Good Luck!
❤️PS: Please support with a like or comment if you find this analysis useful for your trading day❤️
