Dot short to $3.771Just opened this short position on DOT. Aiming for $3.771
monthly close today . Taking advantage of the increase volatility. Its favoring bears as trend is down
Sl: 3.933
Time sensitive
Trade ideas

Polkadot (DOT): Wait For 200EMA To Be Broken And Get 200% ProfitDOT looks still bullish to us where on bigger timeframe we migth make 200% if we break that 200EMA and on smaller timeframes we are seeing 8-20% pump opportunity!
More in-depth info is in the video—enjoy!
Swallow Academy

PolkaDOT clearly shows BULLISH trend for OCTOBERPolkadot has an event this coming month.
The event proves to be fundamentally and technically potent for a cool bullish move.
I see this as an opportunity to milk the month of october.
See you at the TOP

Polkadot (DOT): Might Be Best Buy Entry, Might Be Not...Well, DOT is building up something here, where the price is at the local support zone, which has been holding the price pretty well.
SInce we touched that zone we have been also forming a smaller bullish trend which might result in an explosive movement towards the upper target zones (which would mean +50% of marketprice movement).
Swallow Academy

polkadot bullrun expected pricePolka Dot is holding it's support on weekly timeframe. First attempt to break local resistance is already happened. We are expected Dot ETF also which can drive it price at least 2x.

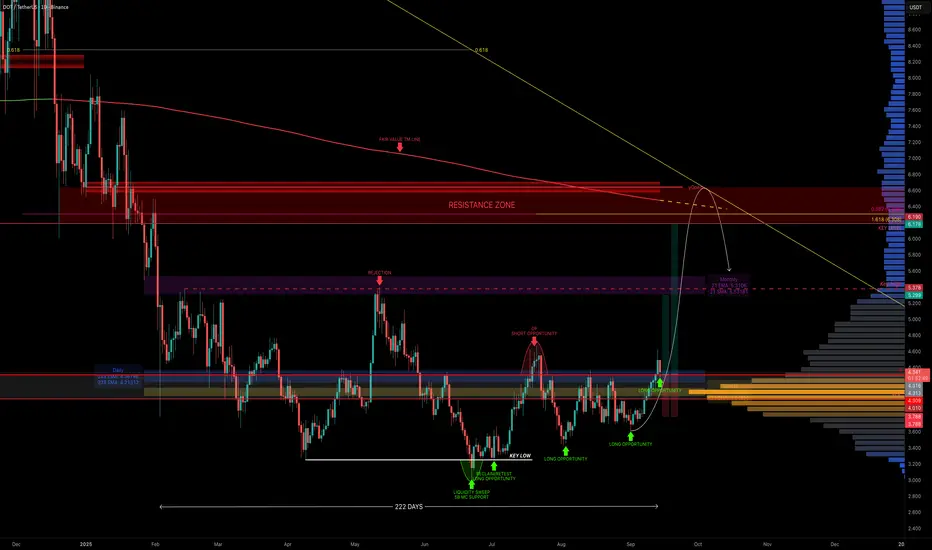
DOT — Key Levels Reclaimed, Breakout Ahead?DOT has been in sideways chop for 222 days, but things are finally getting interesting. Price is now sitting above the yearly level ($4.309), the daily 233 EMA/SMA, and the weekly 21 EMA/SMA. Even better, it reclaimed the POC of the entire 222-day range.
Why $4 Is So Important
Yearly level → $4.309
Daily 233 EMA → $4.37 / Daily 233 SMA → $4.21
Weekly 21 EMA → $4.15 / Weekly 21 SMA → $4.05
POC of 222-day range → $4
0.618 Fib retracement (current move) → $4
That’s a whole lot of support stacked at one zone.
Where It Gets Exciting (Targets)
First major target is the monthly 21 EMA/SMA ($5.3–$5.5), which also lines up with the range highs. That’s the first real test. The swing target zone sits around $6–$6.5, with multiple layers of confluence:
Key Level → ~$6
Fair Value Trend Model Line → ~$6.5
0.382 Fib retracement of the downtrend → ~$6.19
0.618 Fib speed fan → ~$6.2 (October projection)
1.618 trend-based Fib extension → $6.308
Market Cap Confluence: 10B market cap at $6.18
Yearly Open: $6.642 → the overall target and an additional layer of resistance
📌 This creates a solid resistance cluster between $6–$6.6, ideal for taking profits and potentially looking for shorts.
🟢 Long Trade Idea
Entry: Ladder longs from $4.36 down to $4
Stop: Below $4 (clear invalidation)
Take Profit: If $4 holds, DOT’s path is clear: first stop $5.3-$5.5, then $6.0–$6.6 as the macro target with the yearly open at $6.642 marking the final resistance.
Key Levels
Support → $4.36–$4
Resistance → $5.3–$5.5, then $6.2–$6.6 (10B market cap $6.18 + yearly open $6.642)
🔍 Indicators used
LuxAlgo — Liquidity Sentiment Profile (Auto-Anchored)
DriftLine — Pivot Open Zones → For identifying key yearly/monthly/weekly/daily opens that act as major S/R reference points
Multi Timeframe 8x MA Support Resistance Zones → to identify support and resistance zones such as the monthly 21 EMA/SMA.
Fair Value Trend Model → Calculates a regression-based fair value curve
➡️ Available for free. You can find it on my profile under “Scripts” and apply it directly to your charts for extra confluence when planning your trades.
_________________________________
💬 If you found this helpful, drop a like and comment!
Bottom candle for DOTBearish breaker controlling the price, down, 3rd algo target hit 1.618 fib.
Waiting for it to go around 10.913, Wbb- by 50%.

DOT analysisI think nice price to wait in that box(?)
because
The Polkadot DAO has signaled support for a hard cap, by passing Referendum 1710 on the “Wish For Change” track, with 81% in favor.

Polkadot Range-Bound Between Weekly Levels, POC Acts as MagnetPolkadot continues to trade between weekly support at $3.39 and resistance at $4.40. Price action remains rotational within this range, with the point of control acting as the primary magnet.
Polkadot’s price has been consolidating for an extended period within a defined weekly range. After multiple rotations between the value area low (VAL) and value area high (VAH), the market remains indecisive. Currently, price is gravitating toward the point of control (POC), a key level that often dictates the next directional bias.
Key Technical Points:
- Support: Weekly level at $3.39 holding as range low.
- Resistance: Weekly level at $4.40 capping range high.
- Structure: Rotational movement between value area levels with POC pull.
The persistence of range-bound trading highlights the ongoing battle between buyers and sellers. Each rotation between the $3.39 support and $4.40 resistance reflects uncertainty, but also opportunity for traders who capitalize on mean-reversion setups.
The POC currently acts as a magnet, pulling price into balance. This level’s significance cannot be understated, as acceptance above or below it could shape the next phase of price development. Should Polkadot establish bullish acceptance above the POC, a rotation toward $5 becomes increasingly likely. Conversely, rejection at the POC could result in another retest of range lows.
From a market structure perspective, the extended consolidation may ultimately lead to a breakout, but until that occurs, traders should continue treating the price action as rotational.
What to Expect in the Coming Price Action:
Polkadot remains locked within its established range. A decisive break from the POC will provide clearer directional cues, with upside potential toward $5 if buyers can seize control.

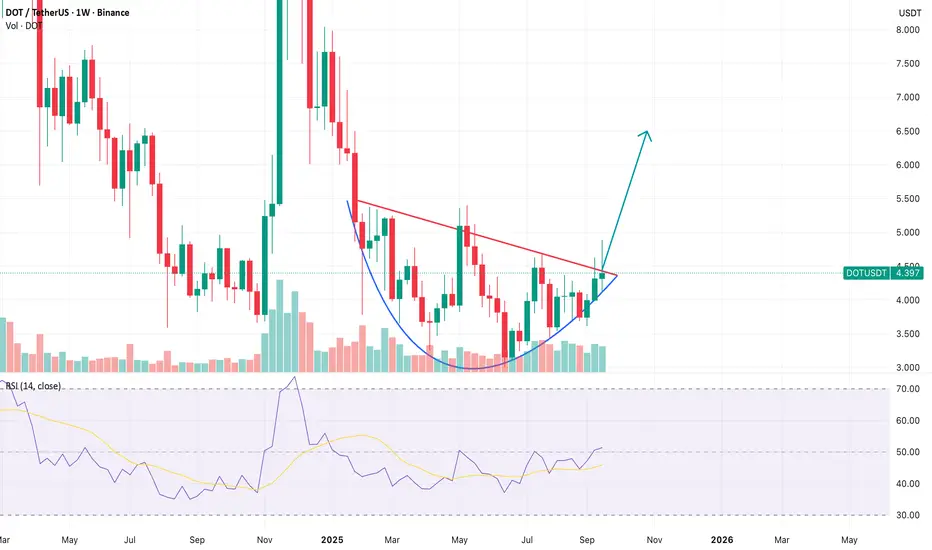
DOTUSDT - 200% Upside - Long SetupDOTUSDT has been in a long consolidation. A bullish divergence was there and now a wedge pattern was in play and finally a bullish breakout and retest could be observed. This would mean a trend reversal and further Higher Highs and Higher Lows. Therefore, giving the perfect opportunity for a long entry for a 3x (200%) return.
Fundamentally the new tokenomics and immense focus on interoperability makes it more promising that PolkaDot could be seen flying in a matter of no time.
So going long on PolkaDOT.

Dot/Usdt
Polkadot cryptocurrency is worth buying at the price of $3.80, with a stop-loss at $3.40 and a target price of $4.80. It could potentially experience around 30% price growth from now.

DOT / USDT : Momentum building for a strong rallyDOT/USDT is showing strong momentum and looks ready for a rally. If momentum continues to build, the next upside targets are $5 – $6.
Always manage risk and wait for confirmation before entering.

$DOT clean ENTRY on daily candle CLOSE above $4.70CRYPTOCAP:DOT on the DAILY chart still under that long-term horizontal resistance up there at $4.60 - $4.70 which is also now the upper trendline of our ASCENDING TRIANGLE that has been forming since late June.
Same strategy, entries above $4.7 with a good daily candle close. Also about to materialize is the GOLDEN CROSS with a yellow 50SMA poised to cross above the green 200SMA.
A lot of Liquidity is trapped between $3.90 - $4.10 in the last 30 days though, so that's another reason to stay cautious here.
Have a look at the Liquidity heatmap attached, from the $4 zone could be our golden opportunity for increasing our positions.
Good things after a bullish RSI divergence, nicely shaped bottom, bullish patterns.. What's not to like about this DAILY chart? 👽💙

[DOTUSDT] Polkadot Approaching Breakout: Round Bottom TargPolkadot (DOT) is currently forming a round bottom pattern with a key resistance level at $4.40. On the daily timeframe, DOT has been attempting to break through this resistance but has not yet succeeded.
If this breakout attempt fails, DOT could retrace back to the $4.20 support zone for another retest. However, the round bottom structure suggests a gradual accumulation phase. Combined with the broader market’s anticipation of an altcoin season and the upcoming approval processes for DOT-related ETFs, this setup positions DOT as a compelling investment candidate.
From a technical perspective, should the breakout materialize, a rally toward the $6.50 target zone appears to be a realistic and achievable scenario.
POLKADOT TO $25Now that we know an altseason is on the way, I think this time Polkadot can break through the $10 resistance.
The next important and strong resistance is at $25, which is a resistance area and the 0.702 of the Fibonacci.

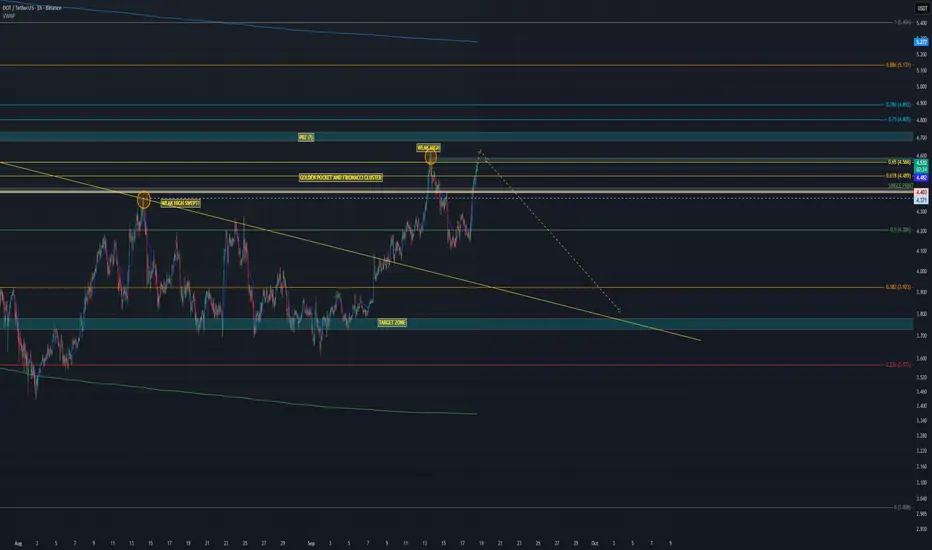
WHAT GOES UP, MUST COME DOWN – $DOT DUMP TIME?In my last analysis we nailed the move: CRYPTOCAP:DOT pumped to sweep the weak 14 Aug high exactly as projected. ✅ That mission is complete – now it’s time for the other side of the trade.
Analysis
14 Aug high swept → equilibrium reached.
Price in HTF Golden Pocket + strong Fib cluster.
Bearish harmonic + hidden bear div on CVD.
Orderflow: longs piling in, OI ↑ but price stuck → squeeze risk.
Likely SFP around $4.65 (take out Sept 13 high) → then dump.
First target: $3.75.
$dot potentialGreat opportunities here imo…
We could see a draw back but I don’t see anything lower than the $4 handle here.
The whole handle from the early into mid $4 pricing plays heavy here.
Again, some nice closures above $4.50 should see us above $6 with a crucial handle sitting @$8.30+ which is reasonable and demands playback!
If we do make ground on that target respectfully, $18 should be no problem!!!! 😉
🚀

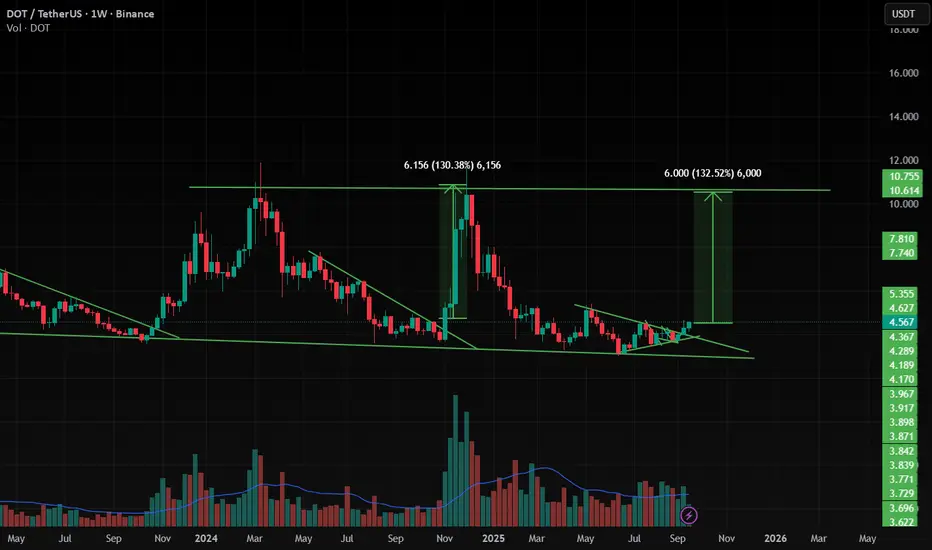
DOT is Ready for 130% Up Move DOT is making a pattern at Support zone and It has given a Breakout from that pattern . and at the same time Altcoin Season Index is at 74 , when it is >75 it is sign of very bullish in altcoins and Breakouts will have very high potential to give a big move .
and at the same time Bitcoin dominance is decreasing and altcoins dominance is started increasing , so look on all the altcoins
and follow proper risk management , it has very good chances to move UP side but first we have to protect the down side , where risk management comes into game .
Follow for more Ideas and potential coins/ Stocks .
Dot Polkadot >>Super Bullish in 18M!!"Polkadot forming an irregular flat pattern? Could surge 261.8% and potentially reach $140 in 18 months if an ETF is approved."

Polkadot Eyes $7.67 as Breakout LoomsPolkadot’s structure shows signs of bottoming. Accumulation above the 0.618 Fibonacci support has created a solid foundation, and price is now challenging resistance. This phase is critical, as confirmed breakouts from such levels often lead to sharp upward momentum.
Key Technical Points
- $3.39 Support: Defended strongly with Fibonacci alignment.
- $4.52 Resistance: Key level that has capped rallies for months.
- Upside Targets: $5 initially, with $7.67 the broader high-time-frame objective.
Analysis
DOT’s accumulation phase above $3.39 highlights strong buying activity. The presence of the 0.618 Fibonacci retracement adds weight to the case that this region marks a structural bottom. The next obstacle is resistance at $4.52, which has historically limited upward movement.
If price closes above this barrier, momentum is likely to accelerate into $5, and sustained demand could push toward the broader high-time-frame target at $7.67. This structure resembles a bottoming formation, where accumulation transitions into expansion. However, bullish volume nodes must persist for this breakout to materialize.
What to Expect
Polkadot remains bullish as long as $3.39 holds. A breakout above $4.52 would validate the bullish case, opening the path toward $5 and eventually $7.67. Traders should monitor volume closely to confirm the move.

DOT Breakout Incoming – Get Ready!
CRYPTOCAP:DOT Polkadot is showing early signs of a reversal from its long accumulation phase. After months of sideways action, the chart is hinting at a major upside move! 🧠📈
Targets to watch:
🎯 $8.54
🎯 $11.73
🎯 $14.41
This could be the start of a powerful rally. DOT is looking explosive! 💣

Polkadot (DOT): We Might See +80% Movement Very SoonDOT looks very good - we might be seeing a decent bounce happen very soon, which would give us +80% movement.
More in-depth info is in the video—enjoy!
Swallow Academy

DOT ; Boring movementsHello friends
According to the decline we have, you can see that the price has created an ascending channel and is slowly rising.
But there is an important resistance in its way, which it has hit once and caused a price correction, and the price is gathering strength to rise again.
Now, if this resistance is reliably broken and the price stabilizes above it, the price can move to the specified targets.
*Trade safely with us*
