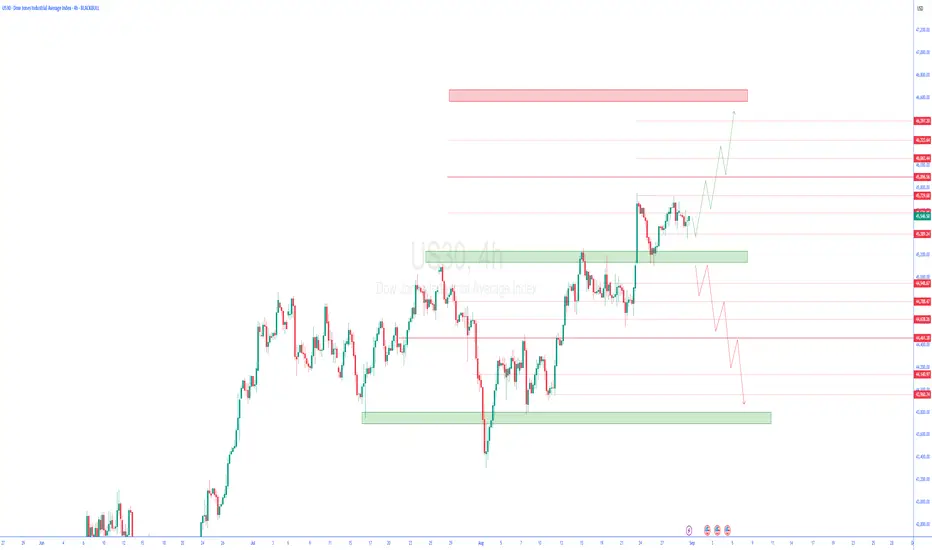
US30 / DOW JONES (SHORT)
Trendlines price on resistance
Pivots Weekly resistance Zone
MOnthly Pivot resistance Level
DJCUSD trade ideas

uptrend As long as the index fluctuates above the support range and the support trend line, the continuation of the upward trend to the specified targets is likely. If the support range is broken, the continuation of the corrective and downward trend is possible.


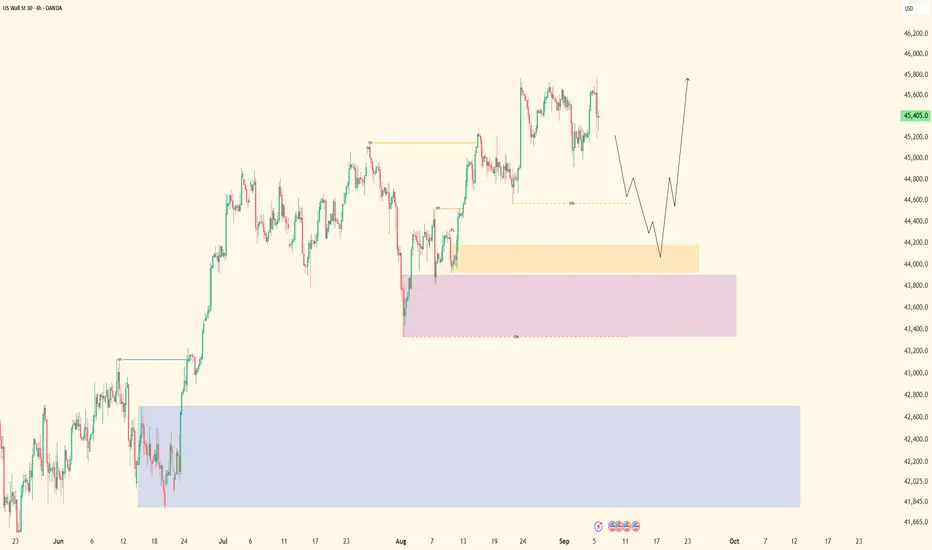
US30| Pullback Continuation SetupPair/Instrument: US30 (Dow Jones)
Bias: Bullish overall
HTF (4H+):
• Price is in a strong uptrend.
• Breaking major highs with strong volume confirming momentum.
• Candles printing with conviction — clear bullish control.
MTF (30M/1H):
• Waiting for sell-side liquidity sweep to trigger and respect internal framework OBs.
• Once mitigation occurs, the pullback will be primed for continuation.
LTF (5M/15M):
• Monitor for clean CHoCH + OB entry confirmations aligned with higher-timeframe bias.
• Entries anticipate continuation leg without chasing.
Targets:
• TP1: ~5.5 points / units from entry (quick partial target based on immediate LTF highs).
• TP2: ~30.5 points / units from entry (extended target based on HTF liquidity and swing).
Mindset Note:
• Wait for structured pullback and mitigation. Patience > impulse.
• Let the market sweep liquidity and set up your OBs before committing — the high-probability continuation will follow naturally.
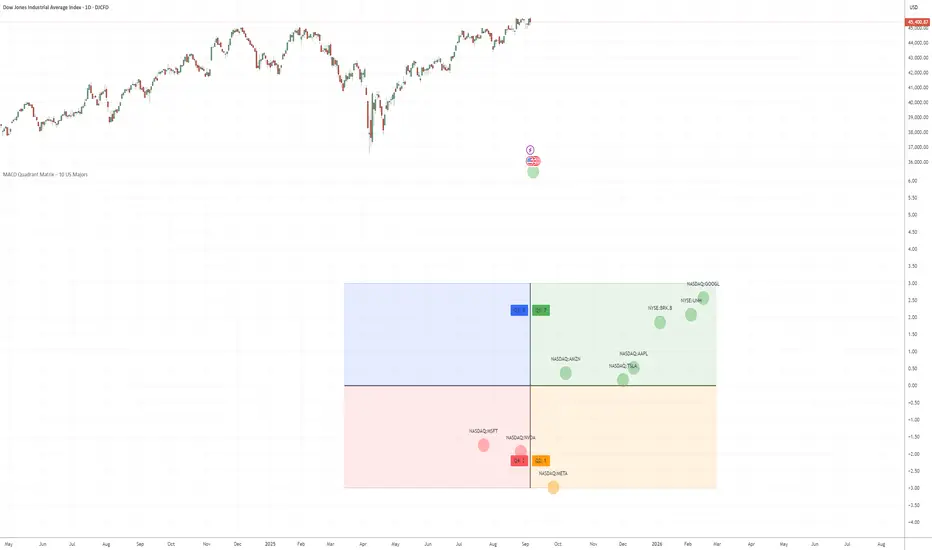
US 10 Major Rotation: MACD Quadrant Matrix Signals Sector ShiftsBased on the MACD Quadrant Matrix – 10 US Majors, we are seeing clear evidence of rotation between mega-cap tech stocks and large-cap value leaders.
🔹 Quadrant 1 (Leading – MACD Positive, Momentum Positive):
Strong performers remain in this quadrant: GOOGL, BRK.B, UNH, AAPL, TSLA. These stocks show sustained buying pressure and positive momentum.
🔸 Quadrant 2 (Weakening – MACD Positive, Momentum Negative):
META is starting to lose momentum despite a positive MACD → this could signal either consolidation or early weakness.
🔻 Quadrant 3 (Lagging – MACD Negative, Momentum Negative):
MSFT and NVDA are under pressure with both MACD and momentum turning negative. These names face higher downside risk if weakness continues.
🟢 Quadrant 4 (Improving – MACD Negative, Momentum Positive):
AMZN is in recovery mode, showing early signs of improvement. A breakout from this quadrant could push it into leadership.
Market Takeaway:
Rotation suggests select tech leaders (MSFT, NVDA) are moving into a corrective phase.
GOOGL, AAPL, TSLA remain strong leadership candidates.
Defensive large caps (BRK.B, UNH) continue to act as stable outperformers.
Trading Strategy:
Favor holdings in Quadrant 1 leaders (GOOGL, AAPL, TSLA, BRK.B, UNH).
Watch AMZN in Quadrant 4 for a potential breakout.
Be cautious with MSFT, NVDA in Quadrant 3 due to continued downside risk.
Risk Management:
Use stop-loss levels on weakening names.
Diversify between growth and defensive leaders to balance exposure.
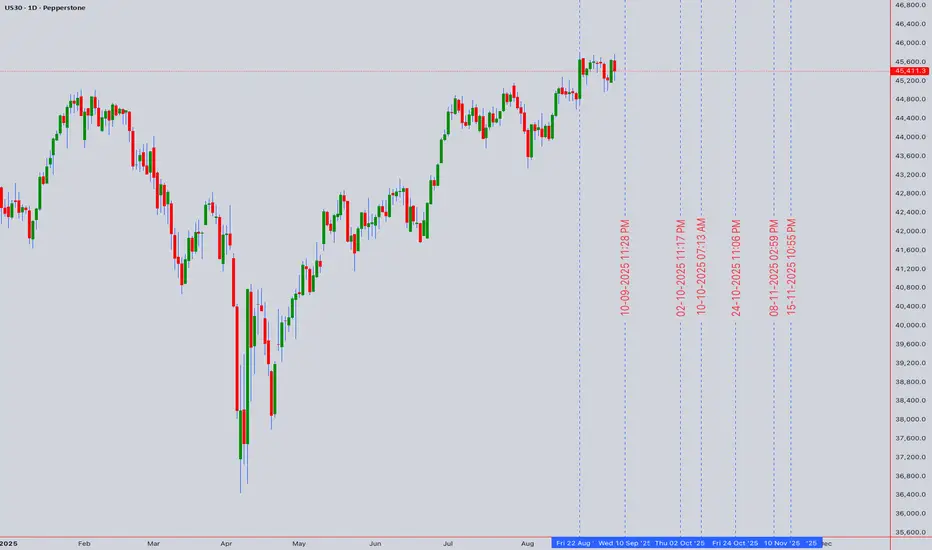
US30 At a Monumental High - Parabolic or Poised to Pull Back?US30 Technical Analysis: 🏭 At a Monumental High - Parabolic or Poised to Pull Back? 📉
Asset: US30 (Dow Jones Industrial Average CFD)
Analysis Date: September 5, 2025
Current Closing Price: 45,411.3 (as of 12:59 AM UTC+4)
Timeframes Analyzed: 1H, 4H, D, W
Executive Summary & Market Outlook 🧐
The US30 is trading at an all-time high in a powerful, near-parabolic advance. 🚀 While the trend is unequivocally bullish, the index is displaying extreme overbought conditions and is testing a major psychological barrier at 45,500. This represents a classic FOMO (Fear Of Missing Out) zone. A decisive breakout could see an extension of the rally, but the risk of a sharp, profit-driven pullback is significantly elevated. 📊 Prudence suggests waiting for a better risk-reward entry rather than chasing the move. This analysis outlines key levels for intraday traders 🎯 and swing traders 📈.
Multi-Timeframe Technical Analysis 🔍
1. Trend Analysis (Daily & 4-Hour Chart):
Primary Trend: 🟢 Strongly Bullish. Price is miles above all key moving averages, which are fanned out bullishly.
Momentum: 🟡 Exhaustion Signs. The rally has been almost vertical. Such moves are unsustainable in the short term and often conclude with a volatile correction.
2. Key Chart Patterns & Theories:
Parabolic Rise 📈➡️📉: The chart structure is parabolic. While bullish, these patterns are notoriously fragile and prone to sharp reversals as traders take profits.
Elliott Wave Theory 🌊: The rally is a clear five-wave impulse. We are likely in the final stages of Wave 5. This implies the completion of a cycle and warns that a larger, more complex corrective phase (Wave A-B-C or a deep Wave 4) is increasingly probable. A typical retracement target would be the 38.2% Fibonacci level of the entire Wave 3 rally.
Ichimoku Cloud (H4/D1) ☁️: Price is extremely far above the Cloud on all timeframes, indicating massive bullish momentum but also a severe over-extension from equilibrium. A mean reversion pullback towards the Cloud is a high-probability event.
Gann Theory ⏳: The 45,500 level is a key psychological and mathematical resistance. A decisive break above could target the next Gann angle, but rejection here is a significant risk.
3. Critical Support & Resistance Levels:
Resistance (R1): 45,500 - 45,600 (Key Psychological & Parabolic Resistance) 🚨
Resistance (R2): 46,000 (Projected Target if breakout occurs)
Current Closing Price: ~45,411
Support (S1): 44,800 - 45,000 (Immediate Support & Prior Breakout Zone) ✅
Support (S2): 44,200 - 44,400 (Major Support - 38.2% Fib & 21-day EMA) 🛡️
Support (S3): 43,500 (50-day EMA & 50% Fib Retracement)
4. Indicator Consensus:
RSI (14-period on 4H/D): Reading is well above 75 on both timeframes, signaling severely overbought conditions. 📛 This is the strongest sell signal the RSI can give and warns against new long positions.
Bollinger Bands (4H) 📏: Price is consistently piercing the upper band. A reversion to at least the middle band (20-period SMA) is a matter of when, not if.
Moving Averages: The bullish alignment is perfect but stretched. The EMA 21 on the 4H chart is critical short-term dynamic support.
Volume & VWAP: Volume may be declining on the most recent highs (a bearish divergence), suggesting the rally is running on fumes. 📉 Price is extremely extended from any logical Anchored VWAP level.
Trading Strategy & Forecast 🎯
A. Intraday Trading Strategy (5M - 1H Charts):
Bearish Scenario (Rejection Play) ⬇️: This is the highest probability play. Watch for bearish reversal candlestick patterns (e.g., Bearish Engulfing, Shooting Star 🌠, Doji) at or near the 45,500 resistance.
Entry: On confirmation of rejection (e.g., a break below a small consolidation low).
Stop Loss: Tight, above 45,600.
Target: 45,000 (TP1), 44,800 (TP2).
Bullish Scenario (Breakout Fade) ⚠️: Chasing a breakout here is high-risk. If price breaks above 45,500, it's safer to wait for a pullback to that level for a support re-test before considering a long.
B. Swing Trading Strategy (4H - D Charts):
Strategy: WAIT FOR A PULLBACK. The risk/reward for new long entries at this altitude is terrible. 🚫
Ideal Long Zones: Wait for a dip to 44,200 - 44,400 or even 43,500. This would provide a much healthier entry to ride the next potential leg up in the primary bull trend. ✅
Bearish Risk: A daily close below 44,000 would signal a deeper correction is underway, potentially targeting the 43,000 zone.
Risk Management & Conclusion ⚠️
Key Risk Events: All US economic data (especially jobs and inflation reports) and Fed speaker comments are potential catalysts for a volatility explosion. 🔥 The market is priced for perfection.
Position Sizing: Extreme caution is advised. This is a low-probability environment for new entries. Risk should be halved (e.g., 0.5% of account) due to the high volatility and unpredictability at peaks.
Conclusion: The US30 is in a spectacular bull run but is in a High-Risk Zone. 🎲 This is a time for profit protection for existing longs, not for FOMO buying. 🚫📈 Swing traders must be patient for a pullback. Intraday traders can look for short-term reversal signals. The most likely outcome is a healthy and necessary correction to recharge for the next move. 📉
Overall Bias: 🟢 Bullish above 44,200 | 🔴 Caution/Correction likely between 45,000-45,600
For individuals seeking to enhance their trading abilities based on the analyses provided, I recommend exploring the mentoring program offered by Shunya Trade. (Website: shunya dot trade)
I would appreciate your feedback on this analysis, as it will serve as a valuable resource for future endeavors.
Sincerely,
Shunya.Trade
Website: shunya dot trade
⚠️Disclaimer: This post is intended solely for educational purposes and does not constitute investment advice, financial advice, or trading recommendations. The views expressed herein are derived from technical analysis and are shared for informational purposes only. The stock market inherently carries risks, including the potential for capital loss. Therefore, readers are strongly advised to exercise prudent judgment before making any investment decisions. We assume no liability for any actions taken based on this content. For personalized guidance, it is recommended to consult a certified financial advisor.
Dow Jones in Accumulation: Breakout Will Set the TrendMarket Overview:
US30 is stuck in a sideways range 45,000–45,600 after a strong rally. This consolidation looks like an accumulation phase before the next impulse. Price remains above the EMA (144), confirming buyer strength.
Technical Signals:
Accumulation range: 45,000–45,600.
EMA (144) acts as support.
No breakout – no strong move.
Key Levels:
Support: 45,000 – 44,800 – 43,300
Resistance: 45,600 – 46,000
Scenario:
Main: breakout above 45,600 opens the path to 46,000–46,400.
Alternative: close below 45,000 could trigger a decline towards 44,800–44,300.
Conclusion:
Dow Jones is building energy. Once the range is broken, a strong trend will follow.

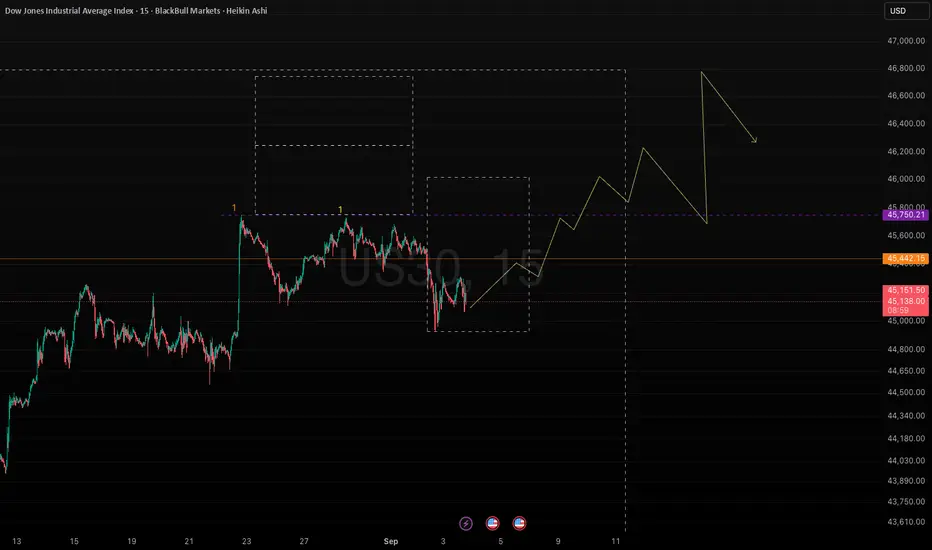
Us30 Trade Set Up Sep 5 2025FX:US30
www.tradingview.com
price is making HH/HL and is testing ATH soon so i will be waiting for a pullback into 15m FVG then a continuation higher

US30 | RetracementAfter a bullish rally a minor retracement was imminent.So it mat take a minor correction before once again going into uptrend.


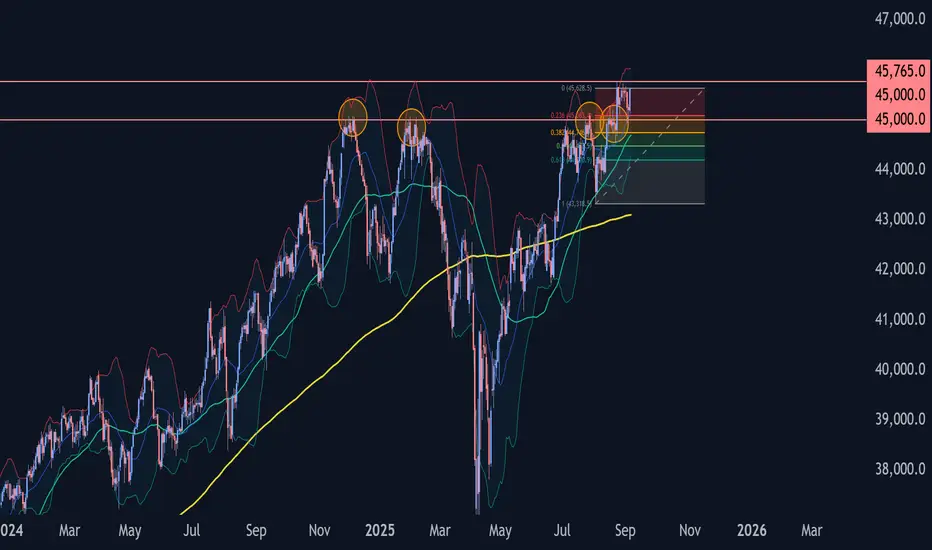
Dow Jones Index Wave Analysis – 4 September 2025- Dow Jones Index reversed from key support level 45000.00
- Likely to rise to resistance level 45765.00
Dow Jones Index recently reversed from the support area between the key support level 45000.00 (former strong resistance, which has been reversing the price from the end of 2024), 20-day moving average and the 38.2% Fibonacci correction of the upward impulse from August.
The upward reversal from this support area stopped the previous short-term correction ii.
Given the strong daily uptrend, Dow Jones Index can be expected to rise to the next resistance level 45765.00 (which reversed the Index in August).
Us30 Trade Set Up Sep 4 2025FX:US30
www.tradingview.com
Price has made a HH but hasnt broken out of it so i want to see price test SSL and either close above with a 1m-2m IFVG to go higher or close under to go down towards PDL

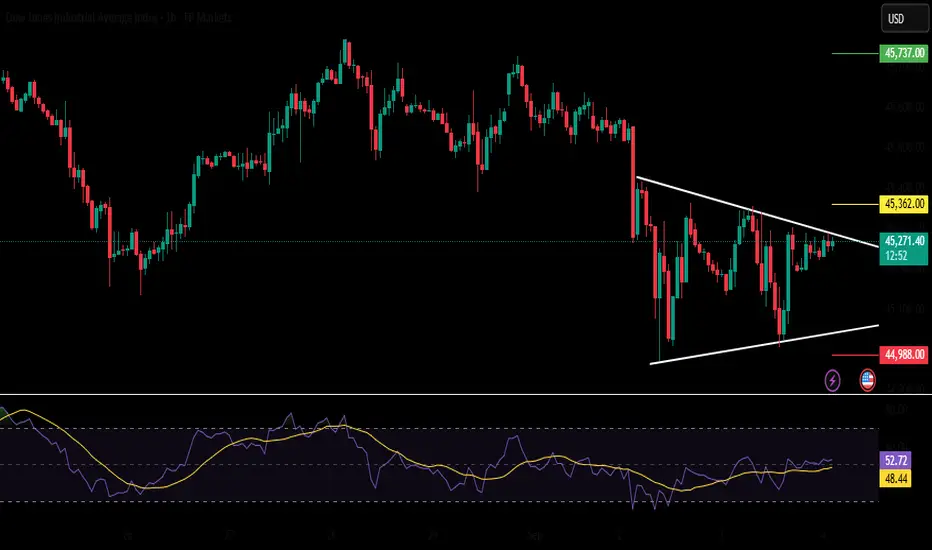
US30 | Rising Wedge PatternUS30 has formed and rising wedge pattern.The breakout of the wedge will once again put the indice into an uptrend.
US30predict for 3 month ago blob blob blbo....
all of my idea is on the chart what the hell i must say?
Us30 longU30 forms a spring on the 4hr.
The general market is bullish on the daily, so underlying conditions are on our side, I can't stress enough the value of that,
So far, setup looks A+

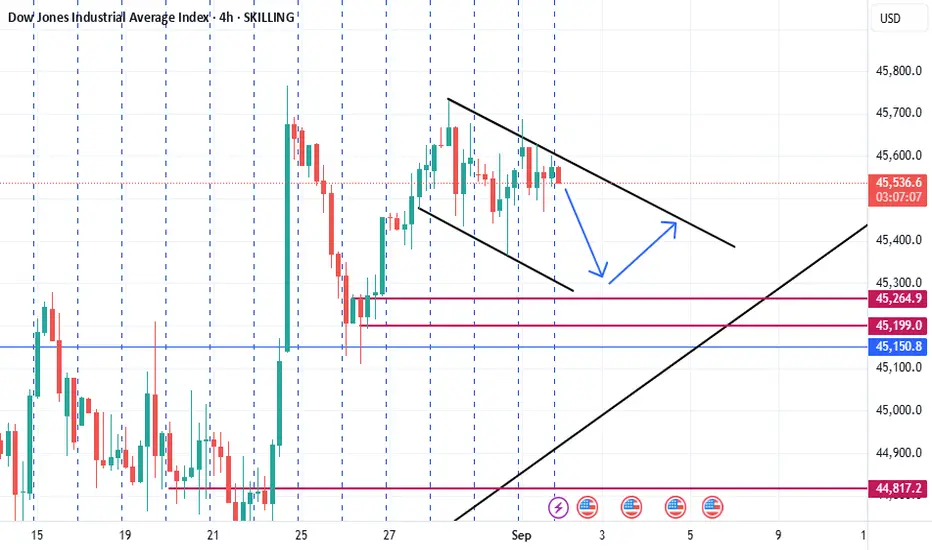
SHORT ON DJ / US30 READINGInner trendline Break and Retest earlier today
Change the Bias on Long for US30 to a Short in our group
We start Selling at the Breakout On H2 timeframe
Entry Price .... 45,600.0
DJ / US30... 45,600.0
S/L ...45,750.00
T/P ...45,989.0
Also looking at a final touch to 44,500.0 LEVEL.
Make sure to Subscribe for more and early trade signal.

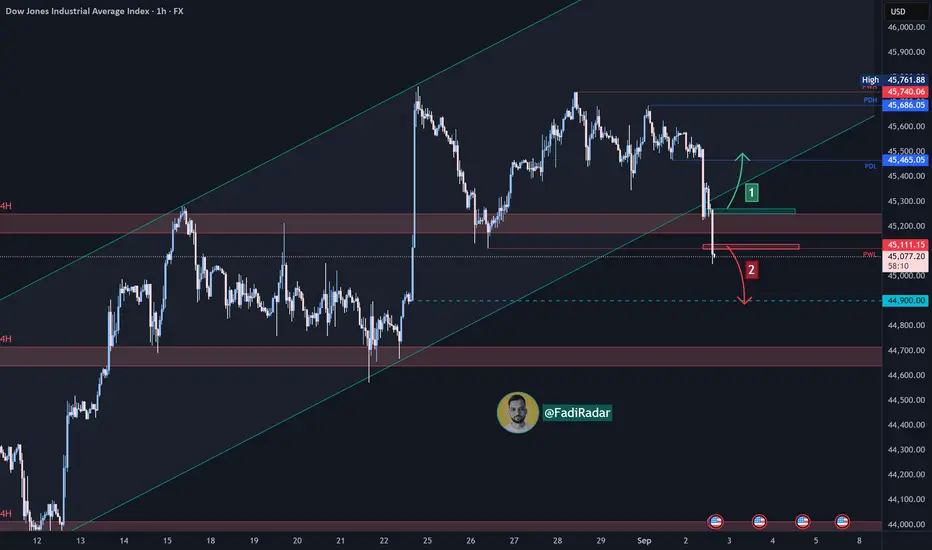
Dow Jones Index Analysis (US30 / Dow Jones)At today’s market open, the Dow Jones index started to decline and is currently testing a key support level at 45,100.
🔺 Bullish Scenario:
If the price rebounds and holds above 45,300, this may drive the index higher toward 45,500.
🔻 Bearish Scenario:
If the price breaks below 45,100 and holds, the index may head to test the 44,700 support area.
US 30 TRADE IDEA 1 SEPTEMBER 2025This week, the US30 is trading within a short-term descending channel, signaling a corrective phase rather than a full reversal, while the higher timeframe structure remains bullish. Price is approaching a key demand zone between 45,200 and 45,150, where liquidity is likely to be swept before a potential continuation higher. From a Smart Money Concepts perspective, this area aligns with a bullish order block that could drive price back toward the 45,600–45,800 region once buyers step in. However, a clean break below 45,000 would invalidate this setup and open room for further downside toward 44,850–44,700. Fundamentally, the focus will be on US labor market data, including jobless claims and the upcoming NFP release, as signs of a cooling labor market may reinforce expectations of Fed rate cuts later in the year, supporting equities. Conversely, stronger-than-expected data or hawkish Fed commentary could pressure the Dow in the short term. Overall, the primary bias is bullish after a liquidity grab around 45,200–45,150, with upside targets near 45,800, but traders should remain cautious of a bearish continuation if 45,000 fails to hold.
Us30 active buy Us30 active buy aiming for +120 pips Target to create the wick on the last daily candle without a wick
aslong as we remain above MAs we are bullish

US30 (Dow Jones) Approaches Key Resistance - Can It Break ThrougThe US30 (Dow Jones Industrial Average) is putting on a show today, pushing higher towards a critical resistance zone.
Key Levels to Watch:
* Resistance: The major ceiling is clearly at ~45,750. The price has tested this level multiple times today and is currently consolidating just below it. A decisive break and close above this could signal a strong bullish continuation.
* Support: Immediate support sits near 45,430-45,490. A break below this zone could see a pullback towards the 45,300 level.
The price action is looking strong, but the real test is happening now at this significant resistance. Volume on a breakout will be key for confirmation.
What's your take?
* Bullish breakout above 45,800?
* Or a rejection for a pullback?
Tags: #US30 #DOWJONES #Trading #Investing #Stocks #Finance #TechnicalAnalysis #PriceAction #Resistance #Support #TradingView
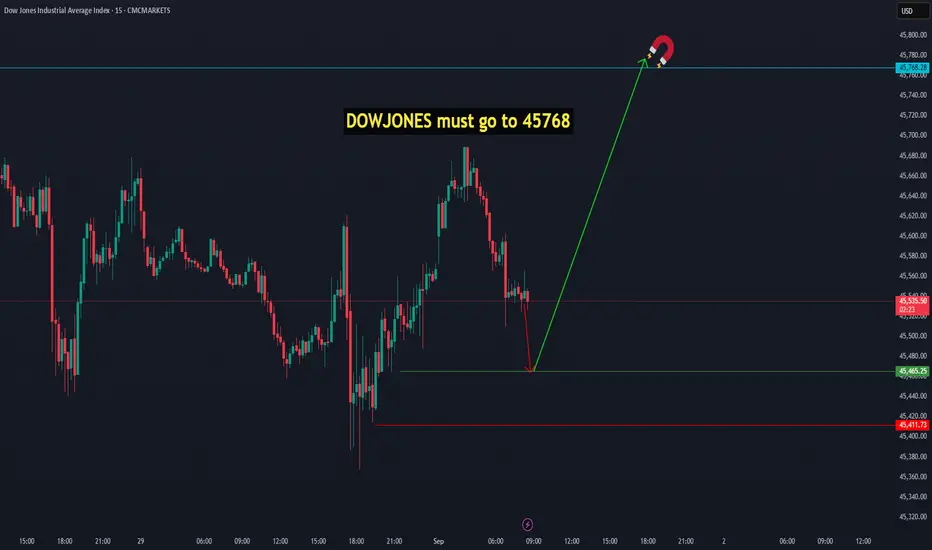
DOWJONES must go to 45768Dow Jones has the potential to start its upward move from the price range of 45,465 to 45,411, targeting 45,768. Even if this support range is broken and price goes lower, the target of 45,768 remains certain and must eventually be reached. CMCMARKETS:US30
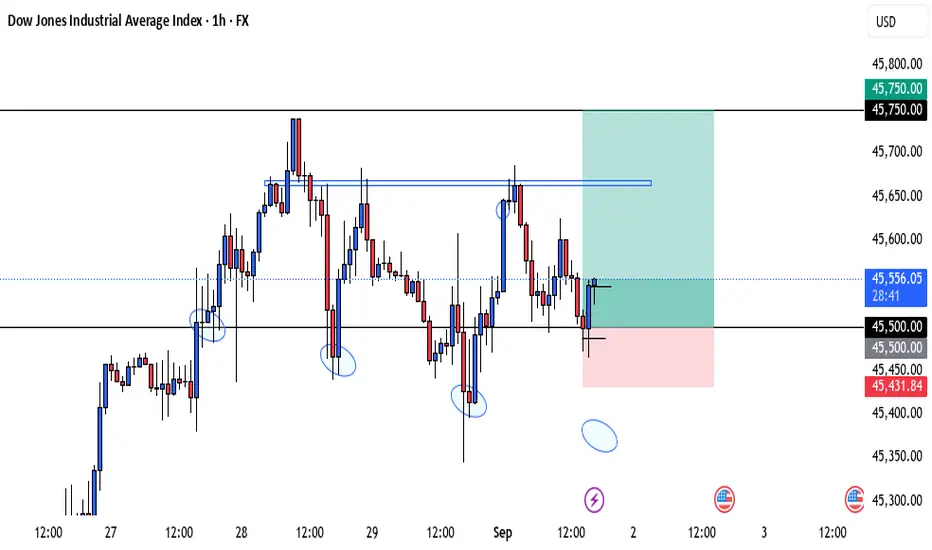
LONG ON DJ / US30 READING Continuation after a short PullBack On H1 timeframe
Another Entry can be done on the current Trend Line to the upside.
After a Breakout to the upside which is still valid for a Buy trade
Entry Price .... 45,500.0
DJ / US30... 45,500.0
S/L ...45,355.00
T/P ...45,700.0
Also looking at a final touch to 46,000.0 LEVEL.
And More
Make sure to like and Subscribe to for more trade ideas in the coming week.
Trade Responsibly.

US30 4HTrading Outlook for Major Currency Pairs and Indices, Especially Gold and Silver, in the Upcoming Week
In this series of analyses, we have reviewed short-term trading perspectives and market outlooks.
As can be seen, each analysis highlights a key support or resistance area near the current price of the asset. The market’s reaction to or break of these levels will determine the subsequent price trend up to the next specified levels.
Important Note: The purpose of these trading outlooks is to identify key price levels and potential market reactions, and the analyses provided should not be considered as trading signals.