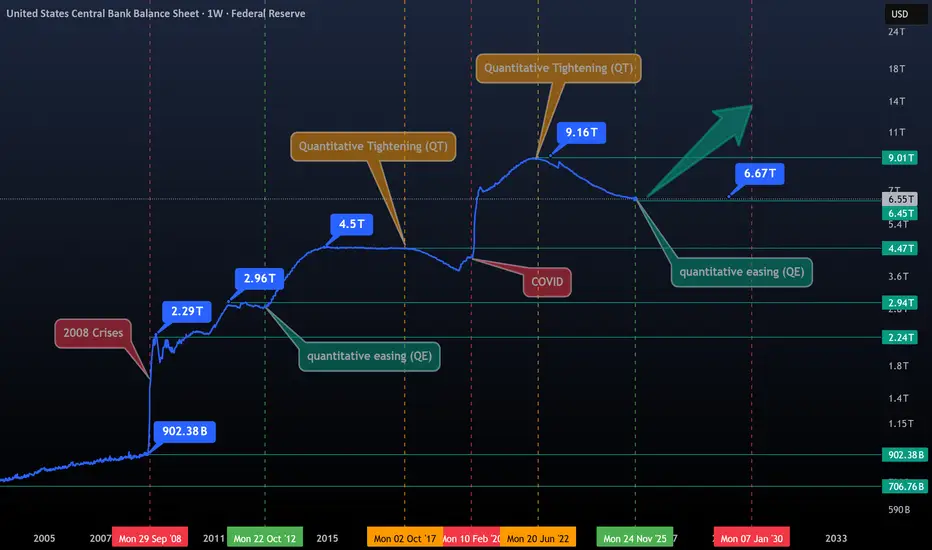
The Era of Gentle Money (QE)- This chart features labels for all key dates, offering a clear and comprehensive overview, including trillions in money creation, QT and QE phases, crises, and flash printing events.
- To truly understand stocks, cryptocurrencies, or precious metals, you first need to understand the monetary system and how it drives inflation.
- The market has been heavily suppressed since June 2022, when the Fed began its Quantitative Tightening (QT), the Fed kicked off a new QE phase on December 1, 2025.
- This is the primary driver behind yesterday’s BTC market surge.
- To complement this, we will soon have a new Fed President, Most likely, they will continue cutting rates, printing more money, and Banks will increase lending, encouraging people to take more risks, which could drive markets higher. Bearish sentiment is premature at this stage.
The heart of truth beats in the printer and in the river of liquidity !
Happy Tr4Ding !
Market insights
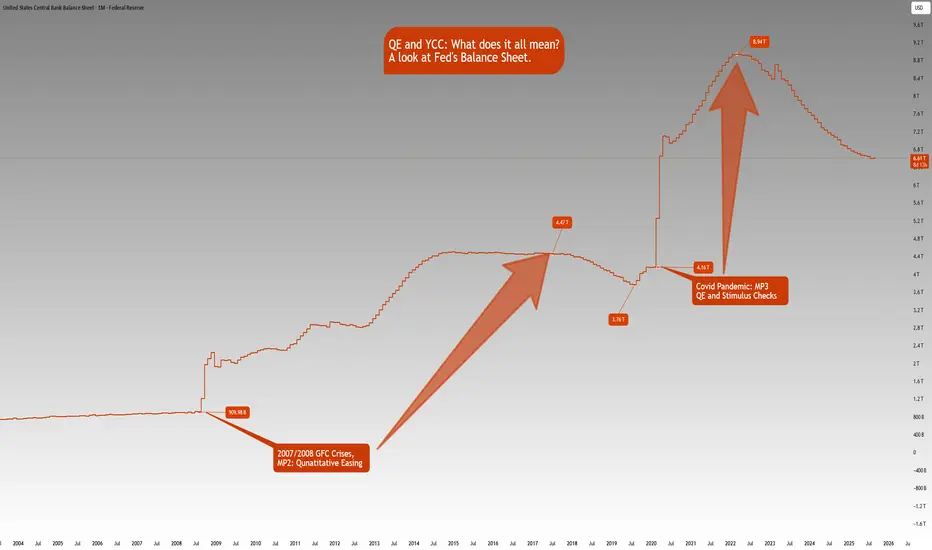
QE and YCC: What does it all mean?ECONOMICS:USCBBS
CBOT:ZB1! CBOT:ZN1! CME_MINI:NQ1!
There is growing market speculation that the Fed may tolerate inflation above 2% for longer, consistent with its Average Inflation Targeting (AIT) framework introduced in 2020.
This also implies that real rates i.e., nominal rates minus inflation are likely to fall significantly. Given this, we anticipate gold to continue trending higher as the U.S. dollar's purchasing power erodes with mounting debt, persistently higher inflation, and falling real yields.
What is QE?
Quantitative Easing (QE) refers to the Fed injecting liquidity into financial markets by purchasing large quantities of assets such as Mortgage-Backed Securities (MBS) and U.S. Treasuries, especially during periods of economic stress like the Global Financial Crisis (2007–2008) and the COVID-19 downturn.
How Does QE Work?
Asset Purchases: The Fed buys large volumes of Treasuries and MBS from financial institutions.
Balance Sheet Expansion: These purchases expand the Fed's balance sheet (now hovering near $6.6 trillion, per FRED).
Increased Liquidity: Banks receive excess reserves in exchange, increasing system-wide liquidity.
Lower Interest Rates: Demand for bonds pushes prices higher and yields lower.
Economic Stimulus: Lower borrowing costs promote credit creation, investment, and consumer spending.
However, a key drawback of QE is asset price inflation. As seen between the GFC and the COVID-19 pandemic, low rates and excess liquidity drove significant appreciation in equities, housing, and other financial assets, even while consumer inflation remained near target.
QE vs. Stimulus Checks
If traditional interest rate policy is Monetary Policy 1 (MP1), then QE is MP2. Stimulus checks, or government handouts, fall under MP, a fusion of monetary and fiscal policy.
While QE primarily injects liquidity into financial institutions, stimulus checks inject purchasing power directly into households. This approach where the Treasury issues debt and the Fed purchases that debt, stimulates demand for real goods and services. We saw this during the post-COVID recovery, which brought a sharp rebound in consumer activity but also a surge in inflation, reaching a peak of 9.1% in June 2022 (CPI YoY).
QE impacts Asset Price Inflation
Stimulus Checks impact Goods & Services Inflation
What is YCC? (Yield Curve Control)
Yield Curve Control (YCC) is a policy whereby the central bank buys government debt across various maturities to control yields not just at the short end (via rates), but across the entire yield curve.
A prime example is the Bank of Japan, which has used YCC since 2016 to anchor 10-year JGB yields near zero. The Fed has not formally adopted YCC, but market participants believe it may lean in that direction in the future especially during crises where long-end rates rise undesirably. Mounting US debt and rising long end yields may prompt the Fed to step in and adopt YCC like BoJ has done previously.
Front-End Control: Managed via policy rates
Long-End Control: Central bank buys 5Y, 10Y, 20Y, 30Y Treasuries to anchor yields
Potential Risks of YCC:
Credibility Risk: If inflation rises while the central bank suppresses yields, it may lose market trust.
Currency Pressure: Artificially low yields may trigger speculative pressure on the currency (as seen with the yen under BoJ YCC).
We’ve kept this concise and digestible for now, but there’s more to unpack—especially on the long-term implications of coordinated monetary-fiscal policy (MP3), debt sustainability, and central bank credibility.
The Fed’s balance sheet chart shows how Fed’s balance sheet has increased:
Aug 1, 2008: $909.98B
Jul 1, 2017: $4.47T
Aug 1, 2019: $3.76T
Feb 1, 2020: $4.16T
Mar 1, 2022: $8.94T
Aug 1, 2025: $6.61T
Note that this is not just a US phenomenon. It is a world wide phenomena looking at many of the developed and emerging markets. The Debt to GDP ratios are increasing, Central Banks balance sheets are rising in tandem with rising government debt.
With the rate cutting cycle starting, it is a matter of time that we also see QE restarting.
If you’d like us to dive deeper into any of these topics in future educational blogs, let us know. We're happy to build on this foundation with more insights.
Federal Reserve Balance sheet vs SPXFed Balance sheet vs SPX
Its amazing to see the S&P500 breaking away from a long term correlation.
The Fed Balance sheet has shrunk from $8.97T to $6.6T but the markets have not been fazed.
Historically reductions in the balance sheet have resulted in markets selling off.
This time we are observing the markets trending higher.
Where is the liquidity coming from?
Is this time different?
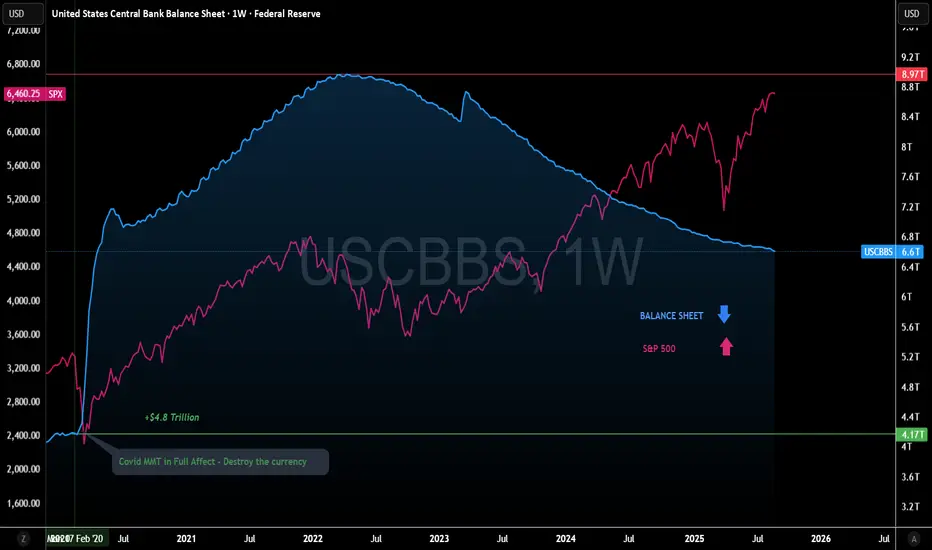
QE USCBBSWhen it rises up, it is a good idea to buy store of value assets, as this is a sign of depreciation of the $.
*DYOR*

The Printing Company- how it works :
- Imagine you can create apples, and that you are the only one in the world able to do that.
- So if you create 100 apples, you will make them more rare and unique, so maybe you can sell them for 10$ each one.
- So now imagine you create 10,000,000,000 apples, you will have more apples than peoples need to eat, so you will have to sell your apples 0.0001$
- Anyway you don't really care about your apples price goes down because, you can create how many apples as you want, and the world population is growing.
- This is exactly the same for the US Dollar :
-- Less they print paper, less life is expensive, because we get some kind of USD rarefaction.
-- More they print papers more the dollars flood the world, it makes it weak, then you need more papers to buy your home, a new car or food.
-- Flooding the world with USD make everyone dependent on USD.
- So in graph you can see how many dollars they created post crises 2007 and for Pandemic Covid in 2020.
- So what is the situation right now :
-- Basically they stopped to print ( that's the main reason DXY Pushed up. "Dollar rarefaction" ) and world economy crashed ( Forex, Stocks , Cryptos ) .
-- In time they will have no choice to print again because their system is based on a greedy model.
- What you see is the just top of the iceberg, the Fed is a mosquito if you compare it to the BIS ( Bank for International Settlements).
- Actually controlling the flux of the creation of the dollar is just controlling the world system, it's a kind of tax form that you don't see, but you pay it much more than you think with inflation.
- USD paper money system will end sooner or later for a new monetary model called CDBC.
- it will be worst than you think as they will control everyone having a phone on their hand.
- The Only way to to counter them is to buy Bitcoin because of his real disinflationary mechanic.
- There's no other way to counter the system right now.
Happy Tr4Ding !

Global Net LiquidityGlobal net liquidity is described by Fed Balance Sheet - RRP - TGA + BoJ Balance Sheet + PBOC Balance Sheet + ECB Balance Sheet

Stocks Always Go Up...Right?Gather around....I have short story to tell
Once upon a time, in a town called Sweetville, there lived a child named Lily, whose love for cookies knew no bounds. From the moment she took her first bite, a magical spell was cast upon her taste buds, and she became powerless to resist the sweet temptation.
Lily's days revolved around cookies. She couldn't stop eating them—chocolate chip, sugar, oatmeal raisin—they all captivated her senses. The more she indulged, the deeper she fell into the clutches of her insatiable cravings.
As Lily grew older, her addiction to cookies became more pronounced. She spent every penny on her sweet obsession, neglecting her chores, studies, and even her friendships. The town's bakery thrived, fueling her addiction and turning her into their most loyal customer.
But as Lily's cookie consumption skyrocketed, the economy of Sweetville began to crumble. People's focus shifted from productivity and innovation to indulgence and immediate gratification. Businesses suffered as resources were drained to feed the endless demand for cookies. Jobs were lost, and families struggled to make ends meet.
Sweetville's once-thriving economy turned into a ghost town, its streets filled with empty storefronts and shattered dreams. Lily's uncontrolled cookie consumption had inadvertently become a symbol of society's unchecked greed and excess.
The economy crashing was a wake-up call for Sweetville. People realized that balance and prudence were essential for a stable and prosperous community.

Central Bank Balance Sheet vs NasdaqUntil the job market forces the Fed's hand, their balance sheet can keep on shrinking (letting Nasdaq to keep out performing it).
Using ratio charts (instead of overlaid data series) works as a Rosetta stone. Helps see the underlying macro economics is play.
#fed #fomc #nasdaq

🔥 Is The Bitcoin Halving Causing Bull Markets? New Theory!The classical Bitcoin theory about halvings is that they "cause" bull-markets because the supply mined gets halved, leading to a negative supply shock and therefore increasing the value per Bitcoin.
This is not a surprising theory since it makes a lot of sense and has worked in the past. But, is the halving really that important for the Bitcoin price?
I've plotted the balance sheets of the largest central banks in white. If this line goes up, it indicates an expansion of the balance sheet (Quantitative Easing / QE), which can roughly be interpreted as printing money. It appears that Bitcoin bull- and bear-markets are highly correlated with central banks expanding their balance sheets. White line goes up, BTC goes up, white line goes down (or sideways) BTC goes down.
I've marked two previous occurrences where the central banks started QE in purple. Bitcoin arguably started the bull-market from those points, and not once the halving (yellow) took place.
From this chart we can conclude that the Central Banks are a decisive factor in the start and end of Bitcoin bull markets. Sure, the halving is a highly anticipated event among retail investors and manages to revive the interest into crypto, but I'd argue that QE (= a better investing climate) is the main reason why Bitcoin goes up and down in cycles.
In other words, we can have a BTC bull-market during a period of QE without the halving taking place. We can't have a bull-market after the halving without QE.
If you enjoyed this analysis, please give it a like. Share your thoughts below 🙏

USD Liquidity vs S&P vs BTCThis cart shows how USD liquidity leads assets such as Bitcoin and stock market.

USD Liquidity vs S&P vs BTC - Liquidity Leads AssetsPlotting USD Liquidity for the past 5 years versus the S&P and Bitcoin. Made twitter-famous by Raoul Pal and Arthur Hayes. As we can see in the chart, liquidity is tightly correlated with the S&P and also drives Bitcoin cycles.
Liquidity looks to lead price movements in both assets classes.
Question for the community: How can we best forecast moves in USD liquidity?

Arthur Hayes USD Liquidity IndexFormula constructed based on Arthur Hayes post, 'Teach Me Daddy'.
USD Liquidity Conditions Index = The Fed’s Balance Sheet — NY Fed Total Amount of Accepted Reverse Repo Bids — US Treasury General Account Balance Held at NY Fed
USD Liquidity — Number Go Up:
Fed Balance Sheet — Increases
RRP Balances — Decreases
TGA — Decreases
USD Liquidity — Number Go Down:
Fed Balance Sheet — Decreases
RRP Balances — Increases
TGA — Increases

Federal Reserve Balance SheetBe careful, uptrend of this symbol (FED balance sheet) isn't a Quantitative easing ...!
Hight risk markets will crash as soon as possible.📉

an update on central bank liquidities
central bank balance sheets
central bank rates
central bank - mandate - inflation
central bank - mandate - employment

BTC & USD Liquidity Index USD Liquidity Conditions Index = The Fed’s Balance Sheet — NY Fed Total Amount of Accepted Reverse Repo Bids — US Treasury General Account Balance Held at NY Fed
source: blog.bitmex.com

DXY - USCBBS - CPI - PMI - CNCBBS - JPCBBS - ITCBBS - EURUSDFOMC FED Net Liquidity Central Bank Balance Sheets:
United States
China
Japan
Italy
DXY
EURUSD
CPI
PMI

FED Balance Sheet - Ex-Shadow Operations / Ex- FASB 56Run-Off...
The only thing running is Bids for MBS and USTs.
After an aggressive May 25th, $51 Sell ahead of
the June 15th Taper was stopped dead in its tracks.
____________________________________________
Imagine swimming in the middle of the vast Pacific Ocean.
Bumping into Flotsom and Jetsom every so often.
It's lonely out there...
Nowhere to run.
Paddle?
You'd need a Lifeboat.
It Sunk.

FED Balance sheet and Nasdaq ComparisonNASDAQ:QQQ
As you can see on the chart, FED balance sheet should be adjusted, as you it just started to go down, but QQQ already is 20% down from the top.
so obviously the bear market just started. and I expect more than 50% now. the most powerful and longest bear market of all time.
*This is my idea and could be wrong 100%

Liquidity and NASDAQ?Here is a chart comparing the Fed's balance sheet vs. the NASDAQ price since 2003. It seems like NASDAQ chases the balance sheet most times, but gets scared out during tightening (2018-2019), and now. The FED came to save the day in 2019, but will they now? The reaction here seems to price in what the FED balance sheet would be after tightening.


Relation between price of gold and FED's balance sheet.Seems to exists a relation between those two. In the long run, gold price seems to follow the expansion movements of the FED. In 08, prior to the GFC, the size of the BS was 800 times bigger than the price of a gold ounce. In 2012, it was 1,800 times bigger than the ounce of gold.
In both cases, the FED's BS was bigger than the ounce of gold by a factor that equals the price of that ounce.
After a growth in the BS size, it seems that it takes some time for gold to reach the value that matches the relation described above. It seems to require some time of keeping a steady not growing BS to reach it. In 2019, the FED failed in its attempt to reduce the BS, so gold wouldn't reach the desired value.
Would the FED be able to taper now? Would we see the ounce of gold at $3,600?
