EGLD is Getting Ready For a RallyEGLD is Getting Ready For a Rally
BTC reached a new all-time high over the weekend. Chances are very high that it could be followed by altcoins as well.
On the other hand, most Altcoins are positioned for another one.
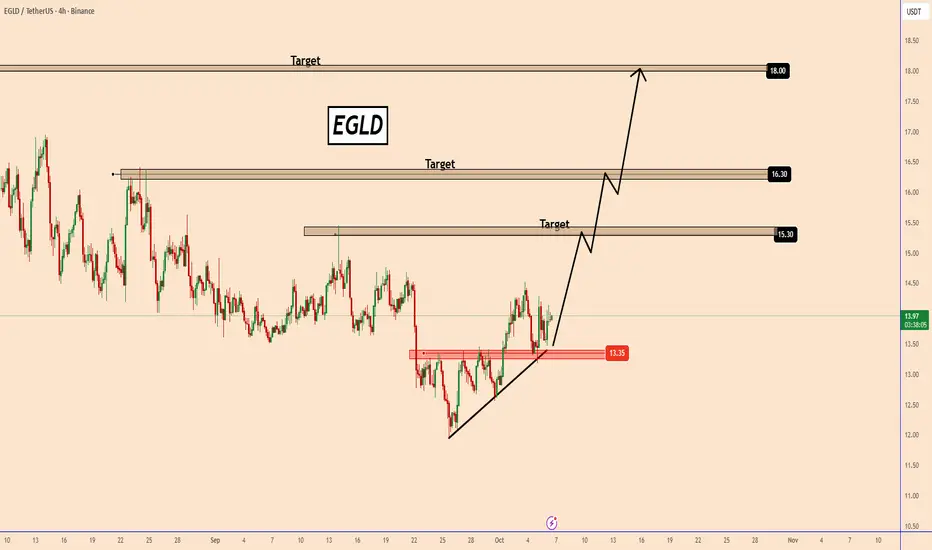
EGLD has a lot of potential. The price has already broken out of a pattern wher
EGLD – Third Touch at $12 Support Could Ignite a Major ReversalEGLD has been on my radar for quite some time...
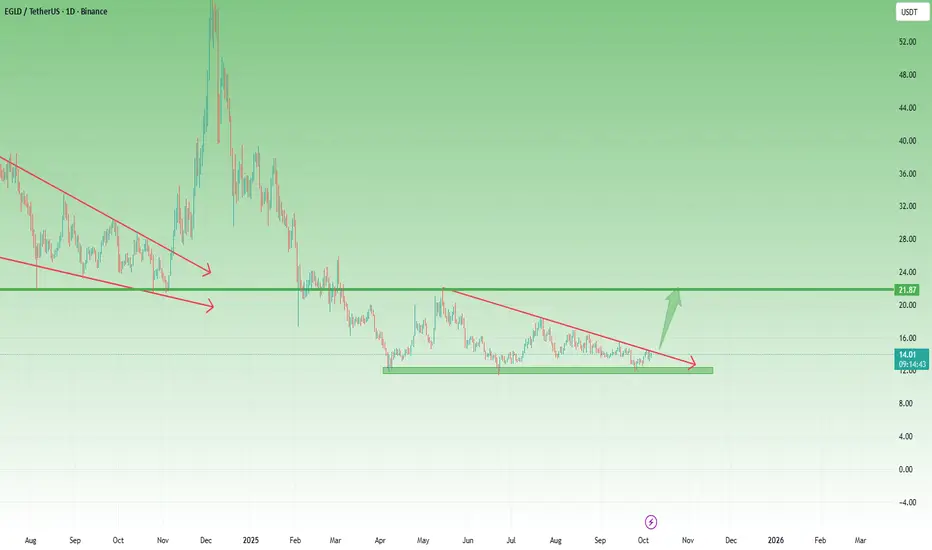
After forming a major low in April and rallying back toward the $22 zone, the coin pulled back again — effectively confirming that level as strong support.
By the end of September, price revisited the $12 area for the third time, and once again buyers
EGLDUSDT UPDATE#EGLD
UPDATE
EGLD Technical Setup
Pattern: Bullish falling wedge pattern
Current Price: $27.60
Target Price: $43.20
Target % Gain: 56.52%
CRYPTOCAP:EGLD is breaking out of a falling wedge pattern on the 1D timeframe. Current price is $27.60 with a target near $43.20, showing about 56% potential

EGLDUSDT 1D#EGLD is trading within a descending triangle on the daily chart. In case of a breakout above the triangle resistance and the daily SMA50, the potential targets are:
🎯 $15.20
🎯 $16.19
🎯 $17.17
🎯 $18.58
🎯 $20.37
⚠️ Always remember to use a tight stop-loss and maintain proper risk management.

EGLD/USDT – Major Bullish Reversal in Play🚀 Technical Analysis Summary:
EGLD has successfully completed a textbook inverse head and shoulders pattern, signaling a strong bullish reversal after an extended downtrend. The neckline breakout is imminent and could ignite a significant upside move.
📈 Accumulation Zone:
Price has consolidated wit

EGOLD Consolidates at Critical Swing Low Around $11.47EGOLD is consolidating at support, with traders closely monitoring the $11.47 level. A sweep here could fuel bullish expansion toward $20, while a breakdown risks further correction.
Introduction: EGOLD’s prolonged consolidation has placed the spotlight on its key swing low at $11.47. How price rea

egldusdtThe EGLD currency is in a triangle pattern. I think the targets are clear with an upward breakout.

EGLD has formed a bullish double bottom📊 CRYPTOCAP:EGLD Market Update
CRYPTOCAP:EGLD has formed a bullish double bottom 📈
👉 If it breaks out the red resistance zone 🔴, the first target will be the green line level 🎯

EGLD/USDT — Descending Triangle at a Critical Demand Zone🔎 Overview
The EGLD/USDT (1D, Binance) chart is currently forming a classic descending triangle pattern:
Lower Highs are pressing price downward along the yellow trendline.
A strong horizontal demand zone at 11.40 – 13.50 USDT has been repeatedly tested as support.
Price is compressing toward th

eGold Consolidates at Key Support, Eyes Rally Toward $20eGold (EGLD) continues to respect a critical support zone aligned with the 0.618 Fibonacci retracement and the value area low. Holding above $14.22 could trigger a bullish rotation toward $20.
Introduction:
EGLD’s recent price action has highlighted the importance of its current support region, wh

See all ideas
Summarizing what the indicators are suggesting.
Oscillators
Neutral
SellBuy
Strong sellStrong buy
Strong sellSellNeutralBuyStrong buy
Oscillators
Neutral
SellBuy
Strong sellStrong buy
Strong sellSellNeutralBuyStrong buy
Summary
Neutral
SellBuy
Strong sellStrong buy
Strong sellSellNeutralBuyStrong buy
Summary
Neutral
SellBuy
Strong sellStrong buy
Strong sellSellNeutralBuyStrong buy
Summary
Neutral
SellBuy
Strong sellStrong buy
Strong sellSellNeutralBuyStrong buy
Moving Averages
Neutral
SellBuy
Strong sellStrong buy
Strong sellSellNeutralBuyStrong buy
Moving Averages
Neutral
SellBuy
Strong sellStrong buy
Strong sellSellNeutralBuyStrong buy
Displays a symbol's price movements over previous years to identify recurring trends.
Curated watchlists where EGLDUSDT.P is featured.

Proof of Stake: Seeking validation?
26 No. of Symbols

Smart contracts: Make the smart decision
36 No. of Symbols
See all sparks