Synthetix (SNX) SNXUSD 3d - 1 week mid/long term SNX rank: 192
SNX coin previously showed strong movements and was at the center of hype, with a significant rise from the bottom to the top.
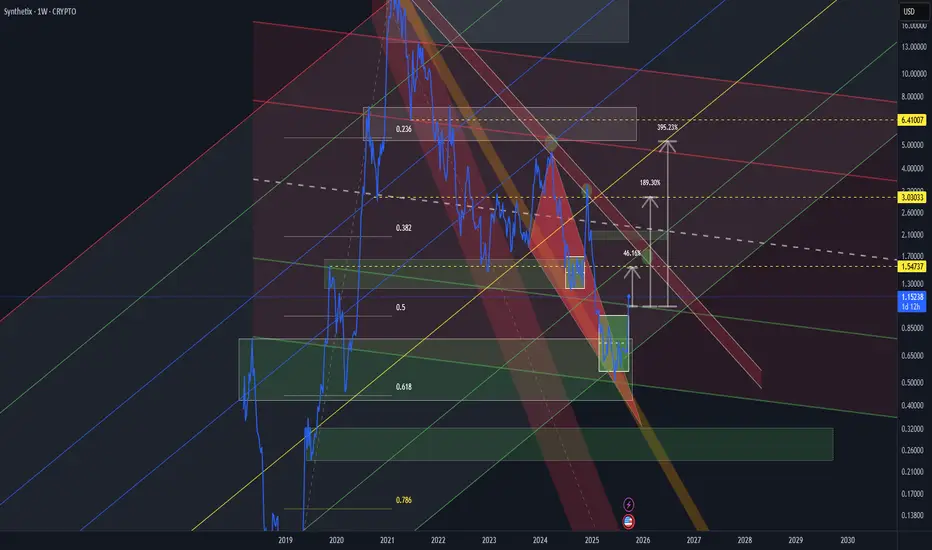
If we stretch the Fibonacci retracement from the low to the high, we can see that the price came to the golden level 0.618, where the new accumulation zone
Key stats
Related pairs
$SNXUSD - some juicy targetsCOINBASE:SNXUSD looks great for a long. Locked in from $0.57. Targets provided good luck to all traders.

Bearish Pressure with Key Resistance at $1.00
The price is trading in the lower half of the Bollinger Bands, suggesting weakness.
Support Levels: Around $0.85 - $0.90 (Recent lows)
Resistance Levels: Around $1.00 - $1.10 (Bollinger mid-band & psychological level)
Bearish Bias: The price remains below the moving average and in the lower Bol

SNXUSDT BULISH I believe this coin may not experience a sharp bullish movement right now. The targets are achievable in the midterm, but if the candle closes below the stop loss, the idea will be considered invalid.
Note: My ideas are not intended for any type of scalping or scalpers!
Here are my other ideas:

Technical Analysis of Synthetix Network Token (SNX/USD): Key LevThis analysis examines the price movement of Synthetix Network Token (SNX) on the weekly timeframe. The structure of the waves and key trendlines have been identified to help traders determine entry and exit points.
Key Highlights of the Analysis:
Strong Support Zone ($1.75–$1.429):
The price

crypto bull's hedge pointclose below = waterfall
countertrend trade
whole market bull
this one a weakling
a good hedge point for your other crypto longs

Synthetix - The Mother of all comebacksSynthetix Graph Seems really nice for this bull. Major Updates coming. They are planning to displace CEXs with their new Infininex Mobile app. Great Bet for this cycle.

SNX Possible Power of three. (most complete description)I think it brewing a long term power of three. As the momentum narrative is about solana and shitcoins, and as snx is bellow 8 monthly EMA, I think that it's not the best time to take it. When eth/btc reverses, and a big volume spike a good green candle, so could be a good time to entry in it.
Rem


SNX FRVP analysisUsing the fixed range volume profile tool over the last two days, we can see we have a POC at ~1.628. The last rally from approximately the 5th-11th resulted in a POC at around 1.511 which we hovered around dipping slightly below before starting the next rally up. If we follow the same trend this we

See all ideas
Displays a symbol's price movements over previous years to identify recurring trends.
Curated watchlists where SNXUSD is featured.

Crypto tokens: Chips and dips
24 No. of Symbols

Decentralized Exchange Tokens: Risky business?
22 No. of Symbols

DeFi Tokens: Finance 2.0
24 No. of Symbols

Derivatives Tokens: De-Fi does it again
16 No. of Symbols

ETH-based crypto: Find your utility
38 No. of Symbols

Exchange Based Tokens: Follow the leader
25 No. of Symbols
See all sparks
Frequently Asked Questions
Synthetix Network Token (SNX) reached its highest price on Sep 16, 2021 — it amounted to 15.839 USD. Find more insights on the SNX price chart.
See the list of crypto gainers and choose what best fits your strategy.
See the list of crypto gainers and choose what best fits your strategy.
Synthetix Network Token (SNX) reached the lowest price of 0.453 USD on Jun 22, 2025. View more Synthetix Network Token dynamics on the price chart.
See the list of crypto losers to find unexpected opportunities.
See the list of crypto losers to find unexpected opportunities.
The safest choice when buying SNX is to go to a well-known crypto exchange. Some of the popular names are Binance, Coinbase, Kraken. But you'll have to find a reliable broker and create an account first. You can trade SNX right from TradingView charts — just choose a broker and connect to your account.
You can discuss Synthetix Network Token (SNX) with other users in our public chats, Minds or in the comments to Ideas.