WED Moving Average NO FOMCHere is the Wednesday Moving Average updated. No FOMC Wednesday days. But honestly, I need to look back and factor out any speeches and minute pubs, because that 2PM candle still looks fishy to me. I'd be watchful of that 2:00 five minute interval, and be super twitchy on my keyboard right at 1:59:59 PM.
Happy Trading!!
Trade ideas

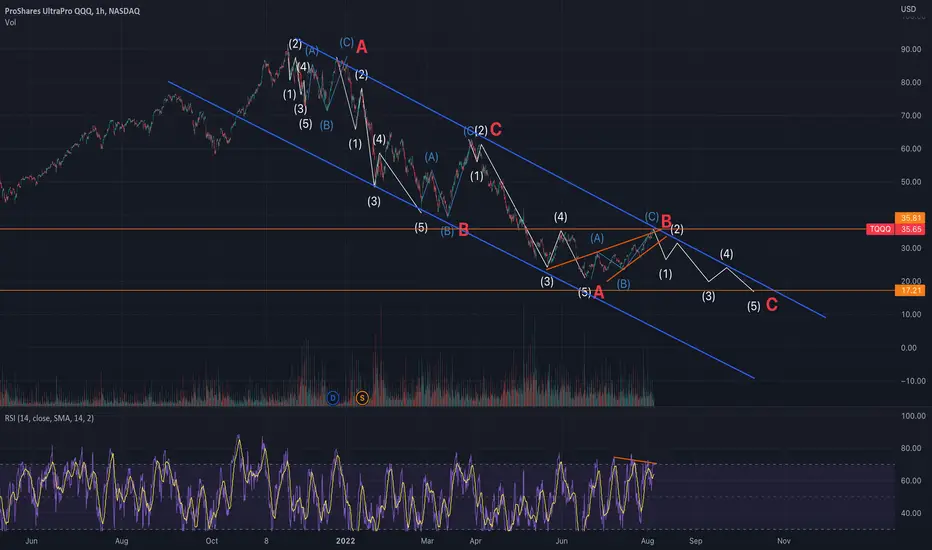
TQQQ bullish scenario This is the bullish scenario for TQQQ i think we will hit the support at A but a reversal www.tradingview.com could take place at that point

TQQQ updated TA Preparing for next week.
As yall know I sold my SQQQ position at $19.60 support range, I'm looking for another short position.
This is what I'm seeing
1. Overall we are still in downtrend so I'm only taking short positions
2. We broke 2 previous supports we are currently retesting the $18.40 - 18.20 range, with the bigger resistance being the $19.60-$19.20 range
3. Currently we are bouncing off support and looking to break our first resistance, if this done we might be headed towards the $19.20 range
4. If you look at the adx its not responding to the current uptrend which tells us this is just a pullback from over selling pressure
5. The MFI is not oversold yet which means we could see a small continuation upward.
My entry requirements, I would like to see the MFI go over bought and the adx continue to trend down if this happens and I get a negative macd crossover ill enter my short position. As this happens the TSV bars should be getting smaller with a 0 line crossover.
thanks,
God bless

TQQQ after CPI I don't know yalls current situation but right now I'm sitting on cash.
In order for you to become a good trader you have to lose, when you lose you learn a lesson and you turn those lessons into a set of principles that you follow. Follow them.
So this CPI data release could have thrown a wrench in our original Elliot wave.. I said COULD..
From looking at the chart i created another uptrend channel, we buy in the green sell at the red
We talked about the potential of the wave 1 and 2 in the last post and whatever happened today will set the new Elliot wave count and it did
Currently their is no reason to get overly bullish so for now Big picture we are sticking with the original wave count, but there are sub wave counts we can trade.
Next trade I'm looking for is the wave 4 pullback, this one will be a little risk but again I'm following my rules if doesn't work out I'm good with it.
Currently the ADX and MFI are both respecting the uptrend, but watch the MFI closely it might create a bearish divergence that will take us to the wave 4
TSV matches prices action
I do apologize for how busy the chart is
Please if yall have any questions let me know I would love to hear them
Thanks God bless

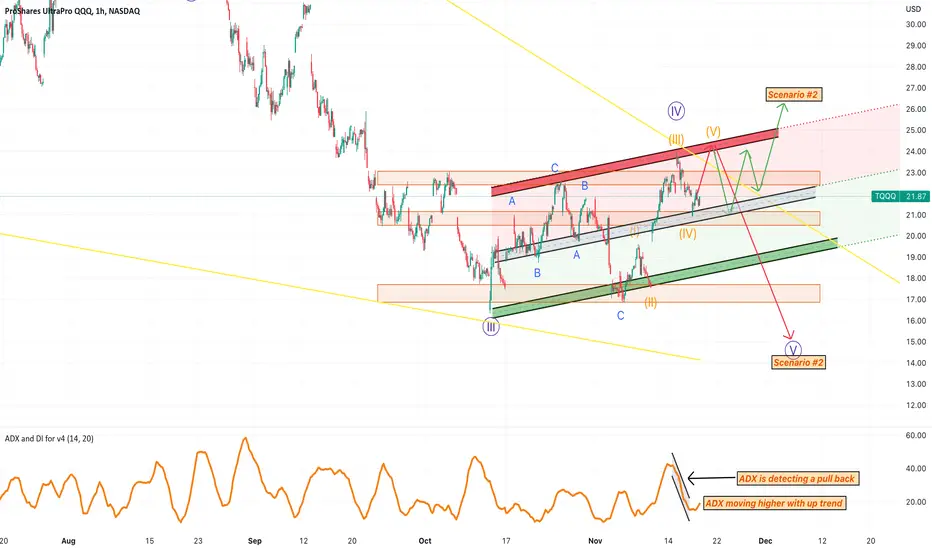
TQQQ at close We hit the wave 4 target that we talked about in the last post... where are we going???????? honestly i have no clue but this is what the chart is telling me....
We are in a larger time frame pull back..
Y'all already know the elliott wave count it's pretty much stayed the same the last couple of days...
Right now i see wave 5 coming.. ADX is detecting a weak downtrend which tells me that we are in a pull back not a new impulse wave.. that could change but as for now thats what im seeing..
Scenario #2 would be what everyone wants.. the bull market to return.. yes inflation reports have been positive but a bullish market, low unemployment and booming economy is not what the fed wants. Regardless we are gonna make money in a bull or bear so it really doesn't matter.
Thank yall
God bless
TQQQ update mid terms Well we talked about hitting this level in our last post and the target was hit, again I'm only looking for short positions. (Below 200 ema)
Currently we are overbought on the MFI and if u look back this has marked a good opportunity to short the market.
TSV started showing bearish divergence
ADX validated the trend. Which is bullish but still a little early to confirm
Currently I'm seeing a bear flag unfolding and I have the target on the chart.
Bullish scenario here is that we created a wave 1 and 2 and target being the $24 range.
I don't see this playing out unless the cpi data comes in better than expected on Thursday.
I also listed the sub wave count for this last leg down
Do yall like the daily updated or should I just update the previous ones?
If yall have a different opinion I would love to hear it
thanks
god bless

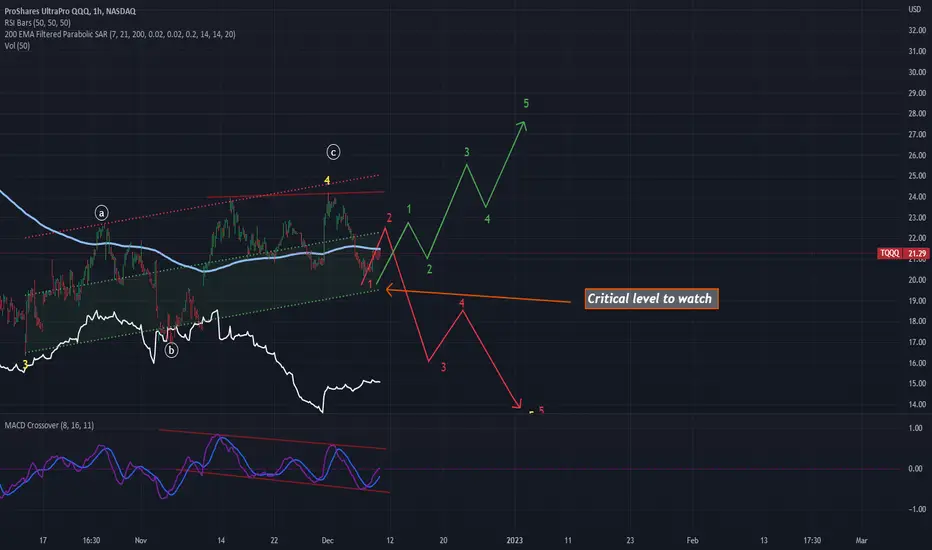
TQQQ These next moves will be dictated by the PPI report,
If better than expected we have the Green scenario.
If its worse than expected we have the red scenario.
Elliot wave: Nothing has changed, I believe we are still in a wave 4 correction, with low volume. We hit the 38% fib level which is a very common fib level for wave 4.
We are showing signs of bearish divergence on the macd which could play out tomorrow or next week.
We are officially trading below the 200 ema.
If we break the ascending trend line it is highly likely we see new lows
Good luck yall
God bless
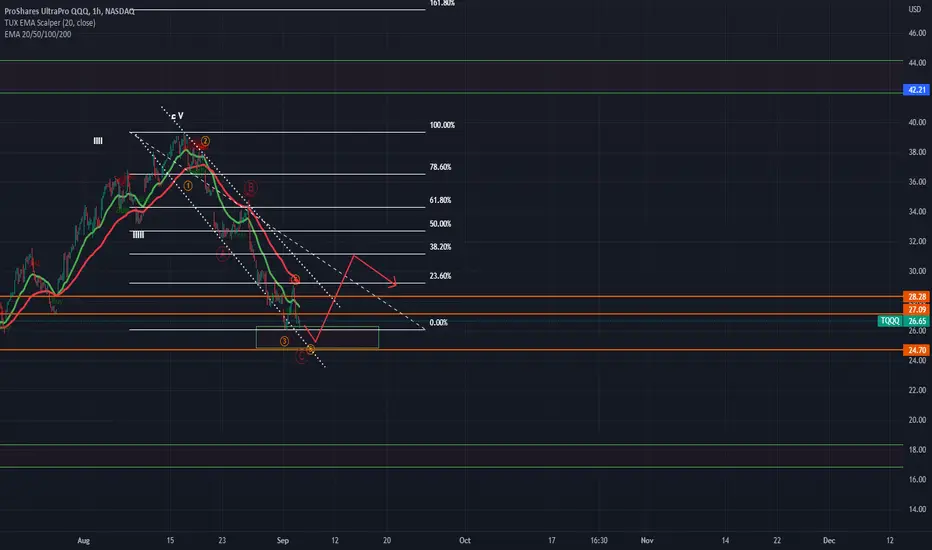
qqq Elliot wave........history tells us NOV-DEC BULLS RULEwww.tradingview.com
Forming a wedge just like we did in the past, we broke out and our target is $21.5 to $24.63 which is exactly 38% fib extension (wave 4),
also if your into chart patterns we take the largest part of the wedge and we use it as a guide to take profit, it correlates with wave 4

TQQQ analysis for shorting Current analysis of TQQQ. ...Of course, you could also just buy SQQQ if you're wanting (or needing) to be long

Selling rallies Triple Qs (TQQQ)This looks like a simple three legged counter trend (bear market) rally from the lows in TQQQ.
Prefer to sell against last week's highs as a stop level ultimately looking for new lows over coming weeks.

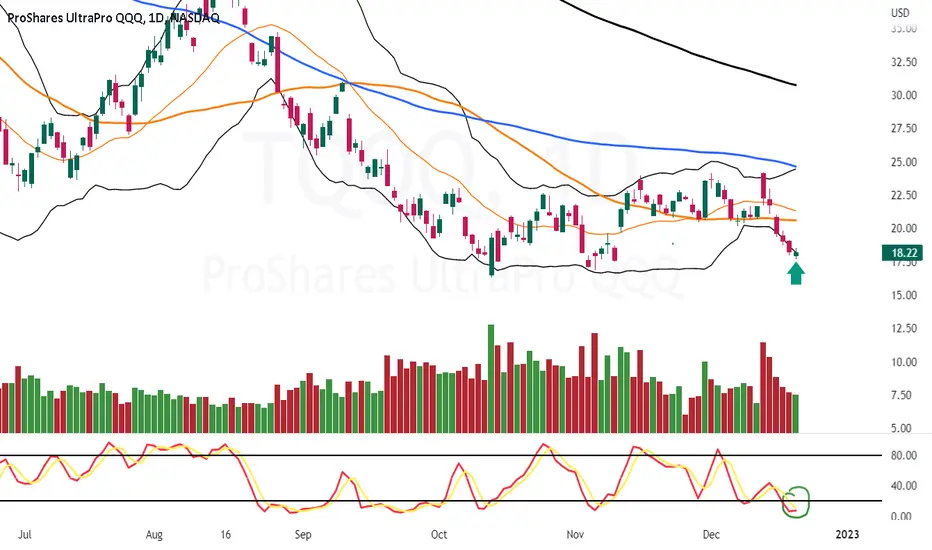
TQQQ Long 18.03Long TQQQ 18.03
Target 21 the 50 day ma
daily stoch on bottom turning but have not cross
up through I am early
$TQQQ - V shaped recovery-As of the last 7 days, TQQQ shorts are capitulating whilst SPY shorts are increasing. The effect is a sideways crab market.
-2 months before, SPY shorts capitulated and instead built a massive short position in TQQQ never seen before in size. It looks like the switch over from TQQQ to SPY is currently in progress. As for the prediction of TQQQ going to $24.2 whilst also calling a crab market, that's just a hunch.
TLDR: This is more of a personal prediction. I threw some money at it in case something becomes of it. I would not suggest you do the same.

Buying TQQQ @ $18.00 I am starting a small hedge on TQQQ. If you don't know, I flip from buying SQQQ and TQQQ.
Our 4-hour chart is signaling a slow of momentum downward, as well as what may be the start of a pullback.
We're currently in a major area of support. We just broke underneath the Keltner Channel and we'll have to retest resistance to move back into it to signal the start of a reversal.
Our MACD and TSI indicators are signaling a slow down and potential crossover, which will be bullish.
I believe we'll retest the resistance of the 200-day EMA. We also have a thin band of resistance in our Ichimoku indicator to take into consideration.


TQQQ (Range Trade)$24.17 was the high since consolidation started late September. Price has been trading in a range since. Might wait til the fed decision and cpi reports pass next week to get a second look.

QQQ TA long QQQ is trading in a major support zone, if we don't get a bounce here we might move a little further down to wave 5 before seeing a significant bounce.
Selling pressure is showing signs of weakening
TQQQ TA (SHORT)Hey guys i am new to Elliot's wave theory so please critique my TA, so bearish divergence on hourly chart with low volume on 4 hour chart. Also looks like a rising wedge being formed. I don't think we can see higher highs until something changes on inflation, economic growth, china and ukraine www.tradingview.com

Normal Monday Pattern QQQ for 12/5/22This is a historical weighted Moving Average of QQQ for Mondays. To build the model, I took a straight average of the past 37 Mondays, and then used a moving weighted average of .15 for the past three Mondays.
Unfortunately, Mondays have not proven to have much price action. You can look for some volatility in the early hour with highs and lows, but the five minute interval mostly staying within a range, followed by a big drop around 10:25 AM. Followed by more choppy boxable action. At 1PM there appears to be a historical afternoon low, which rises until 1:45PM. Then a strong pivot down at 3:00 PM to close.

Monday FOMC Weeks QQQ for 12/12This is a 5 minute moving weighted average pattern looking at the Mondays for the past year falling on the weeks of the FOMC meetings. I used a straight average for the first five Mondays, then weighted the last 3 Mondays falling on FOMC at 15% consecutively (7/25/22, 9/19/22, 10/31,22).
Historically, the high clocks in at the 9:40-9:45 interval, followed with a steady decline until 12:10 PM. Look for choppy boxable action from 12:25 to 2:25 with low opportunity for scalping (You should take a walk here, go to the gym, sing a song, or read a book during this time).
Finally we have a good historical liftoff with steady rise starting at 2:45PM until close.

everything could have just changedif we see downside in semiconductors and rotation between sectors tha is slower and more masured leading to slower losses in indices, and the countertrend movement breaks out into a larger rebound i would call this the beginning of a broader market recovery. the inverse is that we traverse slightly lower, and extend backwardation with resistance around estimate (we are now below) and not seeing support till lower envelope. basically the trend is threatening to reverse in short and in long term, and if sss signal stays green index could be a buy. top of channel is not out of the question.

Wednesday Moving Average Model for QQQ (No FOMC Days) for 11/30This is a 5 minute moving weighted average model of the Wednesday Intra-Day stock price for QQQ. The average looks at all Wednesdays for the past 12 months, and excludes any Wednesdays that fall on FOMC announcement days (those are a separate pattern). To calculate the initial model, I did a straight average of 11 months, then performed a moving weighted average of the last three Wednesdays of the year with each week counting towards the model at a 0.15 weight.
The Wednesday model shows the Open, High, Low, and Close amounts (averaged), as well as the moving weighted historical high of the day, and key pivot points.
Because this Wednesday precedes special announcements of GDP numbers, it is very important to always follow price action. The model may only be useful to look for key swing points, and is not a reliable prediction of future behavior.
Additionally, I have added ADX and Chop data, using the same average methodology described above. For Wednesday, expect that the afternoon will have fairly low momentum. There does appear to be a repeated large move at 2PM that is appearing in my dataset, even when excluding FOMC announcements. I would watch for the 2PM interval to make some huge move (either up or down) as this is a large, repeatable observation.

TQQQ ahead of CPI reportI'm not gonna try and guess what the CPI data will be my gut tells me its gonna be higher but at that point I'm gambling.. If you wanna gamble go to las Vegas.. treat trading like a business am I willing to give back my 6%? no.
I sold my sqqq position early so I could be cash for this CPI report, as stated in the chart I have 2 scenarios posted. If its lower I expect the market to react in a positive way. If its higher I expect the opposite. Does the market always react the way I think it should? no
ADX is not respecting this recent downtrend (classifying it as a pullback) we need the ADX to increase if we want this downtrend to continue. Also keep in mind this is a lagging indicator so it might take some time
MFI is not showing oversold yet which could mean we still have more downside (continuation)
TSV bars are continuing to increase in size as price falls (continuation)
Watch volume closely, the last fed meeting we had a ingulfing green candle then a massive dump so waif for trend direction, In my opinion I think we are very close to a temporary bottom
I'm opened minded so as always let me know what yall think.
Thanks
God bless
