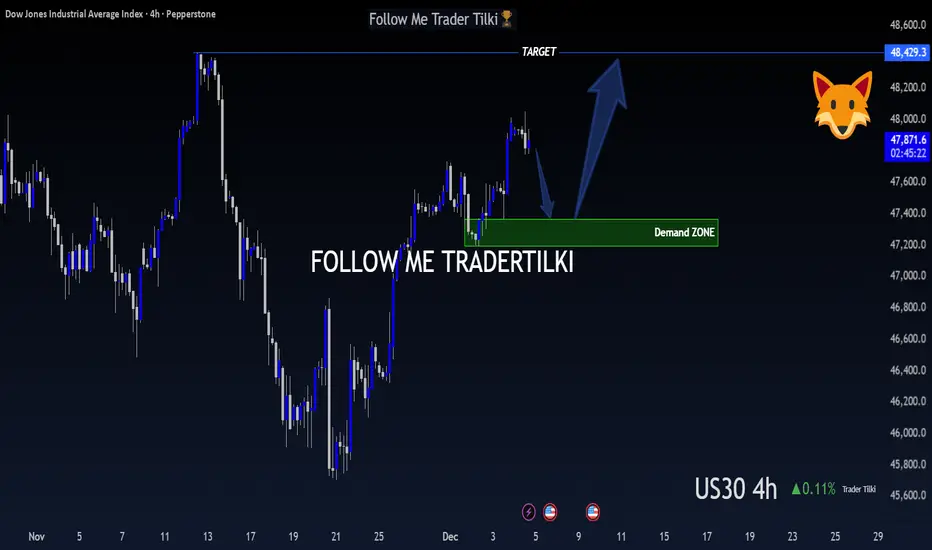
US30 (DOW JONES) – 4-Hour Timeframe Tradertilki AnalysisMy friends,
I have analyzed US30 on the 4-hour timeframe.
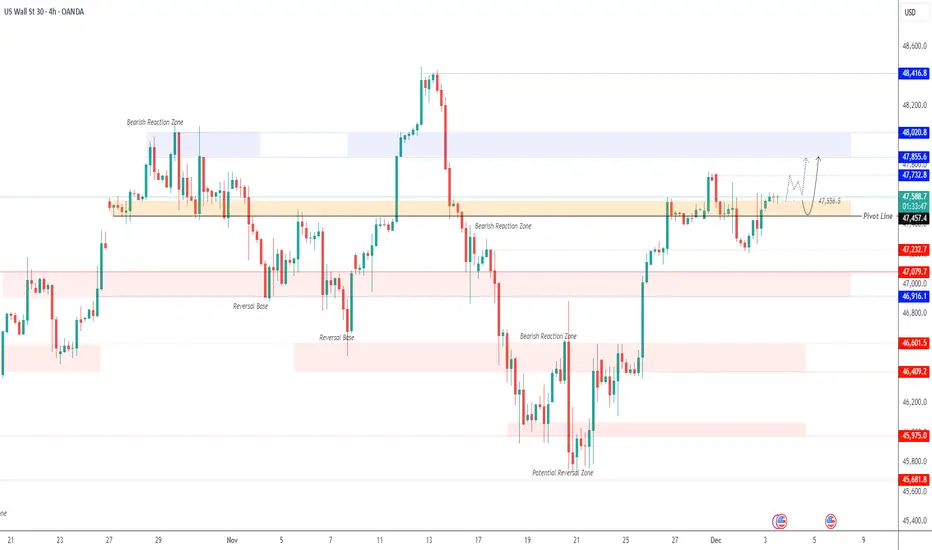
My friends, if US30 reaches the levels between 47,361 and 47,192, I will open a buy position.
My target will be the 48,429 level.
My friends, I share these analyses thanks to each like I receive from you.
Your likes increase my motivation
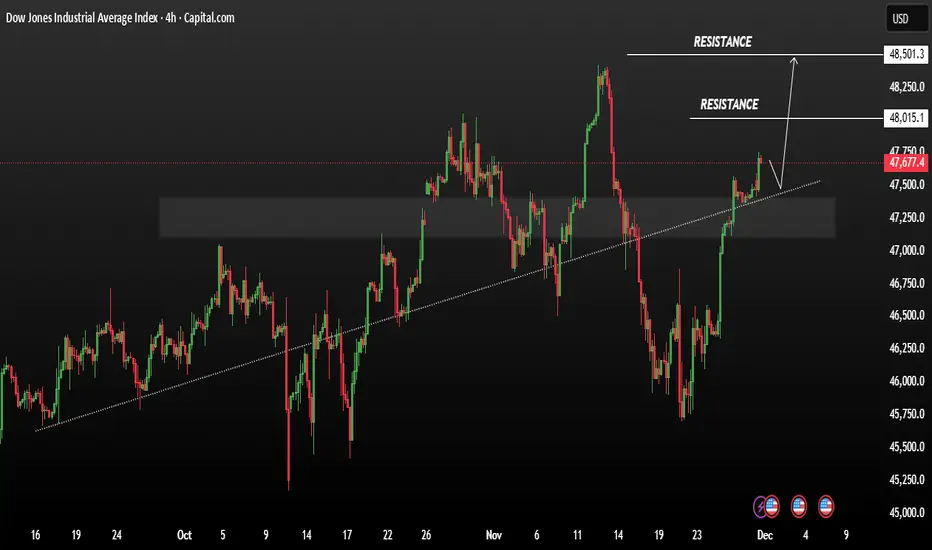
US30 Price consolidation bullish sequenceUS30 Price consolidation bullish sequence price action is shaping a potential continuation phase Price is currently testing a resistance zone,
Technically a rising trendline is supporting the price a well-defined ascending trendline has been respected multiple times price recently bounced from it a
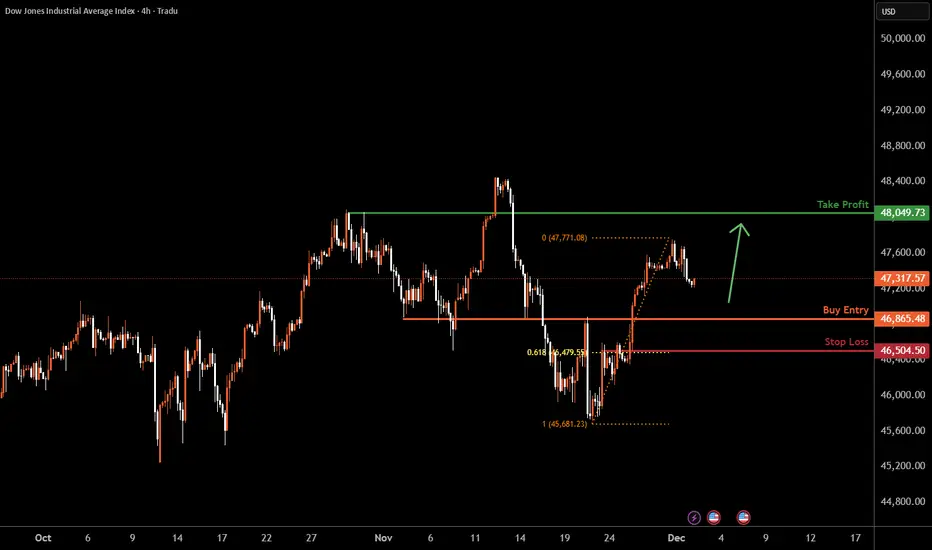
US30 H4 | Falling Towards Key SupportMomentum: Bullish
Price is pulling back toward our buy entry, which has been identified as an overlap support zone.
Buy Entry: 46,865.48
Strong overlap support
Stop Loss: 46,504.50
Pullback support
61.8% Fibonacci retracement
Take Profit: 48,049.73
Pullback resistance
High Risk Investment Warni
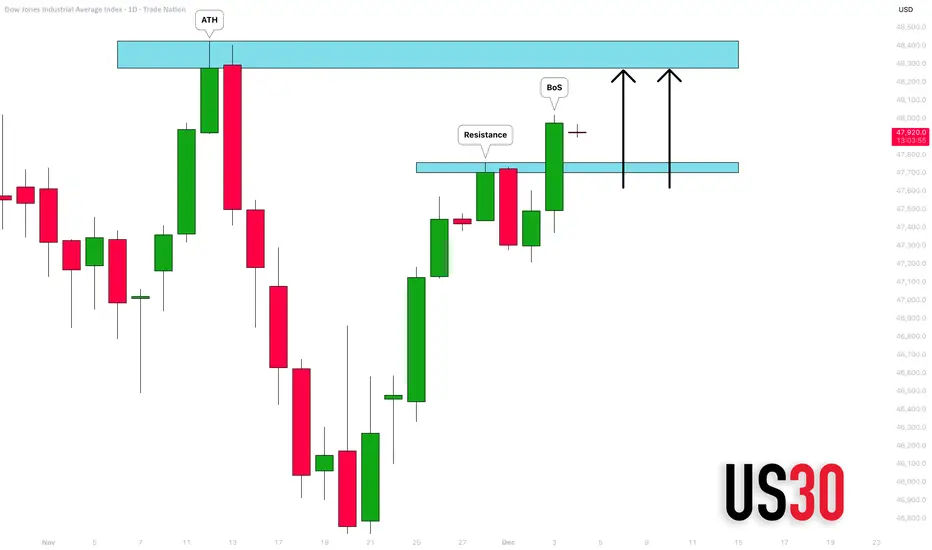
DOW JONES INDEX (US30): Confirmed BoS
With the yesterday's fundamental US news releases and
Trump's speech, US30 bounced strongly.
The market violated a significant daily resistance cluster
and closed above that.
It opens a potential for more growth to a resistance based
on a current All-Time High.
❤️Please, support my work wit

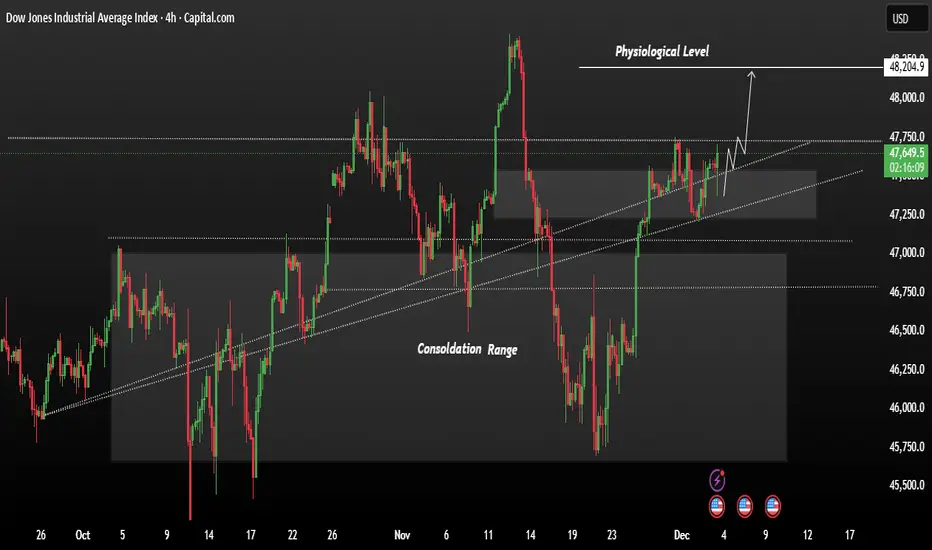
US3O showing strong bullish momentumUS30 is trading in a steady upward channel after breaking out of its previous consolidation range. Price is holding above support and showing strong bullish momentum.
As long as it stays above the current breakout zone, the market is positioned to push higher toward the next psychological level ar
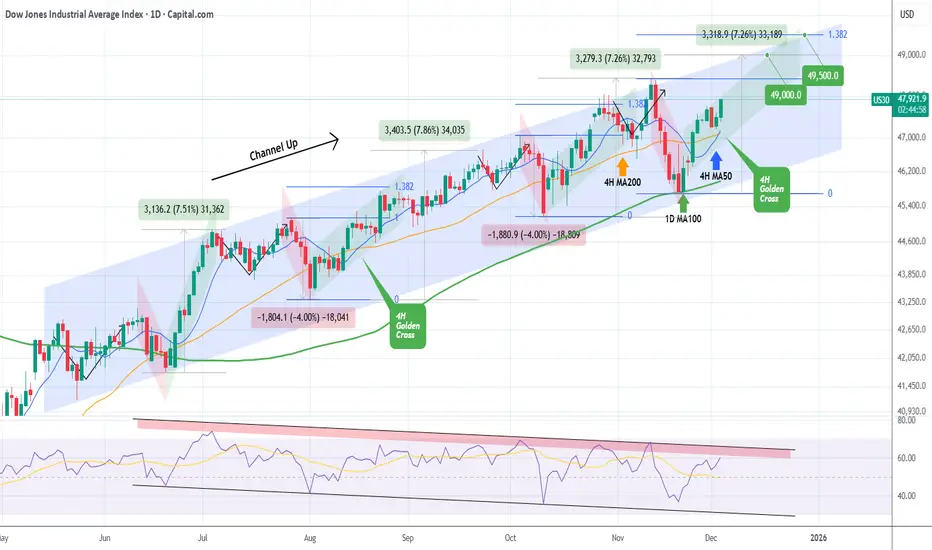
DOW JONES formed its first 4H Golden Cross since August. BullishDow Jones (DJI) has been trading within a 6-month Channel Up and today it formed its first 4H Golden Cross since August 15. Coming off a Higher Low bottom 2 weeks ago on the 1D MA100 (green trend-line), we are currently on the new Bullish Leg of the pattern.
The last one rose by +7.26%, roughly the
WARNING! 22 States Already In Recession.What the map is actually saying
This map claims that as of October 2025, 22 states are either:
Already in recession (red)
At high risk of recession (also red)
“Treading water” (yellow — basically flat growth)
Only the green states are shown as still expanding.
What this really means
This is a

US30 - DOW Hits Major Supply Reversal coming on Dow as it hits a major supply zone. This is part of a bigger cross-asset move that I am anticipating across global equities. I see a synchronised sell off in global equities coming this month.

US30 – MARKET OUTLOOK | December Optimism Meets Key Data RisksUS30 (Dow Jones) – Technical Overview
The Dow Jones posted a modest gain on Tuesday, rising 185 points, as traders embraced a bit of December optimism. Even small upticks count in a holiday month—especially with markets looking for positive momentum amid mixed macro signals.
Volatility is expected
See all ideas
Displays a symbol's price movements over previous years to identify recurring trends.
Frequently Asked Questions
Dow Jones Industrial Average Index reached its highest quote on Nov 12, 2025 — 48,456.49 USD. See more data on the Dow Jones Industrial Average Index chart.
The lowest ever quote of Dow Jones Industrial Average Index is 6,470.00 USD. It was reached on Mar 5, 2009. See more data on the Dow Jones Industrial Average Index chart.
Dow Jones Industrial Average Index is just a number that lets you track performance of the instruments comprising the index, so you can't invest in it directly. But you can buy Dow Jones Industrial Average Index futures or funds or invest in its components.