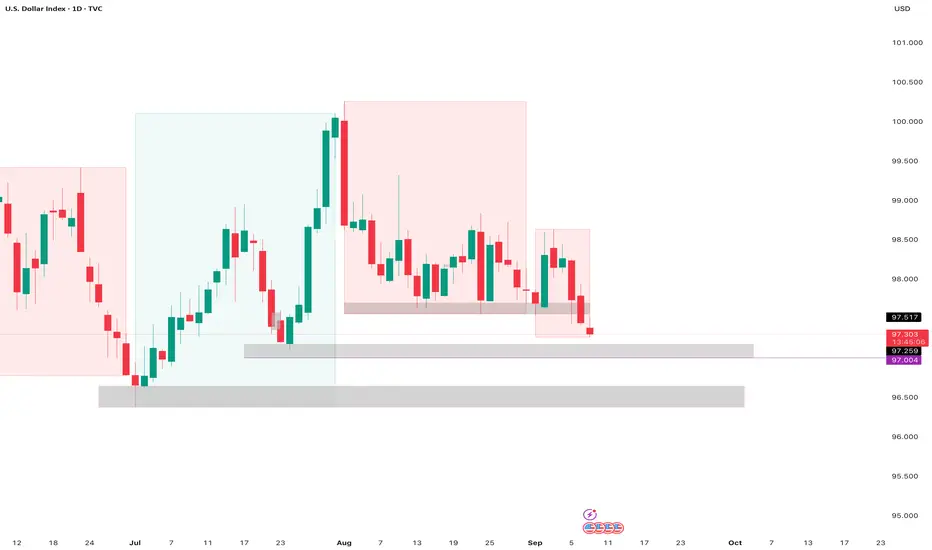
DXY Key Levels to look out for DXY levels to watch out for to show signs of exhaustion for reversal points on the majors, approaching 97
USDX trade ideas
US Dollar: Still Bearish-Neutral, But Is The Correction Ending?Welcome back to the Weekly Forex Forecast for the week of Sept 8-12th.
In this video, we will analyze the following FX market: USD Dollar
The USD is still grinding sideways, but it did sweep the low of the consolidation Friday on bad NFP numbers. Worth mentioning is it finally made contact with a significant demand zone as well. As bearish-neutral as the DXY has looked over the past several weeks, there is potential here that if has finally found support for higher prices.
As long as the market maintains the protected low, we are still in correction territory. The potential for a move higher remains.
React and do not predict.
Enjoy!
May profits be upon you.
Leave any questions or comments in the comment section.
I appreciate any feedback from my viewers!
Disclaimer:
I do not provide personal investment advice and I am not a qualified licensed investment advisor.
All information found here, including any ideas, opinions, views, predictions, forecasts, commentaries, suggestions, expressed or implied herein, are for informational, entertainment or educational purposes only and should not be construed as personal investment advice. While the information provided is believed to be accurate, it may include errors or inaccuracies.
I will not and cannot be held liable for any actions you take as a result of anything you read here.
Conduct your own due diligence, or consult a licensed financial advisor or broker before making any and all investment decisions. Any investments, trades, speculations, or decisions made on the basis of any information found on this channel, expressed or implied herein, are committed at your own risk, financial or otherwise.

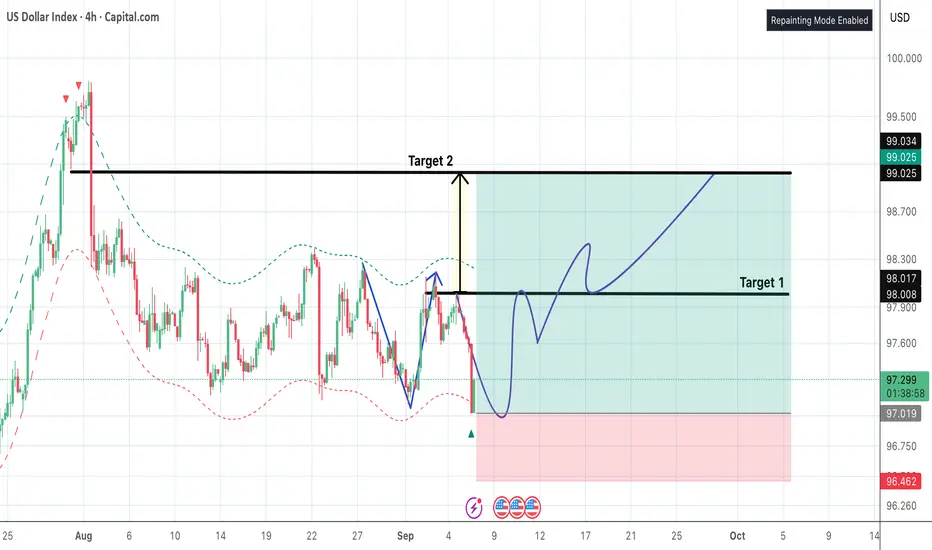
DXY Correction to the UpsideThe much-anticipated pullback to the upside has started.
Remember, even though the overall trend is still bearish as seen by the bigger picture Head and Shoulders pattern I mapped out on H4 TF, we still projected this upside move as a retest of that main pattern.
Confirmations to long as seen on the H1 TF are this inverted Head and Shoulders and a break out and retest of the falling wedge.
Apply correlation to your dollar pairs and Gold.

DXY Daily TF Consolidation Pending a Major BreakoutPrice has been ranging between a daily resistance and demand zone since the beginning of August. Another bounce in the demand zone this week will take price back to the resistance zone and if the resistance zone continues to hold then we short back to demand.
However, should resistance break, then the next target will be in daily supply. CPI should give us a better indication of should we get a break of this consolidation.
Personally I am leaning towards a bullish dollar for the short-term foreseeable future.

Pre"DXY"ction The timeframes keep changing, but i believe the bottom band is absolutely and must be tested. I expect it'll be a 3.618 move down, which is also a fractal from the above.
Let's see,
Not financial advice.

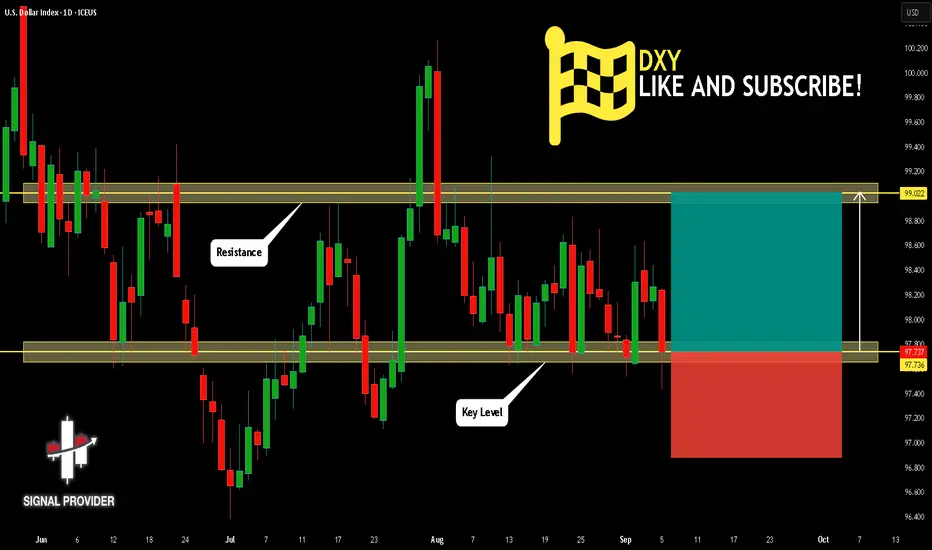
DXY Will Go Up! Long!
Please, check our technical outlook for DXY.
Time Frame: 1D
Current Trend: Bullish
Sentiment: Oversold (based on 7-period RSI)
Forecast: Bullish
The market is trading around a solid horizontal structure 97.736.
The above observations make me that the market will inevitably achieve 99.022 level.
P.S
Overbought describes a period of time where there has been a significant and consistent upward move in price over a period of time without much pullback.
Disclosure: I am part of Trade Nation's Influencer program and receive a monthly fee for using their TradingView charts in my analysis.
Like and subscribe and comment my ideas if you enjoy them!
DXY monthly chart ... bullish aheadDXY monthly chart trading at 97.300- according to channel shows DXY current price is at its cruicial support if it breaks may reach to 200 month EMA i.e. 91.864. As per previous pattern behavior it should reverse from here. If it crosses 100 month EMA i.e. @ 98.511 then price will touches to 50 month EMA 101.253 very soon. This month is only for buyers.

DXY ready to resume downtrend!97.94 Level on DXY is a high liquidity zone as in the falling market there is bounce off to 97.937. Price grabbed liquidity and started to drop again to the major direction of the trend. As it is a long term down trend and price just rejected from a high liquidity zone, it is a high probability price may continue to drop to this support level as multiple timeframe trend is bearish.

Tomorrow’s important newsToday’s news didn’t cause much movement, but tomorrow’s news will definitely bring strong volatility, enough to even change the trend in some currency pairs. ✅

DXY Bearish The DXY is expected to remain bearish until it reaches the 94.00–92.00 levels, with the possibility of dropping even further below those levels

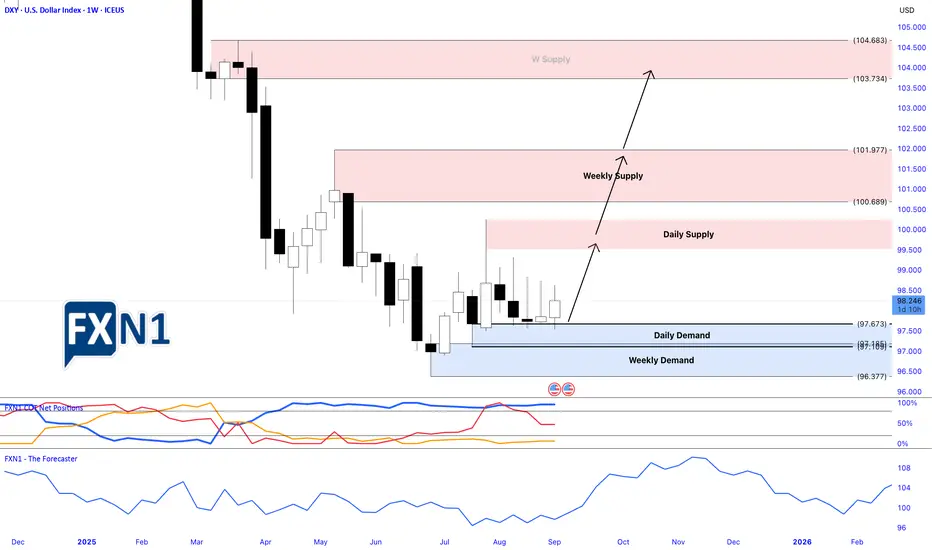
Is the DXY Poised for a Breakout?Analyzing the Bullish PotentialThe DXY (US Dollar Index) appears to be on the verge of a significant upward rally. Last week, I shared my analysis highlighting a potential trigger point for a long entry, which the price subsequently surpassed, confirming the setup. According to the latest COT reports, commercial traders have reached their highest net positions of 2023. Historically, whenever commercials hit new highs, it often signals the beginning of a bullish trend in the DXY.
Additionally, we observe that many currencies measured against the dollar have weakened recently, supporting my thesis of a continued upward move for the DXY. Seasonal patterns also point toward a potential bullish phase.
Is this the moment for the DXY to initiate a strong bullish trend? Only time will tell, but the technical and fundamental signals are aligning in favor of a possible rally.
✅ Please share your thoughts about Dollar index in the comments section below and HIT LIKE if you appreciate my analysis. Don't forget to FOLLOW ME; you will help us a lot with this small contribution.
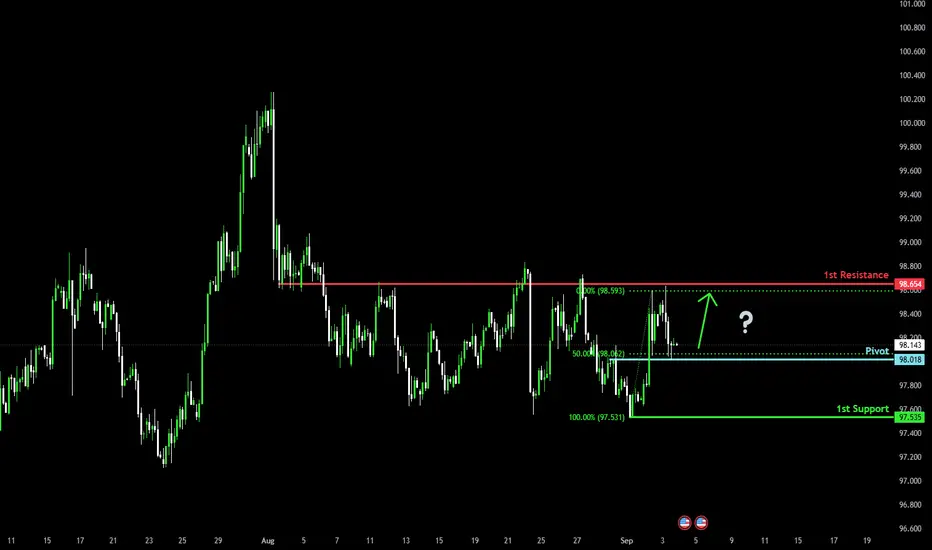
Bullish reversal at pullback support?The US Dollar Index (DXY) is falling towards the pivot, which acts as a pullback support that aligns with the 50% Fibonacci retracement and could bounce to the 1st resistance.
Pivot: 98.01
1st Support: 97.53
1st Resistance: 98.65
Risk Warning:
Trading Forex and CFDs carries a high level of risk to your capital and you should only trade with money you can afford to lose. Trading Forex and CFDs may not be suitable for all investors, so please ensure that you fully understand the risks involved and seek independent advice if necessary.
Disclaimer:
The above opinions given constitute general market commentary, and do not constitute the opinion or advice of IC Markets or any form of personal or investment advice.
Any opinions, news, research, analyses, prices, other information, or links to third-party sites contained on this website are provided on an "as-is" basis, are intended only to be informative, is not an advice nor a recommendation, nor research, or a record of our trading prices, or an offer of, or solicitation for a transaction in any financial instrument and thus should not be treated as such. The information provided does not involve any specific investment objectives, financial situation and needs of any specific person who may receive it. Please be aware, that past performance is not a reliable indicator of future performance and/or results. Past Performance or Forward-looking scenarios based upon the reasonable beliefs of the third-party provider are not a guarantee of future performance. Actual results may differ materially from those anticipated in forward-looking or past performance statements. IC Markets makes no representation or warranty and assumes no liability as to the accuracy or completeness of the information provided, nor any loss arising from any investment based on a recommendation, forecast or any information supplied by any third-party.
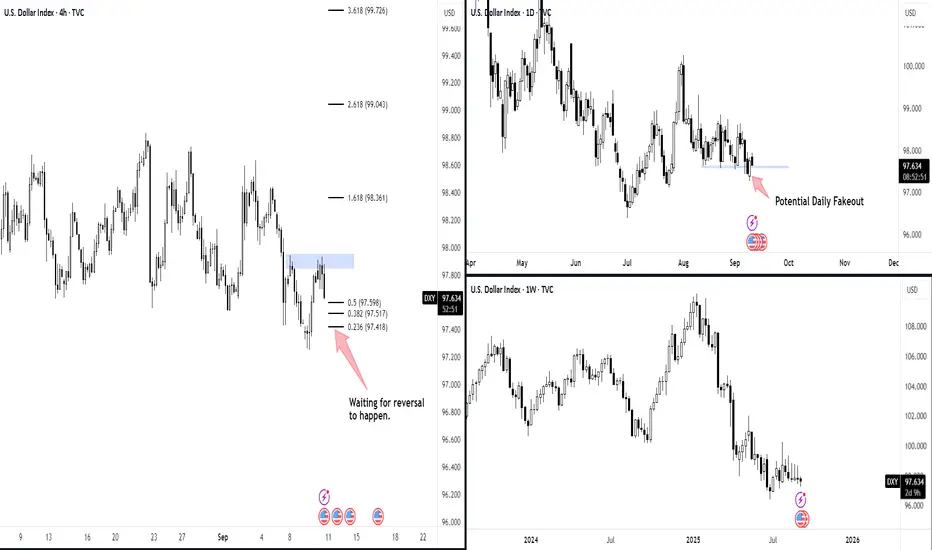
DXY – Potential Bullish Bias: Daily Fakeout & H4 ReversalThe Dollar Index (DXY) is showing signs of a possible bullish reversal.
On the Daily timeframe, price has swept below support and is now indicating a potential fakeout. This often signals trapped sellers and can provide fuel for a bullish recovery if price reclaims above the broken level.
On the H4 timeframe, I see a V-shape continuation pattern forming. Price has also made multiple retests in the same zone, showing strong buying interest. This confluence strengthens the bullish bias.
For execution, I will wait for a clear reversal signal on H4 (such as a strong bullish engulfing candle or momentum break) before confirming the entry. If the reversal holds, the next upside targets could align with the Fib extension levels (1.618, 2.618, and 3.618).
Risk management remains key – if price fails to hold the fakeout level, then the bearish trend may still continue.
Disclaimer: This is not financial advice or a trade call. Analysis shared here is for educational purposes only. Please manage your own risk accordingly.
Brief Analysis of US DXYDXY is trading around 97.70, while trending within a descending channel formation, and holding above 97.60 (Fib support 0.236), with resistance seen near 97.80–98.00 zone.
The RSI is rising and holding near 46, showing mild recovery momentum but not yet strong enough for a breakout.
However, prices have taken a support at the middle Bollinger band, which might lift the dollar a little higher.
Price action suggests consolidation inside the descending channel; intraday bias stays neutral-to-bullish above 97.60.
PPI data stronger than expected could lift DXY toward 98.35–98.50, while weaker data may pressure it back toward 97.30.
The 10Y auction outcome will also guide direction — higher yields can support the dollar, while softer demand may weigh on it.
WILL THE BEARS CONTINUE TO BREAK THE BULLS' BACKS ???DXY ANALYSIS (Weekly Timeframe) (Chart 2)
Looking at higher times, weekly and monthly. We see that price created a long-term bullish support. We have seen the first several touches of the support line between the 28th of April 2011 and the 29th of August 2011, a total of 10 touches. We have also seen the second touches on the trendline between the 6th of January 2021 and 7nth of May 2021, about 12 touches. We are currently witnessing the third touches on the trendline. Price has already touched once the trendline on the 30th of June 2025. We are still expecting more touches and a breakthrough into the trendline. Should bulls remain weak, we will see price retest and breakaway from the trendline.
#SabaliCapital
#TechnicalAnnalysis
#DXY

LIQUIDITY GAMES: DOLLAR HOLDS THE LINE WHILE CRYPTO SURGESWe head into a heavy news flow week with CPI Thursday and the FOMC next Wednesday. It’s easy to expect continuation of bearish economic data — but don’t think for a second that news alone will simply make price drop.
The dollar has been holding and absorbing both sides of the market for the past month. This kind of structure often creates the opposite effect of what headlines suggest. While traders lean bearish, the dollar could easily run higher into mid-range before rolling over.
We’ve seen this pattern before — gold rush movements and Bitcoin rallies that unfold without the dollar moving. It’s planned this way, building liquidity by trapping both sides.
From a CORE5 perspective:
– Structure → BTC is pressing toward the 124K liquidity zone, while DXY consolidates in balance.
– Dynamic Symmetry → rallies and pullbacks are aligned; watch for rotation if dollar squeezes higher.
– Volume & Order Flow → Bitcoin flows remain elevated, but sustainability hinges on post-CPI reactions.
– Confluence → Risk pairs remain vulnerable if DXY snaps higher, despite crypto’s relief bid.
Beaware - In weeks like this, price action around news is designed to confuse. Stay focused on structure and confluence, not headlines.
Trading is only fun when you’re on the winning side — guessing usually lands you on the other

Post NFP Analysis on GBPUSDThe market remains bullish for the DXY.
We'll keep an eye to see either scenario play out, then we Trade

Dollar Index - How Low Can We Really Go?The U.S. dollar is having the kind of year that makes you check if someone switched its medication — down about 10% so far in 2025, its worst showing since Richard Nixon murdered the gold standard.
Momentum traders had a field day this week with low resistance from 98.100 to 97.500 within one trading session.
This draw towards sell side liquidity was covered in the previous analysis and if you participated in the short play this week, you should be proud of yourself!
GBPUSD and EURUSD (the only 2 FX pairs I track) rallied on dollar weakness, targeting premium arrays on the 1-hour timeframe.
Although my overall bias for dollar index is bearish which will provide risk on scenarios, it does not mean every single week will print limit down. Retracements are expected. For this reason, I am playing it safe by being neutral.

DXY Next Week Trade- Patient is the keyFlip the chart again and this is what I see
Everything is on the chart
Be Patient and manage fund right
Goodluck
USD Index Technical Outlook – Key Buy & Sell LevelsThe U.S. Dollar Index (DXY) is currently trading inside a clear downward channel, showing a bearish market structure. Price is hovering near 98.23, just below the key resistance zone between 98.5 – 99.2, where Fibonacci retracement levels (0.382, 0.5, and 0.618) also align, making it a strong supply area. As long as price remains below this zone, the bias stays bearish, with potential downside targets at 97.5 and then 96.5, in line with the channel support and Fibonacci extensions. However, if buyers manage to push above 99.2, it would signal a possible trend reversal and shift the outlook towards bullish continuation. Overall, the structure suggests that the U.S. Dollar Index is more likely to face rejection near resistance and continue lower in the short term.
🔴 Sell Zone (Short Setup)
- 98.50 – 99.20 is a strong resistance area where price aligns with the Fibonacci retracement (0.382 – 0.618) and the upper channel trendline.
- Sell Trigger: If price shows rejection (bearish candles, wicks, or reversal patterns) within this zone.
🟢 Buy Zone (Long Setup)
- 97.50 – 96.50 area is the channel support and also near Fibonacci extension levels.
- Buy Trigger: Look for bullish confirmation (bounce, bullish engulfing, or rejection wicks).
Note
Please risk management in trading is a Key so use your money accordingly. If you like the idea then please like and boost. Thank you and Good Luck!

DOLLAR INDEX DOLLAR INDEX holding on support floor, one more bearish drop will it tanking ,the US10Y is down .
#dollar #dxy
Bullish reversal?The US Dollar Index (DXY) has bounced off the pivot and could rise to the 1st resistance that aligns with the 50% Fibonacci retracement.
Pivot: 97.49
1st Resistance: 98.15
1st Support: 97.16
Risk Warning:
Trading Forex and CFDs carries a high level of risk to your capital and you should only trade with money you can afford to lose. Trading Forex and CFDs may not be suitable for all investors, so please ensure that you fully understand the risks involved and seek independent advice if necessary.
Disclaimer:
The above opinions given constitute general market commentary, and do not constitute the opinion or advice of IC Markets or any form of personal or investment advice.
Any opinions, news, research, analyses, prices, other information, or links to third-party sites contained on this website are provided on an "as-is" basis, are intended only to be informative, is not an advice nor a recommendation, nor research, or a record of our trading prices, or an offer of, or solicitation for a transaction in any financial instrument and thus should not be treated as such. The information provided does not involve any specific investment objectives, financial situation and needs of any specific person who may receive it. Please be aware, that past performance is not a reliable indicator of future performance and/or results. Past Performance or Forward-looking scenarios based upon the reasonable beliefs of the third-party provider are not a guarantee of future performance. Actual results may differ materially from those anticipated in forward-looking or past performance statements. IC Markets makes no representation or warranty and assumes no liability as to the accuracy or completeness of the information provided, nor any loss arising from any investment based on a recommendation, forecast or any information supplied by any third-party.

DXY Long/Short The movement of the dollar index may be influenced by the dynamic interactions between buyers and sellers, as assessed using the harmonic crab algorithm.
