DXY Possible sell on pullback!Back to back 3 weekly pin bar on DXY with series of lower high's putting pressure on the weekly support level. From the Monthly, it is a long term bear market, after the previous monthly pullback, price started to continue to drop which signals potential new impulse on the monthly. As the monthly close, the price is on the intraday support with potential for initial bounce. As weekly market is creating series of higher low, there is a possibility of 50% pullback and liquidity grab to potentially break the weekly support.
USDX trade ideas

Will history repeat for Dixie and TrumpThe Wild Card: The US Dollar (Dixie) Trend. A sustained Trump-led drop in the Dixie (as we had seen in his first term) is still a significant downside risk for the dollar.
Potentially lifting majors further even despite the woes of European currencies and most risk assets. This is the "smart money buys dips" trend we've seen across Cable and Euro. However, this is a bet on a US story, not a Euro Zone one and could reverse temporarily before eventually go lower and taking Sterling and the Euro with it as the multi-polar world arises.
For now, Dixie has enjoyed a boost from better than expected Treasury sales, last month seeing massive inflows and strong demand. Especially from indirect buyers (foreign investors) with the primary dealers, buyers of last resort, given some respite (seeing lowest participation on record).
Perhaps a catalyst for a swift dollar rally into more aggressive downward pressure.
With the US potentially dipping into a recession. The dollar generally does well in economic slowdowns. But can it stop the drop to 93.6 ?

Dollar Bloodbath = Risk On Assets Rally?Dollar Fundamentals:
The dollar posted modest gains on Friday due to higher T-note yields, which have strengthened the dollar’s interest rate differentials.
The University of Michigan US Sep consumer sentiment index fell more than expected to a 4-month low causing the weakening of the dollar.
Limiting the upside in the dollar are the increased expectations for Fed easing through year-end. The dollar is also being undercut by concerns over Fed independence, which could prompt foreign investors to dump dollar assets as President Trump attempts to fire Fed Governor Cook, and by Stephen Miran’s intention to be a Fed Governor.
What Can We Expect Going Forward?
- Due To High Resistance Over Multiple Weeks, There Will Be Massive Levels Volatility, Aiming To Trap The Retail Traders
- Next Week Wednesday Will Determine How Volatile Dollar Will Be. Anything More Than A .25 Basis Point Decline Will Cause Turmoil For Dollar.
- This Will Lead Risk-On Assets (e.g. GBPUSD, EURUSD, AUDUSD) Rallying Up Into Premium Arrays
Prices To Keep An Eye On:
- 99.078 (Last Line Of Defence)
- 96.377 Major Sellside Liquidity
- Medium-Term Draw To 95.716 - 94.313 HTF Array
GBPUSD
Fundamentals :
UK gross domestic product remained unchanged in July after growing 0.4% in June, the Office for National Statistics said, as manufacturing output, which makes up 9% of the economy, dropped by 1.3% on the month.
The BoE is widely expected to keep its benchmark Bank Rate unchanged on September 18, after a split decision to lower the rate to 4% in August.
What To Expect Going Into Next Week?
- Increased Volatility
- Trigger HTF Stop Losses
- Unusually High Levels Of Manipulation
Price Points To Keep A Eye On:
- 1.35950 Buyside Liquidity
- 1.36760 - 1.37036 Longer Term Premium Array
- 1.34458 Mean Threshold (Last Line Of Defence)

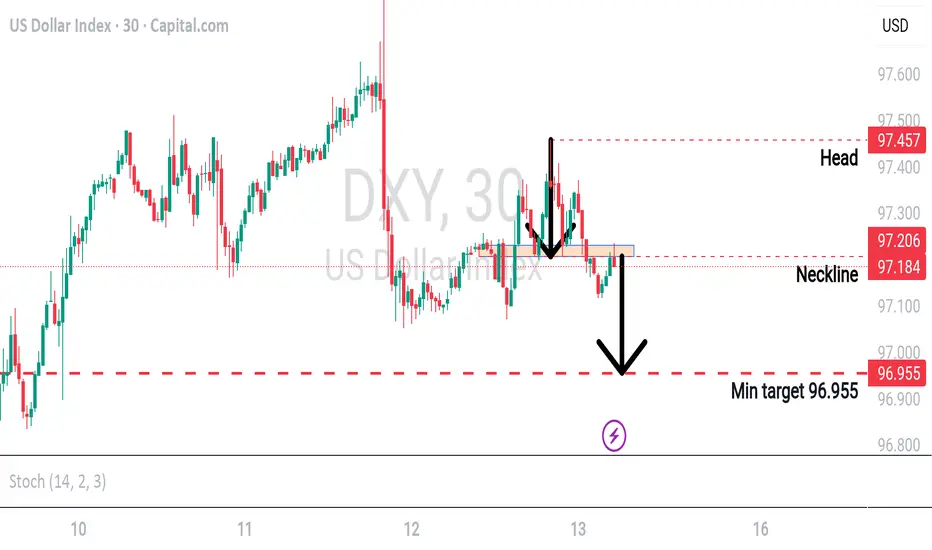
Dollar index downtrend continuationOn the daily timeframe, we could observed a downtrend movement impact of the NFP news.
The market then, made a healthy retracement.
When will this retracement end?
Lets zoom-in in a lower timeframe.
This chart is m30. We could observed a complete H&S pattern hint for down movement is about to start.
I believed it can go further down but lets aim as what H&S pattern suggest,
Distance from 'Head' to 'Neckline'= Distance from 'Neckline' to 'Target'.
This is analysis is for my future reference.
If you want to follow, make sure calculate your own risk & reward.
This analysis will have corelation with other currencies:-
USDXXX : Down trend
XXXUSD : Up trend
Good Luck
DXY: Target Is Down! Short!
My dear friends,
Today we will analyse DXY together☺️
The recent price action suggests a shift in mid-term momentum. A break below the current local range around 97.216 will confirm the new direction downwards with the target being the next key level of 97.160 and a reconvened placement of a stop-loss beyond the range.
❤️Sending you lots of Love and Hugs❤️
WILL THE BEARS CONTINUE TO BREAK THE BULLS' BACKS ???DXY ANALYSIS (Daily Timeframe).
On the 1st of July 2025 price began printing a sideways correction, wherein minute wave (a) terminated on the 1st of August 2025. Price is currently printing a minute wave (b) before a minute wave (c) to complete minor wave 4. Minute wave (c) may not take out the 100.257 levels due to the strength of the Bears.
Looking at higher times, weekly and monthly. We see that price created a long term bullish support. We have seen the first several touches of the support line between the 28th of April 2011 and the 29th of August 2011, a total of 10 touches. We have also seen the second touches on the trendline between the 6th of January 2021 and 7nth of May 2021, about 12 touches. We are currently witnessing the third touches on the trendline. Price has already touched once the trendline on the 30th of June 2025. We are still expecting more touches and a breakthrough into the trendline. Should bulls remain weak, we will see price retest and breakaway from the trendline.
#SabaliCapital
#TechnicalAnnalysis
#DXY

possibility of downtrend It is expected that a trend change will form within the current support range and we will witness the start of an upward trend.

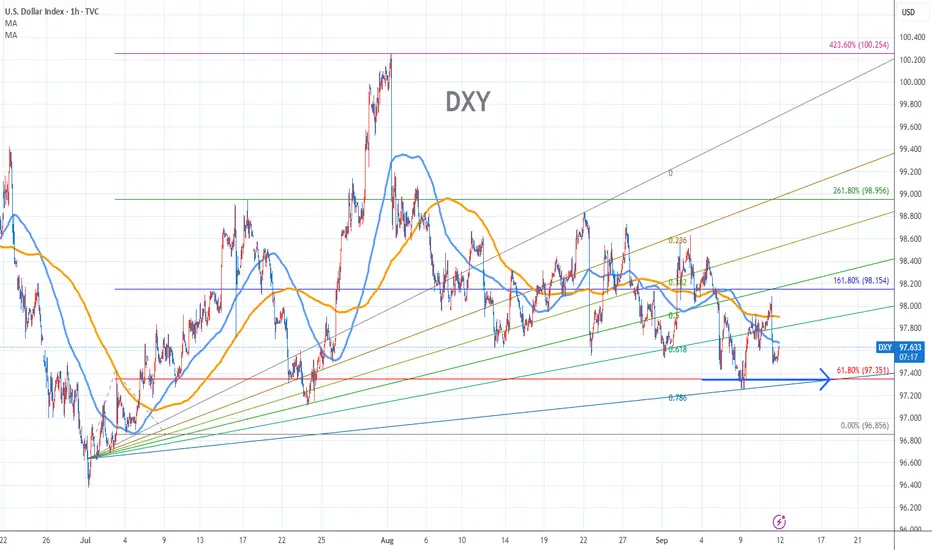
Dollar Index Stock Chart Fibonacci Analysis 091125Trading Idea
1) Find a FIBO slingshot
2) Check FIBO 61.80% level
3) Entry Point > 97.4/61.80%
Chart time frame:B
A) 15 min(1W-3M)
B) 1 hr(3M-6M)
C) 4 hr(6M-1year)
D) 1 day(1-3years)
Stock progress:A
A) Keep rising over 61.80% resistance
B) 61.80% resistance
C) 61.80% support
D) Hit the bottom
E) Hit the top
Stocks rise as they rise from support and fall from resistance. Our goal is to find a low support point and enter. It can be referred to as buying at the pullback point. The pullback point can be found with a Fibonacci extension of 61.80%. This is a step to find an entry-level position. 1) Find a triangle (Fibonacci Speed Fan Line) that connects the high (resistance) and low (support) points of the stock in progress, where it is continuously expressed as a Slingshot, 2) and create a Fibonacci extension level for the first rising wave from the start point of the slingshot pattern.
When the current price goes over the 61.80% level, that can be a good entry point, especially if the SMA 100 and 200 curves are gathered together at 61.80%, it is a very good entry point.
As a great help, TradingView provides these Fibonacci speed fan lines and extension levels with ease. So if you use the Fibonacci fan line, the extension level, and the SMA 100/200 curve well, you can find an entry point for the stock market. At least you have to enter at this low point to avoid trading failure, and if you are skilled at entering this low point, with the fibonacci6180 technique, your reading skill of to chart will be greatly improved.
If you want to do day trading, please set the time frame to 5 minutes or 15 minutes, and you will see many of the low points of rising stocks.
If you prefer long-term range trading, you can set the time frame to 1 hr or 1 day
Renewed decline of the Dollar IndexBefore today, the dollar was trying to break out of the range box, but after the news, it fell back inside the range. It is expected to return to the bottom of the range, and if the trend continues this way, there is also a possibility of breaking down below the range. ✅

U.S. Dollar Index (DXY) into Core CPI — key levelsContext (macro)
PPI is upstream; CPI is what the market prices. Core CPI at 08:30 ET (14:30 SAST) will set the near-term path for the USD, UST yields, gold, and risk assets. The tape is positioned for a directional move outcome depends on whether core inflation is softer, in-line, or hot.
Daily DXY chart
Structure: An inverse head-and-shoulders completed into late July with a clear break of structure. Since then, price has flagged back inside the prior value area in a descending channel, sitting mid-range.
Range: Roughly 97.3–98.6 is the active box.
Liquidity markers:
Swing low: ~97.1–97.3 (recent liquidity sweep).
Swing high: ~100.0–100.5 (unresolved liquidity from July spike).
Bias from structure: Post-break bullish continuation is favoured if the channel resolves up, but repeated supply above 98.5 means confirmation matters.
Levels that matter:
Support: 97.30–97.40 (range floor). Beneath that: 97.10, then 96.60 (the “head” low).
Resistance: 98.40–98.60 (range cap). Above: 98.90–99.10 (channel top/throw-over), then 100.0–100.5 (swing-high liquidity).
Event-driven scenarios (Core CPI 08:30 ET / 14:30 SAST):
Soft CPI (sub-consensus core)
Reaction path: USD offered → DXY breaks 97.30 → 97.10 test; follow-through opens 96.60.
Confirmation: A 4H close below 97.30 that fails to reclaim on retest.
Cross-asset: UST yields down, gold up, risk bid; EUR, GBP, commodity FX supported; USDJPY heavy.
In-line CPI (near consensus)
Reaction path: First move likely fades; range persists 97.8–98.2 with whipsaws. Market waits for next catalyst (Fed speak/data).
Tactics: Fade extremes of the box until a daily close breaks 97.30 or 98.60.
Hot CPI (above consensus core or sticky services)
Reaction path: USD squeezes → clean break and hold above 98.60 → attack 98.90–99.10. Sustained acceptance above 99.10 puts 100.0–100.5 back in play.
Confirmation: Daily close above 98.60, followed by shallow pullbacks that hold former resistance as support.
Cross-asset: UST 2s/10s yields up, gold pressured, risk off; EUR/GBP slip; USDJPY supported with yields.
Trading plan logic (not advice):
Bullish continuation trigger: Daily close > 98.60, then hold 98.40–98.60 on retest. Targets 98.90–99.10, extension 100.0–100.5.
Bearish breakdown trigger: 4H close below 97.30 and failed reclaim. Targets 97.10 then 96.60.
Invalidations: For longs, a shove back inside the channel that loses 98.10 after a breakout. For shorts, inability to hold below 97.30 within 1–2 sessions post-break (bear trap risk around CPI).
Why this setup matters:
We’ve got compression inside a descending channel parked on prior value. CPI is the release valve. Don’t anchor on the first spike; wait for acceptance beyond 98.60 or 97.30 to avoid getting chopped.

Strength of the $The U.S. dollar is facing a rare convergence of structural and cyclical headwinds in 2025, and analysts expect its decline to continue into 2026. Here’s a breakdown of the most influential factors driving the dollar’s weakness:
---
## 📉 Key Drivers of Dollar Decline
### 1. **Federal Reserve Policy Shift**
- The Fed is expected to cut rates by 25–50 basis points due to soft labor data and rising unemployment (now at 4.3%).
- Lower interest rates reduce the yield advantage of dollar-denominated assets, making them less attractive to global investors.
### 2. **Surging U.S. Debt and Treasury Issuance**
- Debt-to-GDP is approaching **130%**, one of the highest in history.
- Massive Treasury issuance to fund deficits is creating bond market volatility and investor fatigue.
- Foreign holders are increasingly hedging or reducing exposure to U.S. debt.
### 3. **Political and Fiscal Uncertainty**
- Post-election trade policies, tariff announcements, and fiscal gridlock have eroded confidence in U.S. governance.
- Currency traders are pricing in higher risk premiums for U.S. assets.
### 4. **Global De-Dollarisation Trends**
- BRICS nations and others are settling trade in non-dollar currencies like the yuan.
- The dollar’s share of global FX reserves has dropped to ~58%, down from 71% in 2000.
- This shift is accelerating as geopolitical blocs strengthen outside the U.S. orbit.
### 5. **Safe-Haven Rotation**
- Investors are diversifying into gold, commodities, and crypto:
- Gold has surged past **$3,600/oz**, with projections up to $5,000.
- Bitcoin and Ethereum are gaining traction as digital hedges against fiat depreciation.
---
## 🧠 Strategic Implications
- **Import inflation**: A weaker dollar makes foreign goods more expensive, pressuring consumer prices.
- **Export boost**: U.S. goods become more competitive abroad, which could help manufacturing.
- **Asset reallocation**: Global investors may shift toward emerging markets, commodities, or alternative currencies.

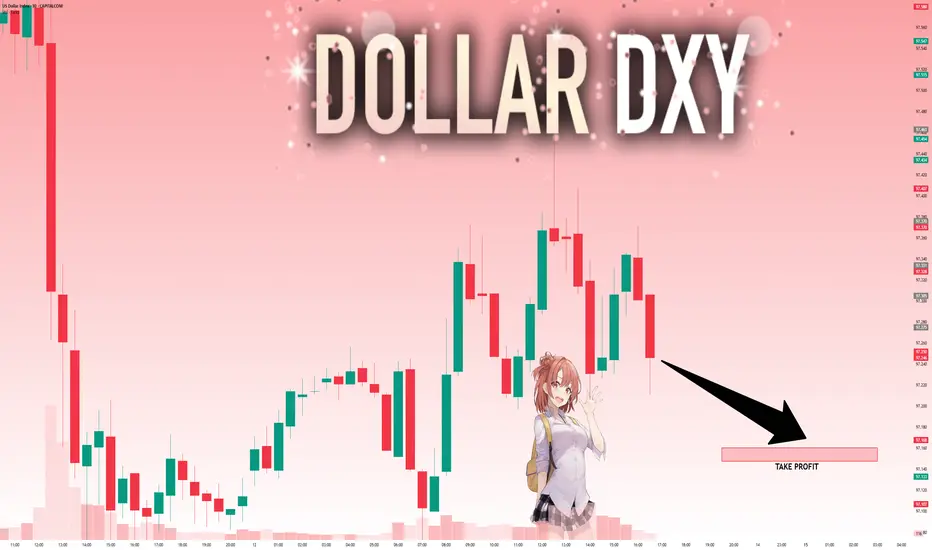
DXY - Updated trade (10sept)Still the very same outlook like the previous DXY trade only difference is that we re-entered at the very same price and extended SL below the LQC(candle that swept liquidity) and took our TP abit higher

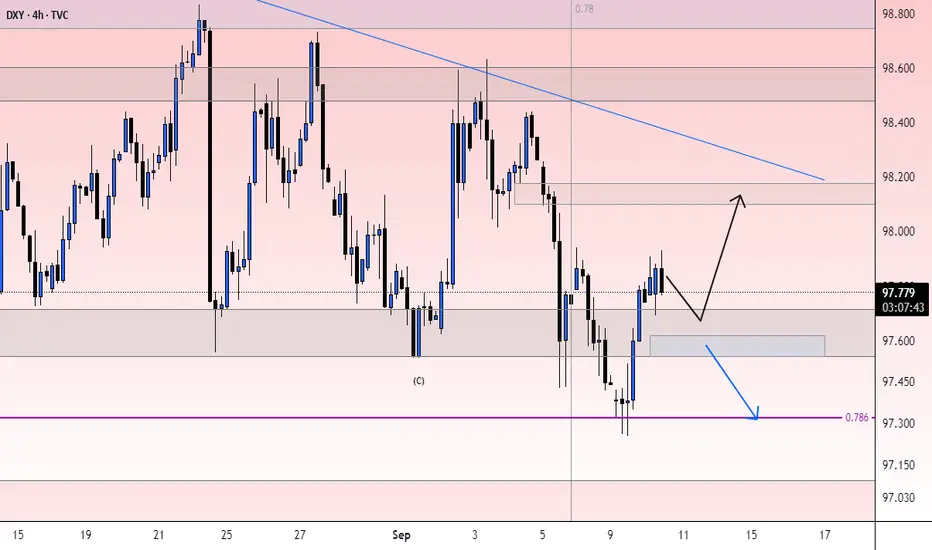
DXY Trade Outlook – Sept 10, 2025DXY currently sits at a critical zone with mixed timeframe confluence:
Weekly: Bearish bias still intact.
Daily: Bullish structure after tapping into POI.
4H: Bearish at extreme POI.
Key Note:
Not expecting a strong close below 97.80, although intraday spikes may occur. Watching for confirmation before directional commitment.
Outlook: Neutral-to-bullish bias in the short term, but bigger picture remains capped by higher-timeframe bearish structure.

uptrendThe downward trend in the current support range is expected to end and we will witness the beginning of the upward trend.
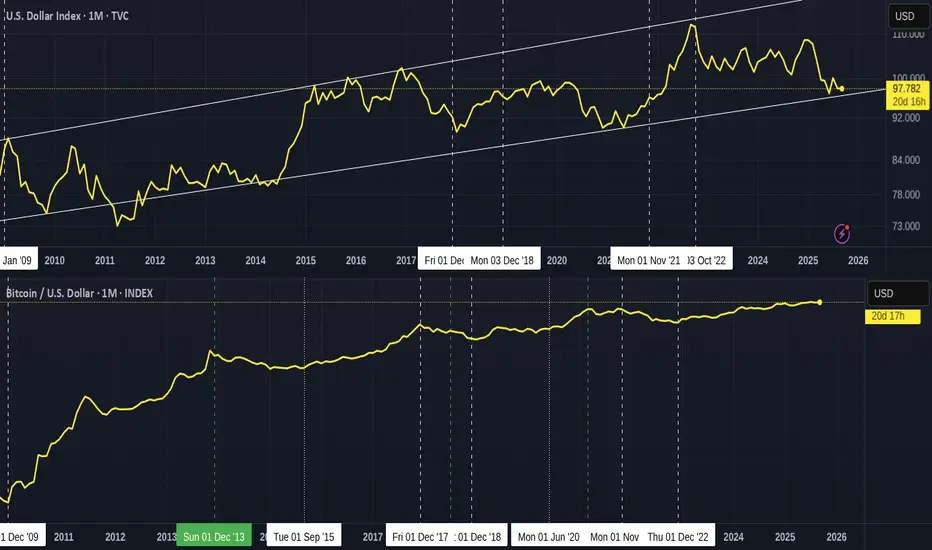
DXY and Bitcoin since 2009 - compare PA and see possible paths
This is a very clear Chart with the DXY Index on top and the Bitcoin Index below, Both starting in 2009.
You tell me which is more volatile.
Things to take note of here
See how, Most of the time, when DXY Rises, Bitcoin Drops.
Compare the dates on both charts and see this.
And what REALLY needs to be paid attention to Right now is how the DXY is back on its lower trend line of Support.
It has bounced off this trend line many times since 2009
We maybe about to see another one anytime between now and Dec.
The interesting thing about this is simply that should the FED Cut Rates next week, this reduces the desire to hold $ as returns are diminished.
This would Drop the DXY below the support it created in 2008.
The chart below shows DXY since 1973 and what happened on major rate cuts
As you can see, nearly Every time, DXY Drops when Rates are cut.
So, The question is this.
If The FED drops rates, will DXY Drop below a strong line of support and BTC Rise as Risk becomes cheaper. ?
OR
Will DXY go against the tradition, bounce off support and Rise as Rates lower the cost of borrowing the $ and industry investment grows ?
This could also lead to an increase in investment in Bitcoin.
For Bitcoin, there are many things that say we are near a Top but still have room to move higher.
But there are also a number of things that point towards the pattern of previous cycles are changed. The ETF system leading to Bitcoin being bought and Held, stopping the massive price swings could be a major factor.
Look what happened to GOLD after the ETF were allowed in 2004
The asset has Risen ever since. But it has to be said, Bitcoin % of profit since 2009 is Many Many times more than Gold !
We are at a crossroads for all these assets
Next week the FED tells us if they will Cut rates as expected.
We will then see how Markets react
Hang on tight Ladies and Gents.
We have some interesting days ahead.
Good reaction on supportAs we mentioned in the previous analysis, the price was correctly rejected after touching the resistance, and now it has also shown a very good reaction on the support. The price has risen nicely, creating a great setup for us. For re-entry, we need to wait until another structure forms

DXY: Target Is Up! Long!
My dear friends,
Today we will analyse DXY together☺️
The price is near a wide key level
and the pair is approaching a significant decision level of 97.331 Therefore, a strong bullish reaction here could determine the next move up.We will watch for a confirmation candle, and then target the next key level of 97.458.Recommend Stop-loss is beyond the current level.
❤️Sending you lots of Love and Hugs❤️

Dollar Inde: back in the range / potential move to >100Dollar Index is coming back in the range of the previous correction before the drop in the first 2 days of the week. As we're typing we still cannot rule out another small correction for more downside. However, as price proceeds to the upside, we will take a look at today's close: if price closes the daily candle above the previous 3 weeks low and the previous month low, we will start looking for buy setups all the way back to the 100 area, as previously discussed.
Stay tuned for more updates on short opportunities on EURUSD, GBPUSD and NZDUSD (this last one is technically not in the dollar basket but could have the potential for a nice drop too because the move could be dollar driven only).

Dxy Chart LongBias
Fundamental
NFIB SmallBusiness Index Actusl Greater then Forecast
Technical
Double Bottom

BUY DXYIn todays session we will be taking buys on the dollar. Our entry is at 97.677 and stops are below 97.480 targets are above 98.40. Use proper risk management.

DXY SHORTS | 9SEPT Price failed to hold above resistance — strong sign of supply in control ⚡.
Intraday structure shifting bearish below 97.400.
Minor LQC + demand point marked — a confirmed close below supports further downside.
⚡ Trade Summary:
This is a continuation play following the first trade idea. The rejection confirms bears are stepping in, aligning with higher timeframe momentum. Short positions below 97.400 remain valid, targeting 97.100.

DXY countertrend play | 9 SEPT📌 Key Observations:
Asian session highs swept ➡️ liquidity grab complete.
Price reacted from resistance zone (97.470 – 97.576) 🟦.
Minor LQC marked — a close below this level confirms bearish continuation.
🎯 Targets:
First downside target: 97.300 (intra-day liquidity pocket).
Main target: 97.100 🔽.
⛔ Invalidation:
A clean break & hold above 97.576 would shift bias back to bullish intraday.
⚡ Trade Summary:
Looking for short opportunities after this liquidity sweep, aligned with overall bearish momentum. A confirmed rejection from resistance strengthens the short setup. Patience is key — wait for candlestick confirmation before entry.

DXY: Move Down Expected! Short!
My dear friends,
Today we will analyse DXY together☺️
The recent price action suggests a shift in mid-term momentum. A break below the current local range around 97.099 will confirm the new direction downwards with the target being the next key level of 96.993 and a reconvened placement of a stop-loss beyond the range.
❤️Sending you lots of Love and Hugs❤️
