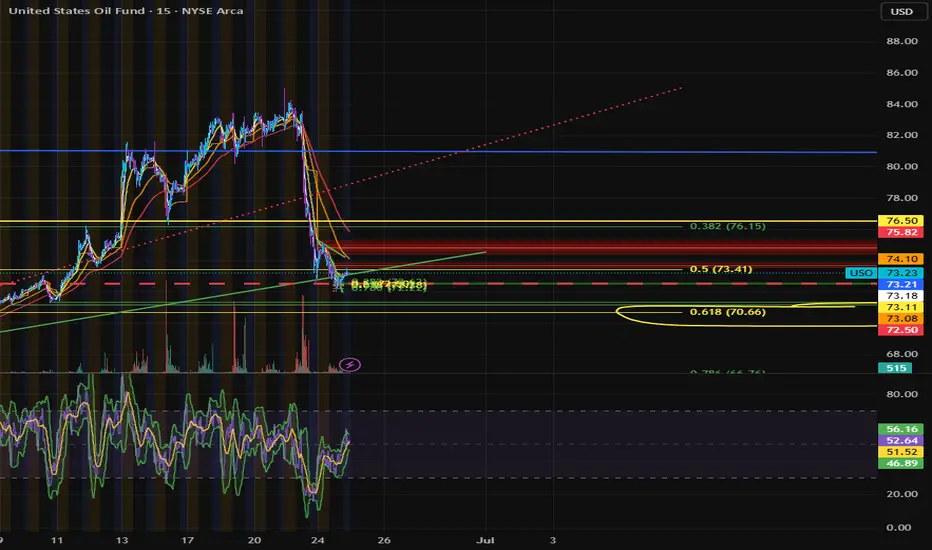
$USO Calls entered 6/24With our current geopolitical standing, the degree of the drop the 23rd-24th of June, and the direction. analysis of the SPX, I believe we have been presented with a very fruitful opportunity. We've seen a NASTY dip after what seems to be a 5 wave move up.
After drawing fib retracements, we closed
Related funds
Major Resistance Test for OilUSO trying to break above the $83 area for the fifth time since 2023 here. If it can manage to do so I'd be expecting a much bigger move. Potentially all the way up to the trendline above or the high from 2022 around $93.
Ideal long entry would be on a break and retest of $83, or just longing on th

$USO to $29-42 before a bottom is inAMEX:USO broke down from a long term that started in March 2020 and is now breaking down below support at $67.
The most likely outcome is a continuation down to the lower support levels at $29-33.
I won't rule out the possibility of one more retest of the trend line ($73-75) before continuing dow

USO Stock Chart Fibonacci Analysis 060225Trading Idea
1) Find a FIBO slingshot
2) Check FIBO 61.80% level
3) Entry Point > 67.8/61.80%
Chart time frame:B
A) 15 min(1W-3M)
B) 1 hr(3M-6M)
C) 4 hr(6M-1year)
D) 1 day(1-3years)
Stock progress:A
A) Keep rising over 61.80% resistance
B) 61.80% resistance
C) 61.80% support
D) Hit the bottom
E

USO long tgt $81I do dowsing & had a date to watch for on Monday 5/5 in USO from a reading I did on 3/25 & it even suggested a swing low! Yay! I don't always get the correct info going into these dates, so I'm hoping this will get more consistent.
Anyway, there may be a spike down in USO in the near future. If so,

US oil roadmap (rough)When it touches the blue lower rail I will buy GTE on the basis the USO ETF looks bullish
Short term bearish af
Long term bullish
Not financial advice

Opening (IRA): USO May 16th -75C/October 17th 45C LCD*... for a 26.25 debit.
Comments: Buying the back month 90 delta and selling the front month strike that pays for all of the extrinsic in the long. (The long call is shown at a higher strike so that it fits on the chart).
Metrics:
Buying Power Effect: 26.25
Break Even: 71.25
Max Profit: 3.75
ROC

Downside tgt hit on USO. Bounce to $70?I've seen so many targets hit and reverse - especially GLD & GDXJ- I figured I may as well see if USO has a similar reversal since the downside target from my last USO idea is tagged & holding.
At the moment I get that it can get back up to the $70-71 area & it's a bull trap.
I also get the date o

USO swing high- short tgt 65-66I asked my dowsing for the next trade to help reach my goal for the year, and it's oil/ USO. I do believe this will include oil stocks, so I may ask for dowsing to choose one from a list. If I do & get the reading done on it, I'll post it as another idea.
My latest work is pretty decent, but a work

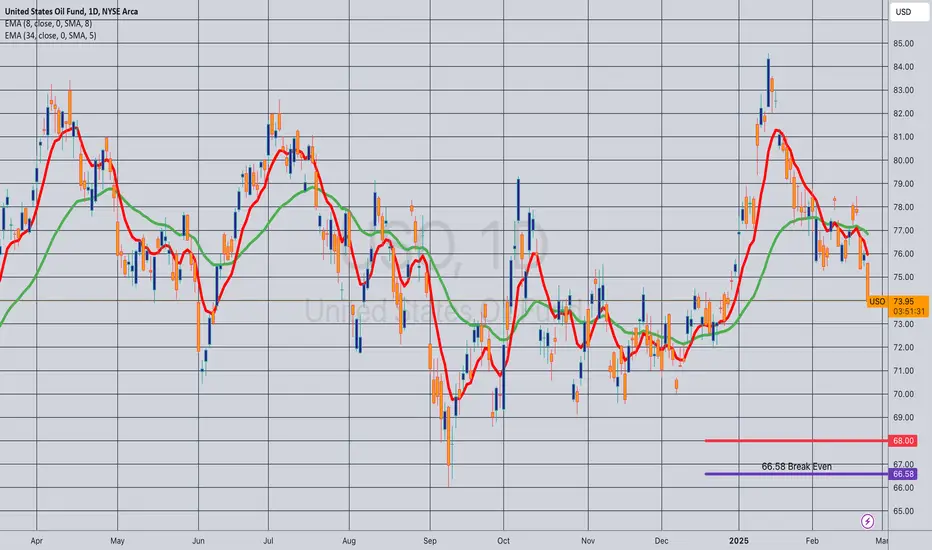
Opening (IRA): USO April 17th 68 Covered Call... for a 66.58 debit.
Comments: With /CL dropping sub-70/bbl., putting on a starter position in USO, selling the -75 delta call against shares to emulate the delta metrics of a 25 delta short put, but with the built-in defense of the short call.
Metrics:
Buying Power Effect/Break Even: 66.58/sha
See all ideas
Displays a symbol's price movements over previous years to identify recurring trends.
Frequently Asked Questions
An exchange-traded fund (ETF) is a collection of assets (stocks, bonds, commodities, etc.) that track an underlying index and can be bought on an exchange like individual stocks.
Since ETFs work like an individual stock, they can be bought and sold on exchanges (e.g. NASDAQ, NYSE, EURONEXT). As it happens with stocks, you need to select a brokerage to access trading. Explore our list of available brokers to find the one to help execute your strategies. Don't forget to do your research before getting to trading. Explore ETFs metrics in our ETF screener to find a reliable opportunity.
No, USO doesn't pay dividends to its holders.