NASDAQ Signal : US 100 H1 / H4 : long !!!Hello Traders! 👋
What are your thoughts on NASDAQ ?
This correction could offer a buy-the-dip opportunity, with potential for a move back toward the recent highs.
NASDAQ ( US100 ) :
Market price : 24400
Buy limit 1 : 24200
buy limit 2 : 24000
Tp1 : 24600
Tp2 : 25000
Tp 3: 25700
Tp 4 : 26300
SL : 23700
Traders, Don’t forget to like and share your thoughts in the comments! ❤️
Remember this is a position that was found by me and it is a personal idea not a financial advice, you are responsible for your loss and gain.
Trade ideas

NAS100 Sits at Key LevelPrice is sitting right on top of major support. This level has been holding up nicely before, and it's also a strong psychological round number, which means buyers naturally defend it harder.
This is where buyers stepped in aggressively the last time. And where reactions tend to be violent.
This is the market literally waiting for a catalyst.
And here’s the important part:
If buyers manage to hold this zone?
We could easily see price pushing back toward 24,750.
BUT…If this support gives way…Then everything changes.
A breakdown here would invalidate the bullish structure entirely and starts a larger bearish move. When a level this strong breaks, it usually drops hard and strong.
So right now, the market is at a crossroads.
A clean break + retest below this level would confirm it.
In short:
👉 Hold the zone → bullish push toward 24,750
👉 Lose the zone → strong bearish continuation

US100 Technical Outlook: Bearish Pullback Inside a Key LiquidityHey traders 👋
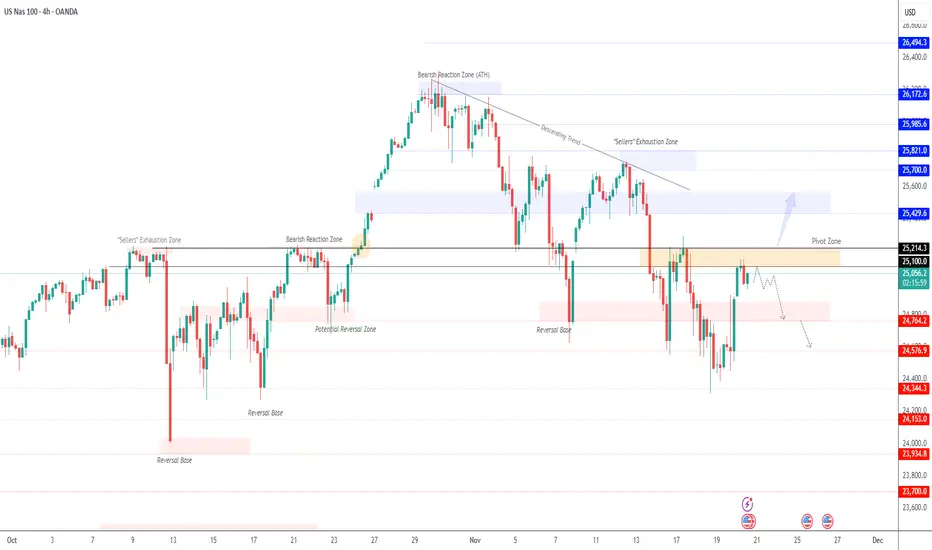
The US100 (NASDAQ 100) is currently sitting in a very interesting technical position on the 4-hour chart.
Let’s break it down 👇
🧭 Structure Overview
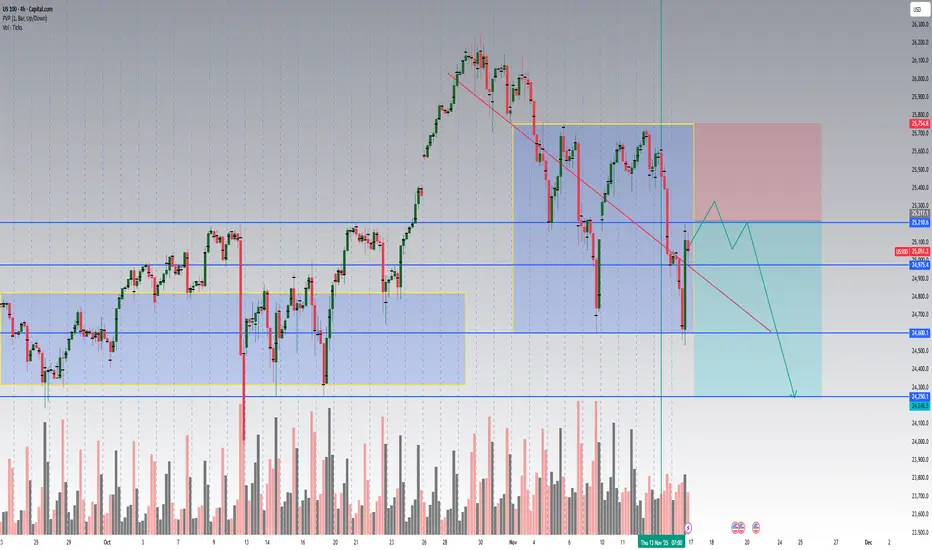
After a strong bullish leg that peaked near 25,800, the index entered a descending corrective channel.
We’ve now hit an important support cluster around 24,975 – 25,000, which previously acted as a pivot zone.
I’ve mapped two main liquidity boxes (blue & yellow) that show where buyers and sellers built positions during the last phases of consolidation.
Notice how price rejected from the upper boundary of the yellow box twice — confirming short-term supply pressure.
📊 Volume Analysis
Volume has been elevated on each red candle, confirming that this down-move isn’t just a retracement without conviction.
However, the most recent bar shows a strong bullish reaction on higher volume, indicating potential absorption — smart money may be defending the 25K handle.
If we see declining volume on the next two green candles → likely dead cat bounce.
If volume expands again above 25,200 → we might get a break and retest of the red trendline for a short-term continuation toward 25,600–25,750.
🧱 Key Levels
Zone Bias Comment
25 210 – 25 220 Resistance Prior liquidity flip zone, possible rejection area
24 975 – 25 000 Current support Reaction zone, watch for confirmation candle
24 600 Target 1 Measured-move projection
24 250 – 24 300 Target 2 Major daily demand zone / possible higher-low base
🔻 Bearish Scenario (Primary Plan)
Short bias remains valid below 25 210.
Expect a short-term bounce into 25 100–25 200, then rejection.
Targets: 24 600 → 24 250.
Invalidation: close above 25 220 on strong volume (would flip the structure bullish).
🟢 Bullish Alternative
If bulls can close a 4H candle above 25 210 – 25 220 with confirmed volume > previous red bar,
the down-channel breaks, and we may see a fast rally back to 25 600 – 25 750.
⚙️ Strategy Note
This chart is for educational & analytical purposes — not financial advice.
I’ll update if we get confirmation on the next 4-hour candle.
👉 Follow for updates and let me know your view — will the 25K zone hold or break next week?
📅 Summary
Trend: Medium-term uptrend, short-term correction
Bias: Bearish below 25 210
Setup: Channel rejection → continuation toward 24 600 / 24 250
Risk: Volume-based breakout above 25 220
Hit 👍 and follow if you found this breakdown helpful — I post detailed NAS100 / SPX / DAX updates every week with volume-based setups.
Let’s grow the community together 🚀
Would you like me to format it with hashtags and keyword tags (so it ranks better in TradingView search, like #US100 #NASDAQ #TechnicalAnalysis #PriceAction #VolumeProfile)? I can add that next.
The Deeper Logic Behind Price Delivery (Nobody Talks About This)Most traders think some pairs are slow and others are fast.
But that belief is the reason they stay confused, lose trades, and can’t read delivery.
The truth is deeper, and once you see it, you can’t unsee it.
This is the real explanation behind timing, alignment, and phase delivery — the part nobody teaches.
Most traders think some markets “move fast” and other markets “move slow.”
That’s a surface-level observation. It sounds true, but it completely misses the deeper mechanics behind why price behaves the way it does.
The truth is this:
Markets don’t move fast or slow — markets move according to timing.
Every pair follows the same structural blueprint.
The only difference is where each pair is within its delivery cycle.
Price is always doing one of two things:
1. Delivering a continuation leg (impulsive, clean, fast movement)
2. Building the pullback leg (corrective, choppy, slower movement)
When a pair is fully aligned on the higher timeframe — when the trend, liquidity objectives, and structural breaks are all synchronized — the continuation phase will always look fast. It’s clean, directional, and decisive because the cycle is ready to deliver.
When a pair is still developing inducements, collecting liquidity, or forming the structure it needs for the next leg, it will naturally look slow or indecisive. Not because the pair is slow, but because the cycle is incomplete.
This is why one pair may be exploding while another is barely moving:
they’re simply in different phases of the same universal process.
Price is never random.
Price is never “lazy” or “weak.”
Price is simply obeying its timing.
Higher timeframes reveal that timing.
They show you:
• Whether continuation is ready
• Whether the pullback is still developing
• Whether liquidity has been engineered
• Whether the dominant leg is prepared to deliver
• Whether the cycle is aligned or still maturing
Lower timeframes only express what the higher timeframe already decided.
So the idea that “some pairs move fast and some move slow” is a misunderstanding. No pair is naturally fast or slow — every pair delivers exactly the same way, just not at the same time.
Fast movement = HTF alignment + continuation phase
Slow movement = HTF development + liquidity engineering phase
Once you understand timing, you stop comparing pairs by their speed and start reading them by their position in the cycle.
That’s when trading stops being guesswork and starts becoming recognition.
Because the deeper truth is simple:
Price isn’t unpredictable — traders are just unaware of what time it is.
-Do you view the market by timing or by “speed”?
Let me know — I read every comment.
#NAS100 #Education #SMC #MarketTiming #PriceAction #SmartMoney #Forex #Indices
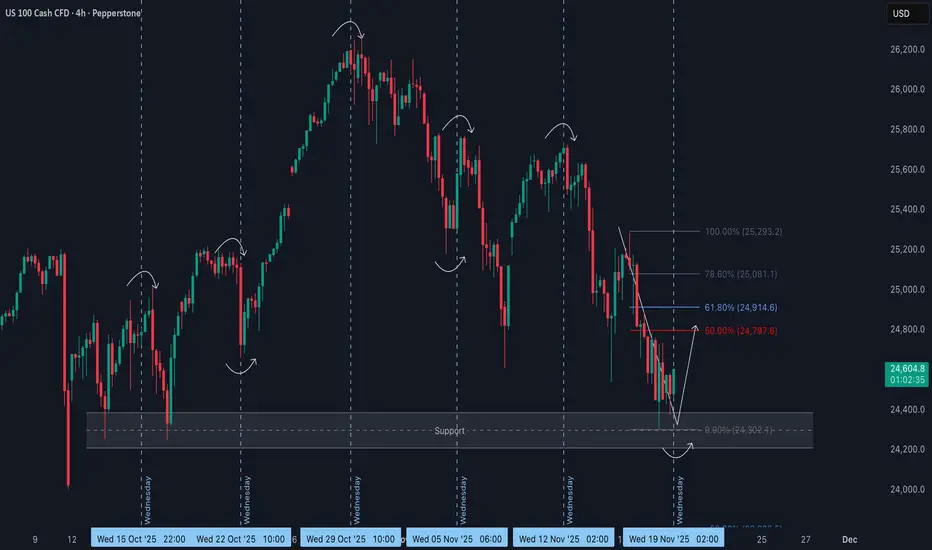
NAS100 Wednesday Reversal Potential from Key SupportOver the past several weeks, the NAS100 has shown a clear tendency for aggressive mid-week reversals, with Wednesdays repeatedly triggering sharp shifts in direction 🔄. This pattern suggests a strong time-based element in the algorithmic delivery of price, rather than random fluctuation.
🗓️ Each Wednesday has produced a notable reaction, whether through a liquidity grab, a stop run, or a full intraday reversal. With today being Wednesday once again, the timing aligns perfectly with the type of behaviour the market has been delivering consistently.
📉 The current decline has brought price directly into a well-defined high-timeframe support region. This area has a history of accumulation and typically holds a large amount of resting liquidity underneath it. The repeated wicks into this zone resemble classic Wyckoff spring behaviour 📦 — a sweep of sell-side liquidity followed by a potential response from larger players.
📐 The most recent bearish leg is noticeably overextended and has not offered a proper retracement since breaking lower. This leaves inefficiencies behind and increases the likelihood of a move back toward equilibrium.
🔄 Given the confluence of mid-week timing, the tap into higher-timeframe support, the liquidity sweep, and the extended nature of the current downswing, the expectation is for at least a corrective move back into equilibrium 📈.
A bullish break of short-term structure on the lower timeframes would strengthen this bias and open the door for a retracement into the premium levels listed above.
⚠️ Not financial advice. This is simply a technical outlook and my opinion.
NAS100 LONG SETUP Price continues to follow the uptrend on D1. After rejecting 26... price retraced to the 24... region meeting a stable support there to form a double bottom

NAS100 Trade Opportunity: Will Buyers Defend the Pullback?📊 NAS100 (NASDAQ-100) Swing Trade Opportunity 🚀
Bullish Pullback Setup | Super Trend ATR + TMA Confirmation
🎯 TRADE SETUP OVERVIEW
Instrument: NAS100 (NASDAQ-100 Index)
Timeframe: Swing Trade (4H-Daily)
Bias: BULLISH ✅
Setup Type: Super Trend ATR Line Pullback + Triangular Moving Average (TMA) Confirmation
🎬 ENTRY STRATEGY - "LAYERING METHOD" 📍
This strategy employs multiple limit order placement (Layer Entry Technique) to optimize entry points during the pullback phase.
Recommended Layer Entry Points:
🔵 Layer 1: 24,500
🔵 Layer 2: 24,600
🔵 Layer 3: 24,700
🔵 Layer 4: 24,800
⚡ Pro Tip: Scale layers based on your account size and risk tolerance. Each layer reduces average entry price.
🛑 STOP LOSS (SL)
Primary SL Level: 24,300
Strategy: Placed below the latest swing low + Super Trend confirmation
⚠️ DISCLAIMER: This SL is a guideline only. You must adjust based on your personal risk management strategy and account equity. Risk is YOUR responsibility.
🎁 PROFIT TARGETS (TP)
PRIMARY TARGET (TP1): 25,700 🎯
First resistance zone
Ideal for taking partial profits
Recommended exit: 30-50% position
SECONDARY TARGET (TP2): 26,200 🔥
Strong resistance + Historical overbought zone
⚠️ TRAP ALERT: Expect potential reversal or consolidation
Recommended exit: Remaining 50-70% position
Use trailing stop for final portion
📈 TECHNICAL CONFIRMATION
✅ Super Trend ATR: Aligned bullish
✅ TMA (Triangular MA): Pullback to key level confirmed
✅ Higher Lows Pattern: Intact
✅ Volume Analysis: Supporting move
🔗 RELATED PAIRS TO WATCH 💡
Positive Correlation (Move Together):
🔴 SPY (S&P 500 ETF) - $380-395 Range
Correlation: +0.92 | Often leads NAS100 lower-cap stocks
Key Point: If SPY breaks $390, expect NAS100 momentum confirmation
Watch for divergence signals
🔴 QQQ (Invesco QQQ Trust - Nasdaq 100 ETF) - $450-470 Range
Correlation: +0.99 | DIRECT tracking of NAS100
Key Point: Primary barometer for Nasdaq sentiment
Use for volume + volatility confirmation
🔴 TECH Sector ETF (XLK) - $205-215 Range
Correlation: +0.88 | Tech-heavy holdings overlap
Key Point: Tech rotation affects Nasdaq flow
Monitor for sector strength/weakness
Inverse Correlation (Move Opposite):
🔵 DXY (US Dollar Index) - $103-106 Range
Correlation: -0.65 | Stronger dollar = Risk-off mood
Key Point: If DXY spikes, expect NAS100 pullback extension
Monitor Fed rate expectations
🔵 TLT (20+ Year Treasury ETF) - $75-80 Range
Correlation: -0.58 | Rising yields hurt growth stocks
Key Point: Check 10Y yield trend for rate pressure
Watch Fed policy announcements
Key Monitoring Points:
📌 Earnings Season Impact: Tech earnings can create ±2% moves
📌 Fed Minutes/Announcements: Watch for rate guidance changes
📌 Market Breadth: Compare Advance/Decline lines for confirmation
📌 Volatility Index (VIX): Levels above 20 = Caution; Below 15 = Risk-on
📋 BEFORE YOU TRADE - CHECKLIST ✅
Is price currently at/near Layer 1 entry (24,500)?
Does current 4H chart show TMA pullback + Super Trend confluence?
Is volume confirming the setup?
Have you set your SL below 24,300?
Do you understand you're risking X to make Y?
Is this aligned with your trading plan?
🎓 FINAL NOTES
This is a mechanical swing trade setup designed for traders who use limit orders and layering technique. The confluence of Super Trend ATR + TMA creates higher probability entries during bullish pullbacks.
Remember: Trading involves substantial risk of loss. This idea is shared for educational analysis. Your trading decisions are YOUR responsibility alone.
Happy Trading! 🚀💎

NDQ Short catching the sweet double topChart says it all , attempt to catch a double top on NDQ.
Tight stop loss is a must.

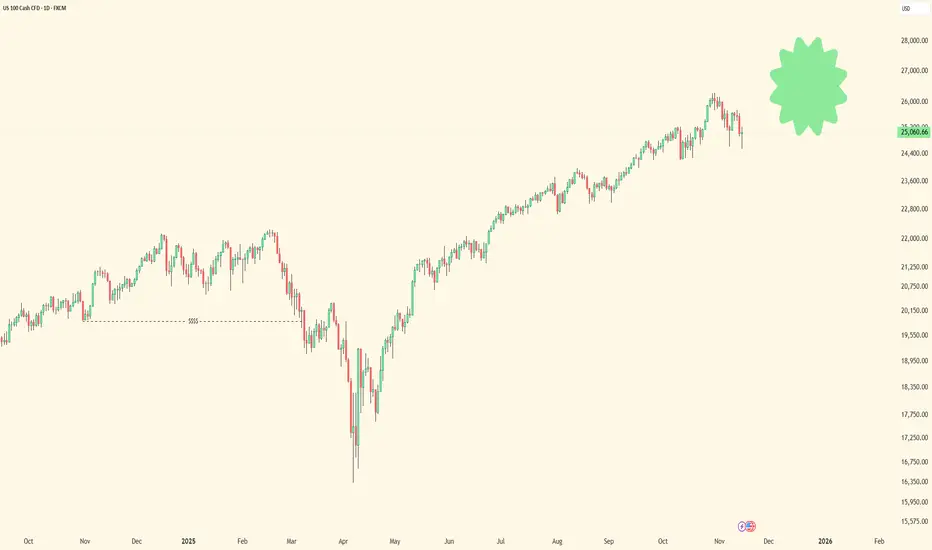
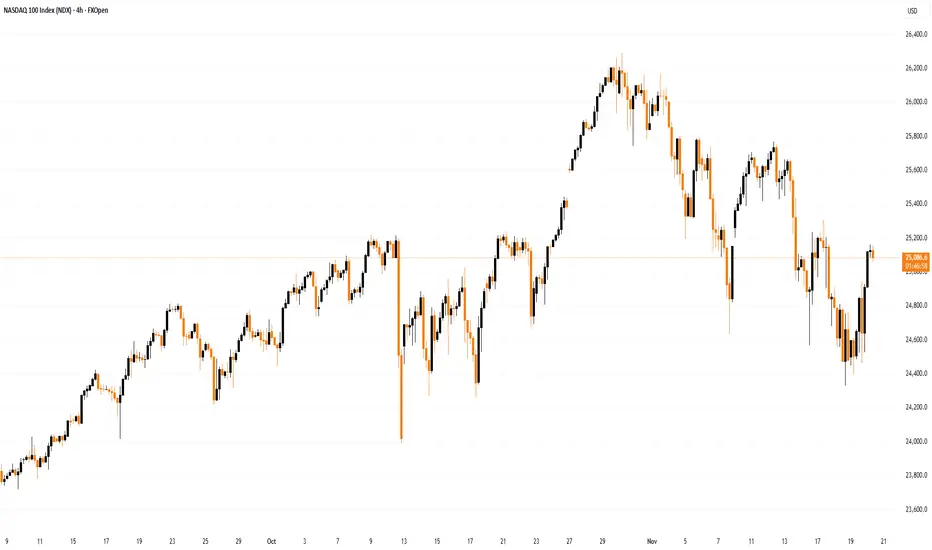
NDX - 92% From ZeroI want you to always remember one thing:
Wherever the price goes, it’s always 100% from zero.
That’s why every now and then you need to take the chart off log and look at it with fresh eyes.
Occam’s razor.
I keep hearing the PERMA-BULL crowd screaming that “the bears are calling this an AI bubble,” and in the same breath whining that the pullback is “overdone” or “extreme.”
Really?
The S&P is down 5%, and they’re already crying about the bears?
SMH.
It’s all strawman nonsense. Don’t fall for it.
Take it off log…
Remember everything is 100% from zero…
Use your basic, instinctive judgment…
And then ask yourself what your eyes are telling you when you look at this chart.
That’s the truth — not the narratives.
THANK YOU for getting me to 5,000 followers! 🙏🔥
Let’s keep climbing.
If you enjoy the work:
👉 Boost
👉 Follow
👉 Drop a solid comment
Let’s push it to 6,000 and keep building a community grounded in truth, not hype.
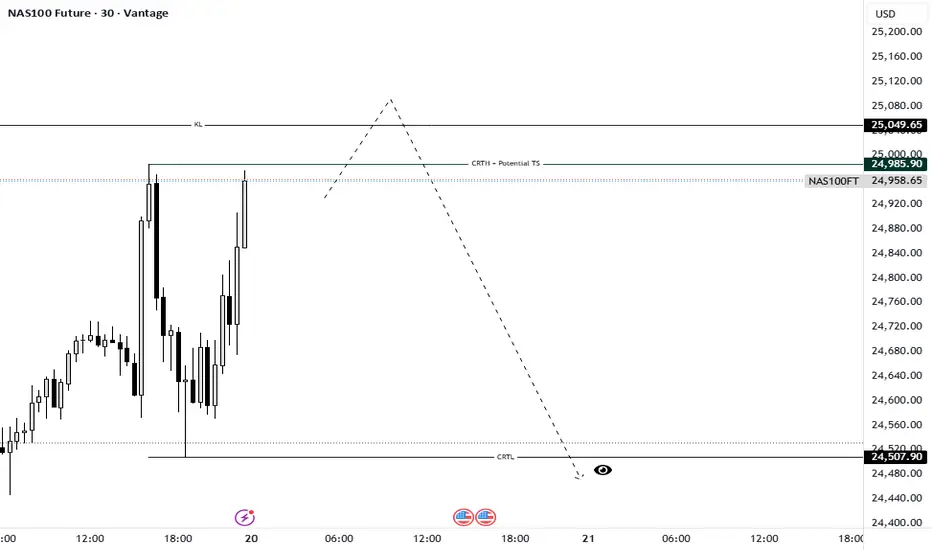
NAS100 Future: Waiting for the Turtle Soup Short SignalTimeframe: 30M | Model: Potential Turtle Soup (TS) / Bearish Model #1 Setup
The Nasdaq is setting up a crucial liquidity event that aligns perfectly with the CRT Manipulation (Candle 2) phase. We are currently consolidating just below a major structural high, which is acting as a magnetic zone for stops.
Here is the speculative short thesis:
The Trap Zone: The level at 24,985.90 is marked as the CRTH (Candle Range Theory High) and our "Potential TS" line. This is where most early breakout traders will place their buy stops, or where swing traders will look to enter short.
The Liquidity Hunt: We anticipate the market will execute a Turtle Soup—an aggressive spike above 24,985.90, potentially reaching the secondary resistance (RL) at 25,049.65, before immediately failing. This sweep is required to fuel the subsequent massive drop.
The Trigger (Bearish Model #1): Our entry signal (the Bearish Model #1) will only be confirmed IF price closes decisively back below the CRTH line after the liquidity sweep (the failure candle).
Targets:
Primary Objective (CRTL): If the Turtle Soup and reversal confirm, we expect a strong, fast drop (the Distribution, or Candle 3, phase) targeting the CRTL (Candle Range Theory Low) at 24,507.90. This low is holding significant Sell Side Liquidity (SSL).
Discipline: This is a high-risk, high-reward setup. Do not enter until the Turtle Soup has completed and the Bearish Model #1 reversal candle has closed. Patience is required to avoid being the liquidity that fuels the institutional move.
Wait for the Sweep. Trade the Reversal.
Greetings,
MrYounity
US100 Resistance Cluster!
HI,Traders !
#US100 made a bullish
Rebound But has now Near hit a resistance
Cluster of the horizontal and
Falling resistance lines
Around 25395.4 area From where we will be
Expecting a bearish move down !
Comment and subscribe to help us grow !

NASDAQ Can the 1D MA50 give one more rally??Nasdaq (NDX) has been trading within a 6-month Channel Up and Friday saw the price breaking below its 1D MA50 (blue trend-line) and the pattern, but managed to close back above it for the 2nd time in a week (blue circles).
This resembles the September 02 break, which eventually also closed above it and initiated a +9.59% Bullish Leg. With the 1D RSI also testing a similar Support Zone with September's, we expect the index to initiate the new Bullish Leg, as long as it continues to close its daily candles above the 1D MA50.
Our Target is 26900 (+9.59%).
---
** Please LIKE 👍, FOLLOW ✅, SHARE 🙌 and COMMENT ✍ if you enjoy this idea! Also share your ideas and charts in the comments section below! This is best way to keep it relevant, support us, keep the content here free and allow the idea to reach as many people as possible. **
---
💸💸💸💸💸💸
👇 👇 👇 👇 👇 👇

Nasdaq 100 Under PressureNasdaq 100 Under Pressure
As the chart shows, the Nasdaq 100 index fell today (point 3) to its lowest level in a month, making it the weakest performer among the major US indices. The sell-off in the technology sector has been driven by a double blow:
→ A reassessment of expectations for the Federal Reserve’s next rate move. According to market observers, the probability of a Fed rate cut on 10 December continues to decline and now stands at 43%, compared with 62% a week earlier.
→ Growing scepticism about the valuations of companies linked to artificial intelligence. A Bank of America fund managers’ survey revealed heavy overcrowding in tech: 54% cited “long Magnificent 7” as the most crowded trade, while 45% viewed an AI bubble as the biggest tail risk.
Technical Analysis of the Nasdaq 100 Chart
When analysing the hourly chart of the Nasdaq 100 on 10 November, we identified an ascending channel. However, mounting selling pressure has resulted in:
→ the channel being extended downwards;
→ its former lower boundary (which acted as support) now acting as the median line and serving as resistance.
From the demand perspective:
→ The lower boundary of the expanded channel may prevent a deeper bearish move.
→ The chart shows a sequence of false bearish breakouts (1–2–3), where the price dips slightly below the previous low only to reverse sharply upward — signs of a Liquidity Grab pattern that may indicate buyer aggression.
From the supply perspective:
→ The 25220–25415 zone appears to be a confirmed FVG area, where a clear market imbalance emerged and sellers strongly dominated.
Bulls may attempt to push the Nasdaq 100 back into the ascending channel, but whether this scenario plays out will largely depend on Nvidia’s quarterly earnings report — a key event for the technology sector, scheduled for release tomorrow.
This article represents the opinion of the Companies operating under the FXOpen brand only. It is not to be construed as an offer, solicitation, or recommendation with respect to products and services provided by the Companies operating under the FXOpen brand, nor is it to be considered financial advice.

USNAS100 –Key Breakout Levels | Bearish Below 25100 Ahead of NFPUSNAS100 | OVERVIEW
NASDAQ futures surged as Nvidia’s strong earnings eased concerns of an AI-driven market bubble, boosting overall tech sentiment.
Markets are now shifting attention to the NFP and U.S. jobs report, with expectations of elevated volatility throughout the NY session, especially given Nvidia’s strong influence on tech stocks.
Technically:
Below 25100: Bearish continuation toward 24880 → 24760 → 24350
Above 25215: Bullish breakout toward 25430 → 25650 → 25700
Pivot: 25100
Support: 24880 · 24760 · 24350
Resistance: 25220 · 25430 · 25650
USNAS100 stays bearish under 25100; only a confirmed close above 25215 will signal bullish continuation.
Why Markets Struggle After a Big Drop (NASDAQ Case Study)Understanding liquidity, distribution phases and market-maker behavior
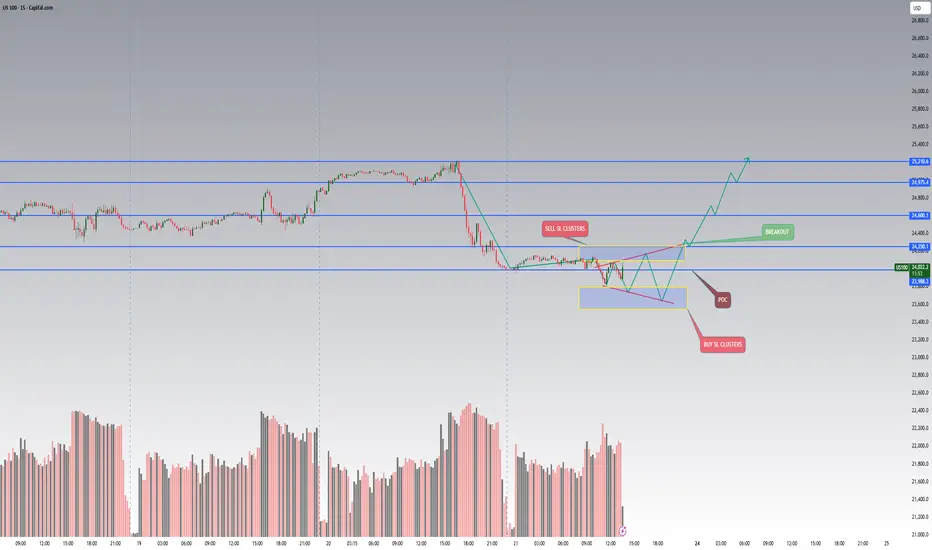
After the NASDAQ fell sharply from 25 000 to 24 000, many traders were surprised why the market suddenly stopped moving and started to “chop” around the same area.
But this behavior is not random — it’s a structural problem inside the order-flow.
1️⃣ Markets can fall fast — but they cannot continue without liquidity
Every trade in the market has a counter-party.
If traders want to buy the dip, someone must sell to them.
After a large drop, fewer participants are willing to sell at the new low prices.
Institutions are often already hedged or already sold during the fall.
Market makers cannot force liquidity out of thin air — they must create it.
This leads to a distribution phase, where price stops trending and starts rotating around a key area.
2️⃣ Why distribution forms around the Point of Control (POC)
When aggressive hedging is finished and volatility slows down, the market enters a phase where:
Price rotates around the Point of Control (POC)
Volume increases
Market makers attempt to rebuild liquidity on both sides of the range
This is not accumulation or re-accumulation — it is a liquidity-engineering phase.
Market makers need enough:
Buy-side liquidity above POC (stop losses of shorts, breakout traders, trapped buyers)
Sell-side liquidity below POC (stop losses of longs, late dip-buyers, liquidation clusters)
Without these pools, the market cannot initiate the next impulsive move.
3️⃣ The problem with sell-side liquidity after a big fall
When NAS dropped from 25k → 24k:
Most weak longs were already liquidated
Many sellers closed positions or took profit
Fresh shorts hesitate to enter at the lows
Institutions are waiting for better prices
This creates a liquidity vacuum.
To solve this vacuum, the market “mirrors” trades inside the range:
Price moves up → build stops above
Price moves down → build stops below
Repeated sweeps → fill both sides of liquidity
Only after enough stop-loss clusters form, the market is capable of moving again with real momentum.
4️⃣ What this means for traders
This is not a buy or sell signal.
It’s an explanation of why the market becomes extremely slow, sideways or manipulative after a big impulsive move.
In this phase:
Breakouts usually fail
Trend trading performs poorly
Range traps occur frequently
Market reacts strongly to liquidity pockets, not fundamentals
The key is to understand what the market is missing:
➡️ Not direction.
➡️ Not fundamentals.
➡️ But liquidity.
Until the liquidity pools are recreated, the next real directional move cannot start.
5️⃣ Final takeaway
A strong decline does not end because “buyers step in.”
It ends because no more sellers exist at those levels, forcing market makers to rotate price and rebuild the order-book.
Learning to identify these liquidity-reset periods helps traders avoid:
Chasing breakouts
Entering too early
Getting trapped during fake momentum
Misreading sideways distribution as a reversal
SELL NAS100 - WE TRY AGAIN!Good afternoon Traders
Trade what you feel and not what you see.
Good luck.

NAS100 Trade Set Up Nov 17 2025Price swept PDH and is pushing down towards 1h FVG which i will want to see tested before looking for a reversal back up. There is a daily FVG that will need to be filled this week at 25,800

Tech Stocks Rally After Nvidia’s Earnings ReportTech Stocks Rally After Nvidia’s Earnings Report
As the chart shows, the Nasdaq 100 index is displaying positive momentum today. A strong catalyst for growth arrived with the release of Nvidia’s quarterly report, which exceeded Wall Street’s optimistic expectations.
Nvidia reported quarterly revenue of $57bn (vs. the expected $54.9bn), and earnings per share of $1.30 (forecast: $1.26). Meanwhile, CEO Jensen Huang stated that demand for the new Blackwell chips is “off the charts”.
Nvidia’s strong report revived “risk appetite” in the tech sector and eased concerns about a potential AI bubble.
Technical Analysis of the Nasdaq 100 Chart
Analysing the hourly chart of the Nasdaq 100 two days earlier, we:
→ noted that the previously active upward channel had broadened downwards;
→ suggested a scenario in which the bulls might attempt to return the index to an upward trajectory if Nvidia’s quarterly results were strong.
Yesterday’s report from the equity market leader confirmed that demand for artificial intelligence infrastructure remains enormous, paving the way for the tech-sector rally to continue.
From the standpoint of supply pressure, resistance may come from:
→ the upper red line drawn through the lower November highs;
→ the 25,400 level, which had acted as local support but was decisively broken by a large bearish candle.
On the other hand:
→ the decline towards 24,400 once again activated buying interest;
→ the November drop may prove to be only an intermediate correction, after which the upward trend could resume.
Whether the bulls can maintain positive momentum in the Nasdaq 100 following Nvidia’s strong quarterly figures will depend largely on the outcome of the delayed September US employment report, postponed due to the shutdown.
This article represents the opinion of the Companies operating under the FXOpen brand only. It is not to be construed as an offer, solicitation, or recommendation with respect to products and services provided by the Companies operating under the FXOpen brand, nor is it to be considered financial advice.
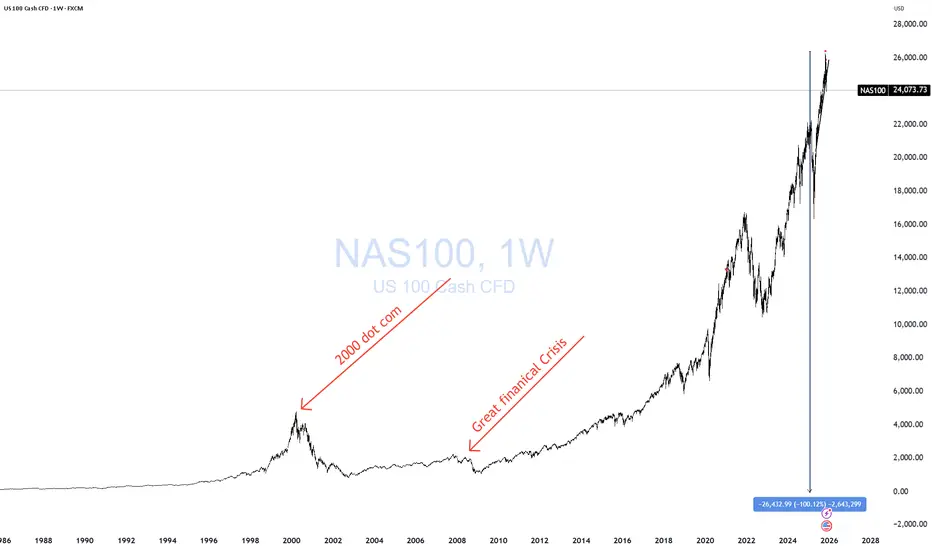
DECODED ANALYSIS OF NDX (NASDAQ) DECODED ANALYSIS OF NDX (NASDAQ)
The quarterly first grand pattern is currently in its second last stage, a dip is required, after which a significant upward move will follow.
The key decoded support level is $14,717 in Q4 2026.
Once this grand pattern completes, approx 70% correction will occur, initiating a new grand pattern.That final cycle takes decades to complete it's uptrend.
This message is for educational purposes only, always DYOR.

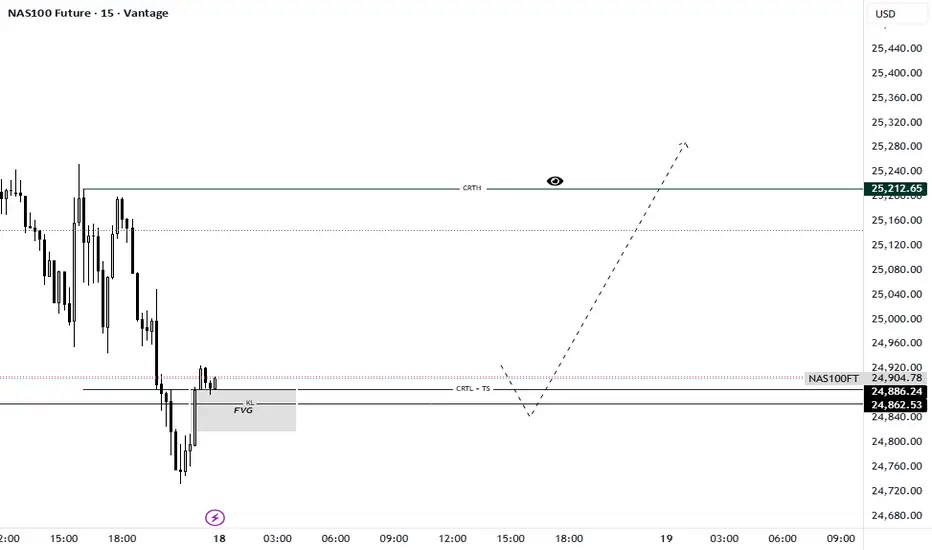
NAS100 Future: The Model #1 Bounce at CRTL SupportTimeframe: 15M | Model: CRT Model #1 / Turtle Soup Reversal
The Nasdaq Index is presenting a high-probability Candle Range Theory (CRT) setup after an aggressive drop. The price action perfectly encapsulates the Manipulation (Candle 2) phase and is setting up for the explosive Distribution (Candle 3) move.
The market has completed a textbook Turtle Soup (TS), aggressively pushing below the structural support to liquidate short-term positions. This hunt was contained by the confluence of the CRTL (Candle Range Theory Low) and a strong underlying Fair Value Gap (FVG).
Here’s the step-by-step breakdown (The CRT Checklist):
Liquidity Sweep: The deep wick confirms the Turtle Soup, clearing the stops below the previous support area around 24,862.53.
Confluence: The reversal attempt is happening right off the FVG area, giving high confidence to the long thesis, as outlined in the CRT Secrets Series (Episode 5: Key Levels).
The Trigger: We are now waiting for the final confirmation—the bullish Model #1 candle close. This candle must reverse the market structure and close decisively above the manipulation low (back into the range).
Targets:
Primary Objective (CRTH): The target is the CRTH (Candle Range Theory High) at 25,217.65, aiming to fill the liquidity above the initial range high.
Mindset: As the chart suggests, this reversal setup has the potential for a swift expansion move, seeking higher liquidity pools.
Discipline: Avoid the temptation to enter early. We must wait for the Model #1 candle to close and confirm the shift in control from sellers back to buyers. Trade what you see, not what you think!
Trade Smart. Trust the Candle Close.
Greetings,
MrYounity
NAS1001. HTF crt forming + key level
2. LTF crt + csd
Entry on the second candle of a crt (AMD) Manipulating waiting for distribution


Nasdaq : 24,000 Holds Strong — Next Stop 25,800?Price action on the Nasdaq 100 is telling a clear story: 24,000 (AVWAP + HVN confluence + Round number) is acting like a magnet for institutional buyers.
This suggests that accumulation is happening at these levels, positioning for a potential run toward 25,800 if momentum holds.
Are we front-running a breakout, or should we wait for confirmation above 25,000 first?
