ETHBTC Technical WeeklyThe most prominent feature is a clear Inverse Head and Shoulders (H&S) pattern. This is a classic bullish reversal pattern that forms after a downtrend, signaling a potential shift towards an upward trend.
The thick red descending trendline from the top of the chart indicates the long-term downtrend. The price is currently trading below this resistance line. A break above both the Inverse H&S neckline (0.04191) and this descending trendline would provide very strong bullish confirmation.
The ETHBTC weekly chart presents a highly bullish setup with the formation of a confirmed Inverse Head and Shoulders pattern.
Bullish Scenario: A decisive weekly candle close above the neckline at 0.04191 would confirm the pattern and likely lead to a significant rally. The initial target for this move would be around 0.06020. This would imply that Ethereum is likely to outperform Bitcoin in the coming period.
Bearish Scenario: Failure to break the neckline and a potential rejection could see the price drop back to test the support levels of the Right Shoulder, possibly around 0.03440. A move below this level could invalidate the pattern and signal continued consolidation or a resumption of the downtrend, though this appears less likely given the pattern's development.
Trade ideas

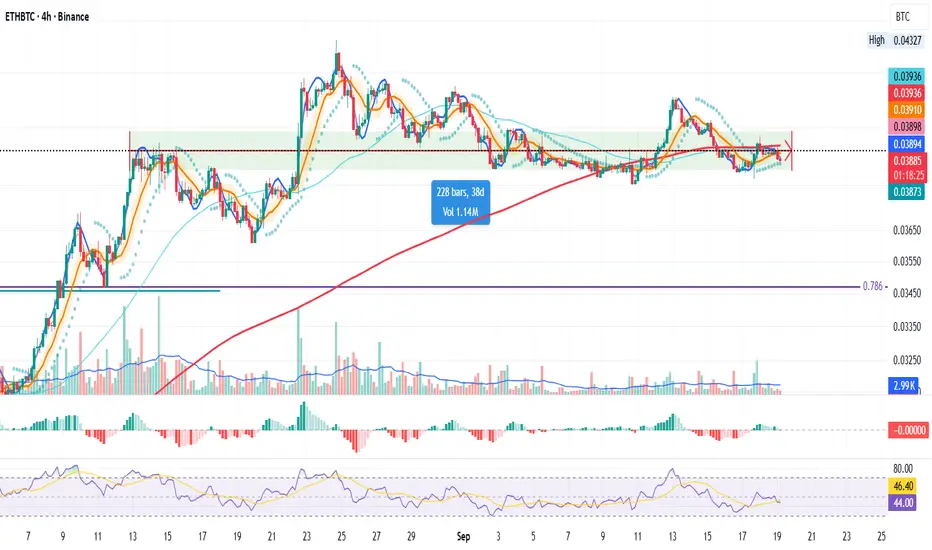
ETH SERIES | Part 2 – ETH/BTC (4H)
Same 40-day window as ETH/USDT, but here price looks worse:
Still under the 200MA
About to lose the green support zone
This confirms my no-long stance on ETH/USDT.
Short is tempting, but staying cool & pressure-free.
Next episode → ETH/SOL for more context.
Always take profits and manage risk.
Interaction is welcome.
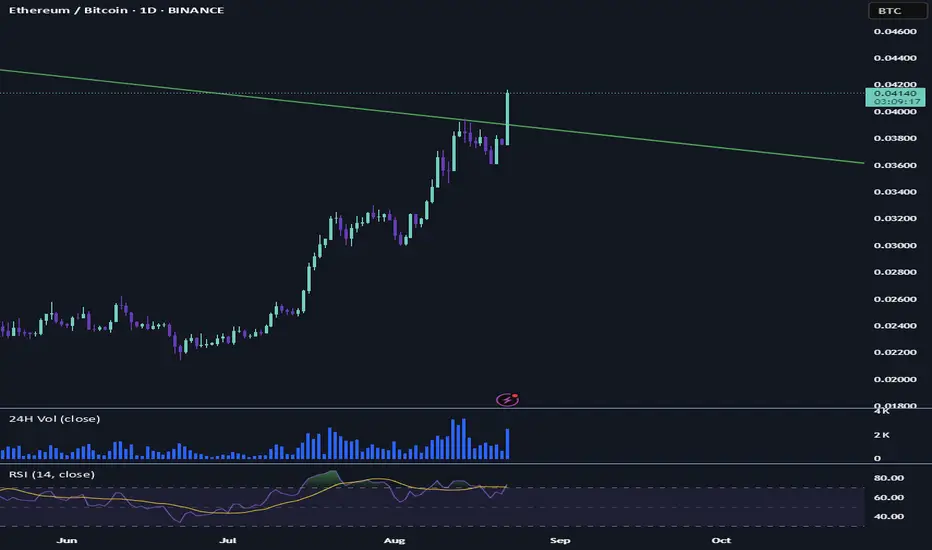
ETHBTC break of resistance from 2022! With todays push upwards BINANCE:ETHBTC finally broke the downward resistance since - get this - September 2022. This is huge IF it materializes. What do I mean?
In the daily and every other timeframe we can expect a continuation of some sort if the day closes above the resistance - which is in eth terms around 4800, but better - in ethbtc terms it means 0.0395 (it currently is at 0.041)
let's hope - even tho the september correction looms over our heads (or a potential one) a rally could go for the following week - and maybe even into the first week of september if everthing goes right.
ETH/BTC pullback seems to be over ETH/BTC pullback seems to be over 🚀
The downtrend line has been broken and a new move is starting.
Key levels ahead will confirm if this momentum is sustainable.

ETHBTC - Upward Movement Using this curved channel to show a target
This works well with the horizontal line at prior peaks
ETHBTC could move up to 0.08 - 0.10 as we head into a very strong alt season
The RSI also shows itself within a downward channel but support will be found at the middle line of the channel, allowing further movement up. Top of the channel being hit on the RSI is likely.
Very bullish on ETH.

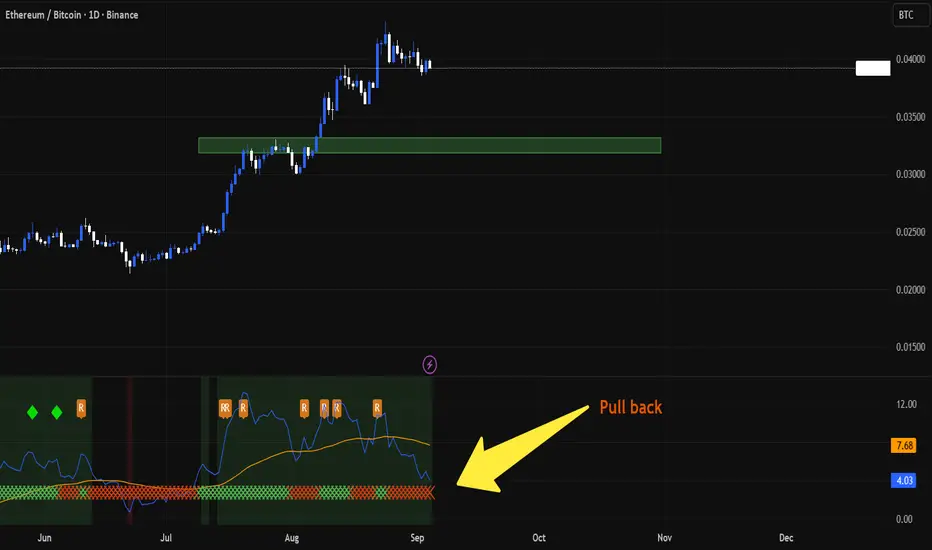
ETH/BTC Daily UpdateAccording to the New RSI indicator, Ethereum is pulling back with strong momentum against Bitcoin. 🚀📉
⚠️ This means Ethereum could see deeper downside in the coming pullback.
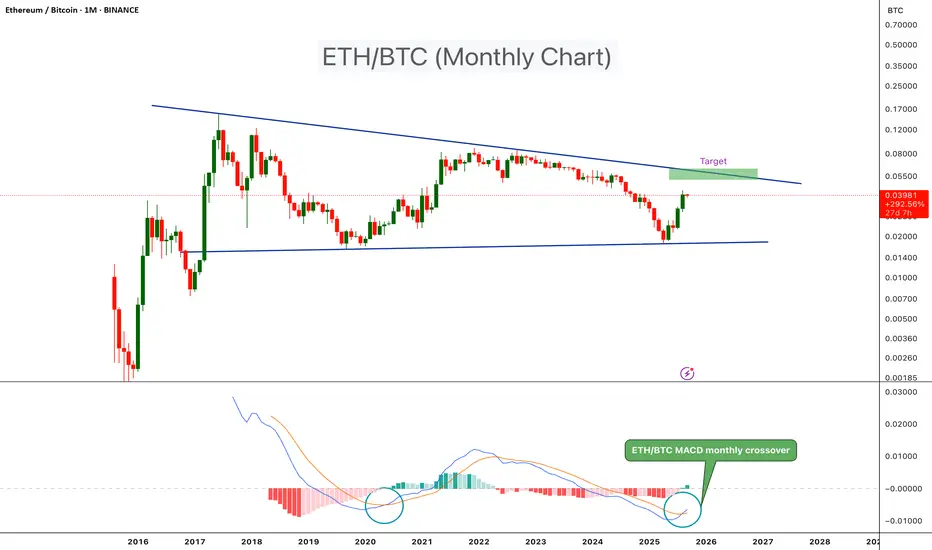
Ethereum Showing Strength Against BitcoinETH/BTC pair is trading within a long-term triangle pattern. A few months ago, price bottomed out at the triangle support and has since bounced, with the pair now trading around the 0.039 level.
On the monthly timeframe, a bullish MACD crossover has just appeared. This is a strong signal that ETH could start outperforming BTC in the near term. The last time a similar crossover occurred was in June 2020, which was followed by a powerful rally in ETH.
Looking ahead, the next major resistance for ETH/BTC is near the 0.060 level. If bullish momentum continues, price could test this zone in the coming months. This resistance area may also act as the potential peak for ETH in this bull run cycle.
ETH/BTC Pullback WatchLook at the ETH/BTC charts. Every rally in history had pullbacks. Doesn’t mean it has to happen again, but ignoring it is how you get smoked. If it dumps, let it dump. The market doesn’t care about your feelings.

ETH/BTC trendEverything will lose to btc over time?? Or? Total 2 (mkt. minus btc) is at all time high atm. When it breaks could eth/btc break out of the ongoing downward trend. Also as btc.d falls could see a small recovery before eth/btc could keep trending down again.

ETH parabolic advanceThere seems to be a deviation from the previously communicated ETH BTC parabolic advance.
However, the prior curve fitting was tentative and there may still be a lot of steam in ETH BTC to the .05188 range by mid/late October
Sharing an updated alternative curve that does retain a parabolic advance, even with the price action between prior publication and today.
Will increase exposure to ETH after exiting, should the ETH BTC pair demonstrates fit to the new parabolic advance.

ETH/BTC Price Prediction - 1W**** Yousef Sharafi ****
There is a possibility of revision. The decline in Ethereum’s price alongside the rise (or stagnation) of Bitcoin’s price.
Follow me here for more analysis

$ETHBTC - Weekly ChartBINANCE:ETHBTC | 1w
We got our initial test of the breakdown area, rejecting from lower band of anchored vwap.
Ideally, a proper retest of .030 to .026 before moving higher.
for CRYPTOCAP:ETH , I think it can drop to 4k-3.8k

ETH BTC parabolic advance to watchShorter deviations may be possible due to curve fitting and shock events should be adjusted for but parabolic advance seems strong and worth noting.
Could do another 50% BTC denominated from here.

ETH vs BTC, Trend shift?📝 After months of underperformance, we're finally seeing some relative strength from ETH vs BTC.
📍ETH/BTC has bounced off a key historical support zone — a level that previously marked major reversals in the cycle.
📈 While the bounce is still in early stages, it breaks the streak of lower lows and gives hope for a trend shift. If we apply the logic of diminishing returns, even a conservative positive scenario suggests a potential move of +150–200% from the bottom, aligning with previous cycle rebounds.
💡 It’s still too early to call a full rotation, but this is the first sign of real momentum from Ethereum in a long time. Worth keeping an eye on.

ETH/BTC — the comeback is real? We’re seeing a strong weekly bounce off the macro demand zone (~0.023 BTC) — and this isn’t just a reactionary wick.
📈 +75% from the bottom
📍Testing mid-range resistance near 0.041–0.043 BTC
📊 Weekly momentum picking up, but this is where decisions happen
Let me be real with you:
🧠 This chart tells a story Ethereum has been bleeding vs BTC for 2 years straight. Now it's trying to reclaim relevance.
👀 But we’re also approaching a cluster of historical supply zones. The next few candles will define whether this is just a relief rally… or the start of ETH rotation.
What I’m watching:
✅ Flip of 0.043–0.045 = bullish continuation
⛔️ Rejection here = potential lower high and another leg down
I'm staying neutral but alert. The ETH/BTC pair often front-runs macro altcoin rotations and if this breaks out, alts could follow.

40% Upside Target for Ethereum Welcome All
In this video I zoom in on ETH on the weekly and highlight a key area to the upside of where I anticipate a good reaction .
In between that upside target there is every chance of pulling back for a higher low before that continuation .
Tools used in the video Fibonacci , Speed fan , Volume profile + Anchored vwap .
Each tool used delivered a solid confluence up at that marked target .

A return to major structure provides a =SELL opportunity ## 📊 ETH/BTC Analysis - 1H Chart
### 🏗️ Major Structure Breakdown
**1️⃣→3️⃣ Major Structure Push Down** 📉
- ⬇️ Downtrend established
- 💀 Buyers from 1️⃣ got absolutely REKT
- 🦈 Sellers at 2️⃣ = **"BIG BOSS"** of the chart
- 👑 These are our MAJOR SELLERS to watch
**3️⃣→6️⃣ Buyer Retest Rally** 📈
- 🐂 Buyers entered at 3️⃣
- 🎯 Return to 2️⃣ major sellers zone
- ❓ Key Question: Is price still too expensive at 2️⃣?
### 🔮 What I Think Happens Next
**🎯 Primary Scenario:**
- 📍 Return to major structure = bearish continuation likely
- 📉 Expecting move below 3️⃣
- 🔄 OR at least a double bottom retest of 3️⃣
### 🧮 Probability & Confluence Stack
**🍊 Chaos Theory Says:**
- 📊 57% chance to travel to zone below if we close below current zone
- 📈 Based on 2,500 previous bars of data
- ✅ Stats manually verified
**📉 Hidden Bearish Divergences:**
- 🔴 RSI = Hidden Bear
- 🔴 MFI = Hidden Bear
- 🔴 Accum/Dist = Hidden Bear
**🌡️ Oscillator Status:**
- ⚠️ RSI = Overbought
- ⚠️ MFI = Overbought
- 😴 Low volatility = More reliable signals
**🌊 Elliott Wave Count:**
- 5️⃣ Potentially at Wave 5
- ⚡ Incoming correction expected
- ⚠️ BUT... 5th wave could still extend up a bit (conflicting signal!)
**📊 Volume Profile:**
- 🎯 At major volume cluster (POC - Point of Control)
- 🛑 Should slow down price
- 🐻 IF sellers show interest here
### ✅ Bottom Line
**🔥 Pretty good SELL opportunity! 🔥**
### ⚠️ Trade Management
**❌ INVALIDATION:**
- 🚫 Trade cancelled if price closes above orange zone below
**🎯 Stop Order:**
- 📍 Set below the zone for automatic entry
- 🎰 Let probability play out

Ethbtc This could suggest that eth will gain against btc next month looks like when the Macd crosses eth performs better than btc , I think this dip is just a correction but the market still looks strong

ETH BTC pair showing ETH under pressure to react - out of steam
ETH is under Long term resistance against the King Crypto, Bitcoin.
That weekly chart above does show ETH making its first come back since Late 2021 but now, it has reached a libe it may struggle to overcome.
The Weekly MACD below shows us there is room to move but look back at the last aTH in "021 ( dashed lines) amd see where MACD was then !
The Weekly RSI is already up in Overbought but as we know, it can range High
But, again, look back where RSI was when it reached its ATH's in 2021 ( dashed lines )
The DAILY chart also shows possible reasons to think that ETH may taje a breather.
OA being rejected off long term resistance
RSI has ranged high for weeks
MACD has ranged high for weeks.
True, with the American backing for its "Baby Crypto", mpmentum may continue but just remember, it is NOT decentralised really...the more you have, the more power you have to influence it.
Anyway..just be aware....Moves ARE about to happen and they could be in either direction but, Technicaly, it should Range or Dip.
Unless there is some other backing yet to appear......coughs......
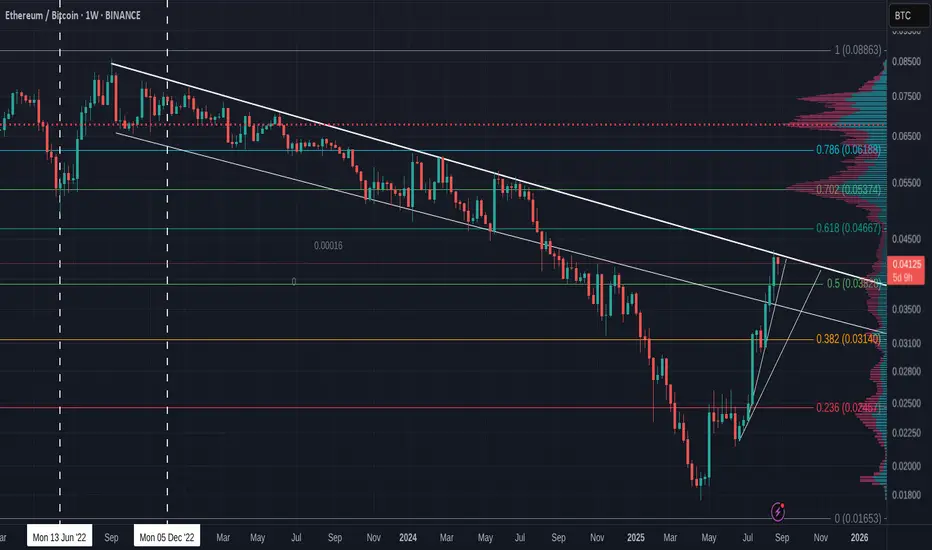
ETHBTC 1W#ETH is testing the long-term descending trendline on the weekly chart. The structure looks promising, with the Ichimoku cloud and the weekly EMA100 holding the price. Consider buying #ETHBTC here and near the support levels at:
🛡 0.03432 BTC
🛡 0.03113 BTC
In case of a breakout above the descending resistance, the potential targets are:
🎯 0.04362 BTC
🎯 0.05164 BTC
🎯 0.05966 BTC
🎯 0.07108 BTC
🎯 0.08562 BTC
⚠️ As always, use a tight stop-loss and apply proper risk management.

Period of ETH outperformance vs BTC is almost overWe got a clean five wave up structure that topped with a bang in April 25
This is from when ETH has been outperforming BTC nicely.
We can see a very clean corrective three wave decline labelled as A down, B up, C down
The ratio BTC vs ETH is approaching my Target 2.
What that chart tells us is that most likely the period of ETF outperformance against BTC is almost over.
That does not necessarily means that BTC should start a big rally. It is possible that both, BTC and ETH would decline. But that chart suggests that BTC would hold better in that case.

ETH/BTCOn 6 June 2025 we saw the 2D ETH/BTC 200 SMA golden cross the 450 DEMA. This was our first indicator that alt szn was upon us. Again, when the 50 EMA golden crosses the 450 DEMA the entire market should explode into the final rally of the cycle.

Will Ethereum and Altcoins Continue to Grow?Hello friends
You see the Bitcoin to Ethereum chart.
You may be wondering what caused Ethereum to grow. I should tell you that this chart shows us what happened.
The price is in a downtrend, which indicates a money movement (from Bitcoin to Ethereum).
When you see that after 3 hits to support, the price has managed to break the support and the price has fallen and formed a downward channel, which could indicate that Ethereum's growth is continuing.
So now we have identified the support areas for you using Fibonacci, based on the price range that has formed.
The price is now at an important support area, as you can see, we had a bullish reaction when we hit the support area, but the price reversed due to the strength of the downtrend...
Now, if the support area breaks, the price can move lower to the specified targets.
Keep in mind that if the price grows, the upper support areas that were broken now become resistance and the price must be able to break them for our trend to be bullish, but as long as the price is down, the upward trend of Ethereum will continue and the upward trend of Ethereum will also make the altcoins bullish...
*Trade safely with us*
