ETHEREUM Is it realistic to expect last Cycle's rally?Ethereum (ETHUSD) has been practically consolidating since the mid-August High, following an impressive rally on the April 07 Low. Technically it is coming off a 1W MA50/100 Bullish Cross.
It is the exact same pattern that confirmed ETH's massive parabolic rise (green Channel Up) during the previous Cycle in August 17 2020. The 1W RSI fractals between the two sequences are similar.
However, time-wise we are not in the same stage as last Cycle, in fact we are much closer to the end of the 4-year Cycle model. If there is still some time to repeat such a parabolic run, the price is 'limited' by the 1.618 Fibonacci extension at $13500, which again will be a wonderful and increasingly optimistic target for this Cycle Top.
Do you think it is realistic to expect such repeat at this stage?
-------------------------------------------------------------------------------
** Please LIKE 👍, FOLLOW ✅, SHARE 🙌 and COMMENT ✍ if you enjoy this idea! Also share your ideas and charts in the comments section below! This is best way to keep it relevant, support us, keep the content here free and allow the idea to reach as many people as possible. **
-------------------------------------------------------------------------------
💸💸💸💸💸💸
👇 👇 👇 👇 👇 👇
ETHPROS_TPG8CJ.USD trade ideas

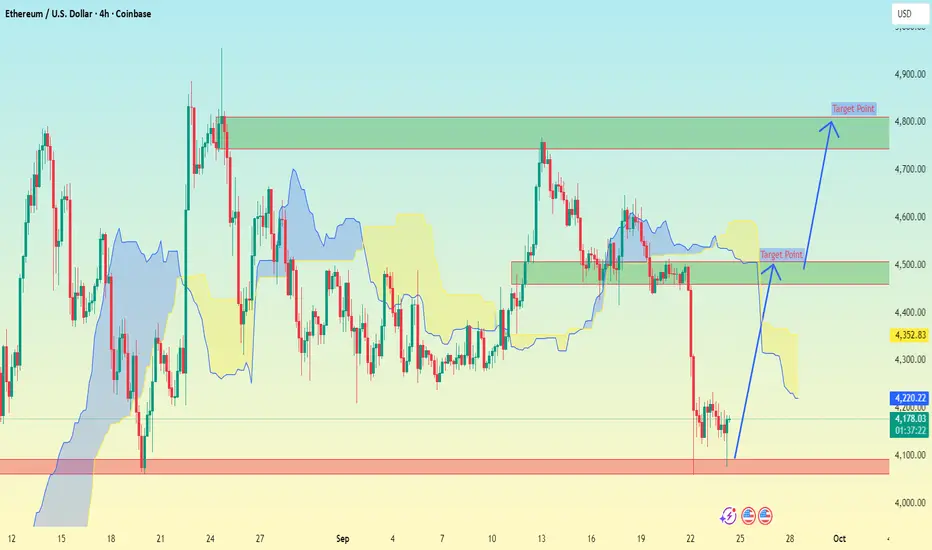
ETH/USD (Ethereum vs US Dollar) on the 4H timeframe.ETH/USD (Ethereum vs US Dollar) on the 4H timeframe.
Here’s the setup my marked:
Current price: $4,180
Price is bouncing from the red demand/support zone around $4,100 – $4,050.
Two green resistance/target zones are marked on your chart.
Targets Based on Chart:
First target: $4,400 – $4,450 (closer resistance zone).
Main target: $4,750 – $4,800 (upper green zone).
📌 So My bullish targets are:
🎯 Short-term target = $4,400 – $4,450
🎯 Extended target = $4,750 – $4,800
If price breaks below $4,100, bearish risk opens toward $4,000 – $3,950.
Ascending channel, symmetrical triangleEthereum on the dayli chart is trading in a ascending channel and a symmetrical triangle.
Key support of the channel and symmetrical triangle is at 4400 when a break above 4750 would mean a confirmed breakout of the symmetrical triangle with a target around 5700
Ethereum is also still trading above the 50 rsi wich means there is still bullish momentum.
The massive insitutional investments and the rate cuts could send ethereum to $10.000 in Q4

ETHEREUM (ETHUSD): Bullish Trend Continues
I see a nice bullish confirmation on Ethereum after a recent pullback.
The price formed a double bottom pattern and violated its neckline
and a resistance line of a falling wedge pattern.
With a high probability, the market will go up.
Goal - 4741
❤️Please, support my work with like, thank you!❤️
I am part of Trade Nation's Influencer program and receive a monthly fee for using their TradingView charts in my analysis.

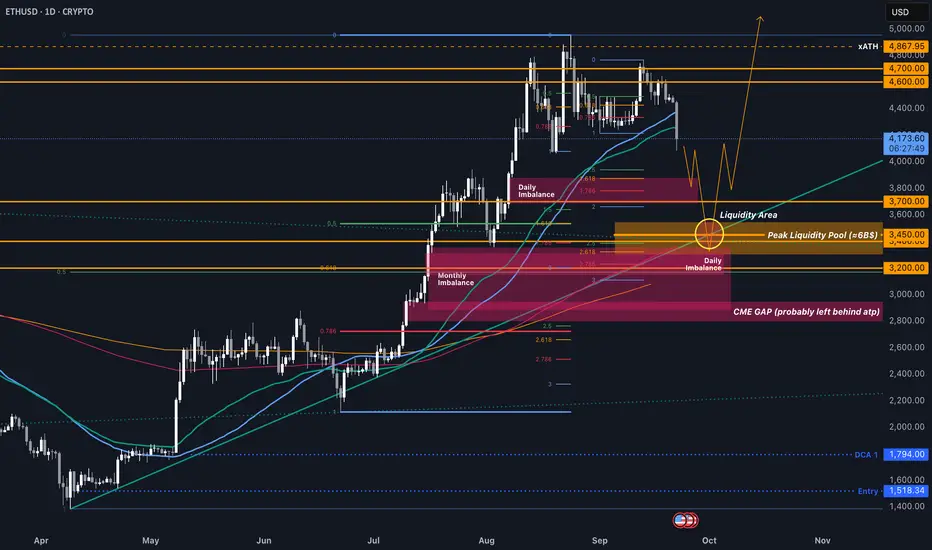
Possible Pre-Skyrocket ManipulationSince every soul on this earth knows that we will see huge bull-moves with given and upcoming rate cuts + october price action, its not unlikely that we COULD manipulate even lower after the Billion Dollar liquidation move overnight.
IF we do so, we would do it pretty fast and continue the displacement from the bearish head and shoulders pattern that broke the daily 50 EMA%SMA in the next few weeks.
On a technical site, there is still a huge amount of liquidity on CRYPTO:ETHUSD left (around 20B$), most accumulated at around 3.450$.
Strangely enough, that area matches the current ranges equilibrium, standard deviation levels of prior bearish manipulation moves, KEY SR Levels of 3400 and 3200, monthly and daily imbalances (which will get filled sooner or later), the 200D EMA and 50W EMA, AND the current htf bullish trendline and broken triangle resistance...
If we hit this before mid-October, these will be free longs, and I will DCA into my position, which sits at 1.794$ currently.
Exit Psychology 5/5: Tight vs. Loose NOTE – This is a post on Mindset and emotion. It is NOT a Trade idea or strategy designed to make you money. If anything, I’m taking the time here to post as an effort to help you preserve your capital, energy and will so that you are able to execute your own trading system as best you can from a place of calm, patience and confidence.
This 5-part series on the Psychology of Exits is inspired by TradingView’s recent post “The Stop-Loss Dilemma.” Link to the original post at the end of this article.
Here’s a scenario:
Two traders, same setup. One uses a tight stop. One sets it loose.
The first gets stopped out quickly - several scratches in a row. Frustration builds: “The market keeps hunting me.”
The second holds through the noise, but watches a small loss balloon. Self-talk creeps in: “If I’d cut it sooner, I’d be fine.”
Same market. Different styles. Each trader convinced the other way might be better.
How behaviour shows up with tight vs. loose stops:
Tight stops: Often chosen by traders who value precision and control. The mindset is “I’d rather be wrong small and often than wrong big.” The cost? A series of small cuts that can erode confidence.
Loose stops: Favoured by traders who value patience and the bigger picture. The mindset is “give the trade room to breathe.” The cost? Larger drawdowns and the risk of turning manageable losses into emotional ones.
Neither is inherently better. The choice often begins with trader type - your personality, values and beliefs shape a natural preference for precision (tight) or patience (loose). The trap isn’t in the preference itself it’s when short-term emotions hijack that baseline.
The psychology underneath:
Your baseline style comes from deeper beliefs and tendencies:
Tight stop traders often believe:
“If I’m precise, I can avoid being wrong.”
“Smaller losses hurt less.”
“Control comes from minimising risk quickly.”
Loose stop traders often believe:
“The market needs space to prove me right.”
“One big win will pay for the rest.”
“Patience will protect me from being shaken out.”
But when stress or excitement kicks in, those baseline tendencies can distort:
Tight traders over-tighten - cutting winners short out of fear.
Loose traders loosen further - holding too long out of hope.
The key is to know the difference between what reflects your style and what reflects an emotional trigger.
Why context matters:
Timeframe: Scalpers naturally need tighter stops; swing traders can afford looser ones.
Volatility: Calm markets tolerate precision; wild ones punish it.
Strategy: Breakout systems often need wider buffers; mean reversion thrives on tight control.
Your stop isn’t just about the chart. It’s about who you are, the system you run and the market you’re in.
Practical tips … the How:
Notice your natural bias: Do you lean toward safety through control (tight) or safety through space (loose)? Awareness matters more than labels.
Align your stop style with both your timeframe and your temperament. A system that grinds against your personality will drain your energy.
Review your data: Do tight stops cut you out too soon? Do loose stops bleed too much? Your history holds the clues.
Separate outcome from process: A stop-out isn’t failure - it’s feedback. Tight or loose, consistency beats reaction.
Reframe:
It’s not about tight versus loose. It’s about congruence, between your strategy, the market context and your personality. When those three line up, stops become less about fear and more about discipline.
Closing thought:
Every stop: initial, break-even, trailing, or profit target is really a mirror. It reflects not only your strategy, but also your relationship with uncertainty, control and trust in yourself.
The market doesn’t care how you exit. But your mindset does… as does your account.
Every adjustment, every shift of a stop, every decision to hold or cut, carries both a financial cost and an emotional cost. Learning to see those decisions clearly, is where growth begins and where your odds of staying in the game increase.
A quick note to those who have signed up to the free newsletter/the Pre-Market Mindset Reset on our website: please be sure to check your spam folder in case it’s found its way there.
A link to Exit Psychology 4/5 : The Profit Target – Certainty vs. Potential
A link to the original article as promised:
This is Part 5 of the Psychology of Exits series.
👉 Thanks for following along ... and for those who have stayed the course with me, there's a bonus wrap up that I'll be writing up today and releasing tomorrow. Stay tuned.

Buy Plan: ETH/USD (Monthly Timeframe)Buy Plan: ETH/USD (Monthly Timeframe)
1. Setup:
Price has formed a valid bullish monthly dealing range (DR Monthly).
Reaction observed from the lower part of the range (support area highlighted in red).
Trend shows recovery after the previous consolidation (green area).
2. Entry:
Buy at current price level near $4,126 – $4,140, after confirmation of bullish monthly momentum.
3. Stop Loss:
Below the lower wick of the recent monthly candle: $1,749.58.
4. Target:
Aggressive target around $35,534 (upper green zone on chart).
5. Risk-Reward:
High R:R potential due to large upward target compared to risk.
6. Notes:
Patience is key: Wait for monthly candle close confirmation.
Avoid entering if price closes below the red support zone.
Monitor for any reversal patterns forming at resistance levels.

$ETH trading near $4,180, sitting close to the $4,000 support CRYPTOCAP:ETH trading near $4,180, sitting close to the $4,000 support zone. A short-term bounce from here is possible, with pullback targets toward $4,500. However, I’m still holding my short position, watching for a clean break below $4,000 that could open the way toward $3,500 and lower levels.

Ethereum Elliott Wave Buy Setup: Targets 4550 and 4600Ethereum Daily Update (Elliott Wave Setup)
Based on my daily monitoring of Ethereum and according to the Elliott Wave count (which I’ll share shortly with the full analysis), I see a long opportunity forming.
Here’s my personal trade plan:
✅ Entry 1: Buy from current price 4450 / 4445
✅ Entry 2: If price dips, add another buy at 4400
🎯 Target 1: 4550
🎯 Target 2: 4600
Stop-loss: For both entries, a daily close below 4350
Please note:
This is not financial advice – I’m only sharing my personal trades.
Always do your own research before taking action.
👍 Don’t forget to like if you found this useful, and feel free to follow me for more analysis of this kind.
Best of luck 🌹

ETH going sub 4k? Ether ABC wave to $3913 or $3431 worst caseEther pushed into 5k and started pulling back.
Looks to be in an Elliott wave "ABC" correction.
Two different sub-4k targets are on the radar.
$4067.17 is the minimum expected retrace.
$3901-3931 is the most likely retest zone.
$3366-3435 is the strongest support nearby.
.
See "Recent Publications" for previous charts such a as this TOP CALL:
Hit BOOST and FOLLOW for more such PRECISE and TIMELY charts.
=========================================================
.

ETHUSD corrective pullback support at 4,170The ETHUSD remains in a bullish trend, with recent price action showing signs of a corrective pullback within the broader uptrend.
Support Zone: 4,170 – a key level from previous consolidation. Price is currently testing or approaching this level.
A bullish rebound from 4,170 would confirm ongoing upside momentum, with potential targets at:
4,517 – initial resistance
4,606 – psychological and structural level
4,686 – extended resistance on the longer-term chart
Bearish Scenario:
A confirmed break and daily close below 4,170 would weaken the bullish outlook and suggest deeper downside risk toward:
4,000 – minor support
3,908 – stronger support and potential demand zone
Outlook:
Bullish bias remains intact while the ETHUSD holds above 4,170. A sustained break below this level could shift momentum to the downside in the short term.
This communication is for informational purposes only and should not be viewed as any form of recommendation as to a particular course of action or as investment advice. It is not intended as an offer or solicitation for the purchase or sale of any financial instrument or as an official confirmation of any transaction. Opinions, estimates and assumptions expressed herein are made as of the date of this communication and are subject to change without notice. This communication has been prepared based upon information, including market prices, data and other information, believed to be reliable; however, Trade Nation does not warrant its completeness or accuracy. All market prices and market data contained in or attached to this communication are indicative and subject to change without notice.

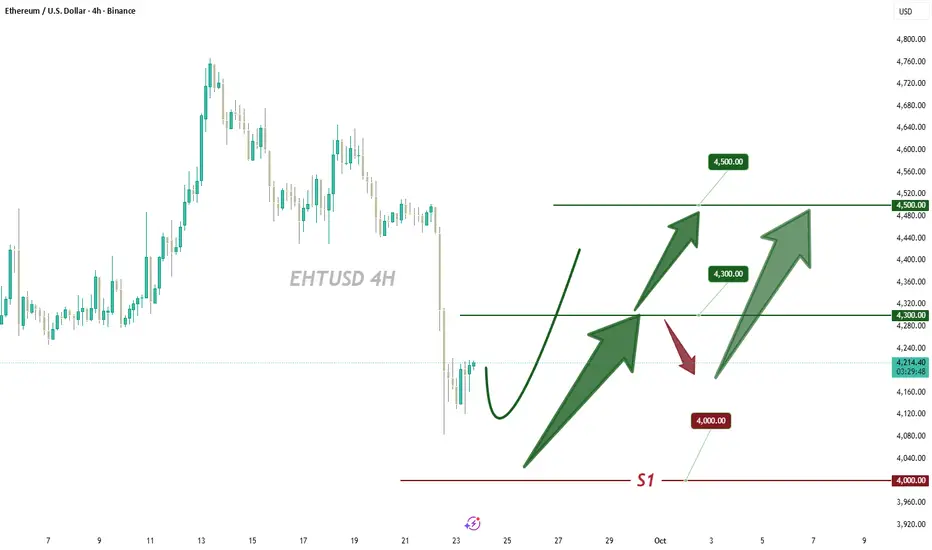
Hold 4000 Support, ETH Awaits ReboundETH has stabilized its downward trend . If the 4000 support level remains unbroken , we can continue to wait for a rebound 📈
Buy 4100 - 4150
TP 4250 - 4350 - 4450
Accurate signals are updated every day 📈 If you encounter any problems during trading, these signals can serve as your reliable guide 🧭 Feel free to refer to them! I sincerely hope they'll be of great help to you 🌟 👇
Eth Updatehey Guys,
This is an brief Update on my last Eth Idea.
Its been a while and our trade still runs in Juicy Profits from our Entrys at 2.3K and 1.6k. I mentioned in the comments that i expect a pullback.The Entrys i am looking at are between 3.2k and 2.7k . I also highlighted some price action from previous Bull Run so you Guys understand where we are atm.I think a 30% Dip Like in Last run is on the table which would be a great buying oppertunity If you got some Cash in the Side. i will Double down at These Levels and also keep my old Position running. Understand that price can Always reverse and move up from other Support zones. my Levels are Not fixed in Stone.So If price decides to to bounce earlier i will Stick to my old Position and Ride it towards 11k
Good Luck
And Take Care
SKY


ETH 3350 AreaLooks like we've closed below a crucial demand area of 4061 - 4130s now looking below to the ETH 3350 - 3450s area

Did Crypto Just Find a Bottom?After the recent crash, is the crypto market finally finding a short-term bottom?
In this video I dive deep into the charts for Bitcoin (BTC), Ethereum (ETH), and the total crypto market cap to answer that question.
Here’s what I cover:
- Signs that a short-term bottom could be in place
- My upside targets for BTC, ETH, and alts if we bounce
- Key levels I expect price to pull back into on a move higher
- The downside scenario if the market fails to hold
I break this down using ICT concepts like order blocks, fair value gaps, and liquidity sweeps to show exactly what I’m watching.
👉 Do you think we’ve found a bottom, or is more downside coming? Drop your thoughts in the comments.
#Crypto #Bitcoin #Ethereum #Altcoins #BTC #ETH #CryptoAnalysis #ICTTrading

Ethereum Cup-and-Handle Points to $5,430BINANCE:ETHUSD price is trading under $4,600, up 2.2% in the past 24 hours. On the charts, BINANCE:ETHUSD has formed a clear cup-and-handle setup, one of the strongest bullish patterns. A daily close above the neckline at $4,765 would confirm the breakout and set a target near $5,430 — about 17% higher from current levels.
The setup works by measuring the distance from the “cup” bottom to the neckline and projecting it upward. In Ethereum’s case, that move points directly toward $5,430, which would mark a new high for the year.
Support sits at $4,489 and $4,424, both levels tested during the handle formation. A drop under $4,213 would break the pattern and cancel the bullish view.
Another confirmation comes from the Chaikin Money Flow (CMF), which tracks buying pressure. CMF has risen sharply from –0.18 on September 15 and is now close to turning positive. If it crosses above zero, it would show that new money is entering alongside the breakout, giving more power to the move.

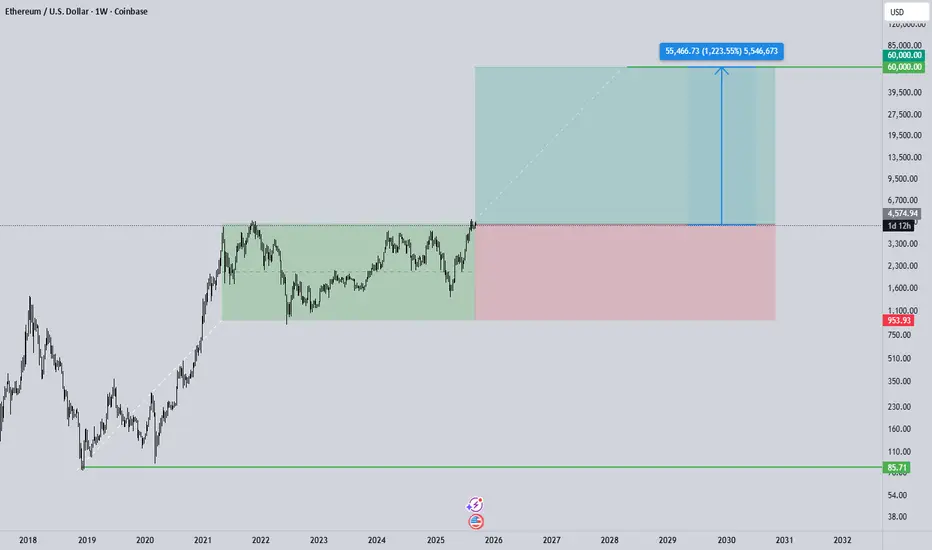
Ethereum Weekly Chart Outlook: Breakout Potential & 60K near!The weekly Ethereum chart shows that after years of consolidation within a broad range (green box), the price is now testing the upper boundary and attempting a breakout. Such behavior typically signals the start of a major bullish phase, provided the breakout is confirmed on the weekly close and the former resistance successfully turns into support. Based on projections, the first intermediate targets could be around 7.4k, 9–12k, and then 16k, while the long-term projection of 60k (+1200% from the current price) represents a highly optimistic multi-year scenario. On the other hand, if the breakout fails and price settles back below resistance, a return to the 1k region is possible. The reward-to-risk ratio of this trade, with a stop at 953 and a target of 60k, is exceptionally high (over 15:1), but the wide stop severely limits position size and demands strict risk management. Therefore, a secure entry should only follow a confirmed weekly close above resistance with a successful retest, and traders should plan for partial profit-taking at intermediate levels along the way.
Fly ETH!Wether the correction over or not, ETH is going to ATH. WXY is currently completed, and from this point ETH can go higher and higher. If the market decides it's not over yet it can dive one more level down to 3960 and transwork WXY to ABC.
Be cautios though, don't enter the market w/o stop loss. Bulls let's get control back!!! Fly ETH!!!

ETH/USD – Major Breakdown, Heavy Sell Pressure🔴 SHORT under $4,200 – target $4,083
Ethereum trades at $4,171, deeply under SMA200 ($4,435). Resistance: $4,500, support: $4,083. RSI at 28, oversold, but sellers remain dominant.
📖 Keywords: #ETHUSD #Ethereum #CryptoCrash #AltcoinSelling

ETHUSD key trading level at 4,100The ETHUSD remains in a bullish trend, with recent price action showing signs of a corrective pullback within the broader uptrend.
Support Zone: 4,100 – a key level from previous consolidation. Price is currently testing or approaching this level.
A bullish rebound from 4,100 would confirm ongoing upside momentum, with potential targets at:
4,450 – initial resistance
4,730 – psychological and structural level
5,070 – extended resistance on the longer-term chart
Bearish Scenario:
A confirmed break and daily close below 4,100 would weaken the bullish outlook and suggest deeper downside risk toward:
3,990 – minor support
3,830 – stronger support and potential demand zone
Outlook:
Bullish bias remains intact while the ETHUSD holds above 4,100. A sustained break below this level could shift momentum to the downside in the short term.
This communication is for informational purposes only and should not be viewed as any form of recommendation as to a particular course of action or as investment advice. It is not intended as an offer or solicitation for the purchase or sale of any financial instrument or as an official confirmation of any transaction. Opinions, estimates and assumptions expressed herein are made as of the date of this communication and are subject to change without notice. This communication has been prepared based upon information, including market prices, data and other information, believed to be reliable; however, Trade Nation does not warrant its completeness or accuracy. All market prices and market data contained in or attached to this communication are indicative and subject to change without notice.

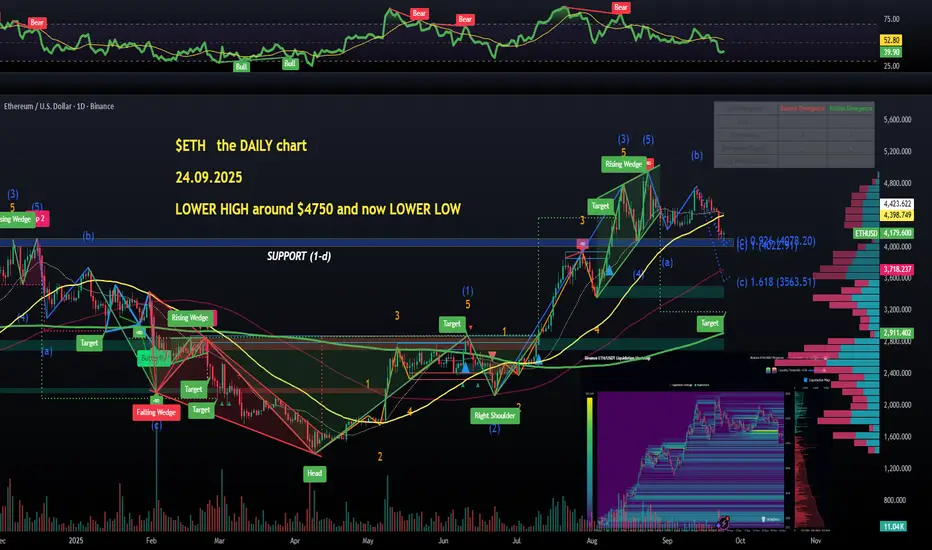
$ETH in a DOWNTREND after hitting a LOWER LOWCRYPTOCAP:ETH has confirmed BEAR market structure after a LOWER LOW was put in.
So a full-on DOWNTREND on the daily chart, and this is most likely WAVE C, so usually the last one out 3 in a corrective move.
After WAVE C completes (could crash as low as Fib 1.618 at $3563), we will likely continue with another 5 WAVE uptrend.
For now, the support above $4000 has been retested at $4078 but no immediate high volume recovery, at all. So we might be heading lower especially after another ETF outflow day.
More liquidity below down to $3500 too.
Not looking good on this chart👽💙
$ETH Market OutlookCRYPTOCAP:ETH Market Outlook
Ethereum is currently consolidating, with a critical downside level at $4,000.
If $4,000 does not hold, the next supports are $3,500 and $2,400.
The $2,400 scenario remains highly unlikely, as it would imply a full retracement of the previous rally. In contrast, a pullback to $3,500 represents a 50% correction of the last upward move—a realistic outcome that would signal a temporary setback rather than a trend reversal, potentially setting the stage for continued upside momentum.
At present, CRYPTOCAP:ETH is trading within a range and sitting near the midpoint. Should this level break, the bottom of the range becomes the next logical target.
⚠️ Always DYOR.
