ETH Support Bounce With Target at 3250Ethereum is trading above a key support level after a strong downward move. Price is showing early signs of a potential bullish correction, with projections pointing toward a possible recovery target around $3250. A break above minor resistance could confirm upward momentum.
Trade ideas

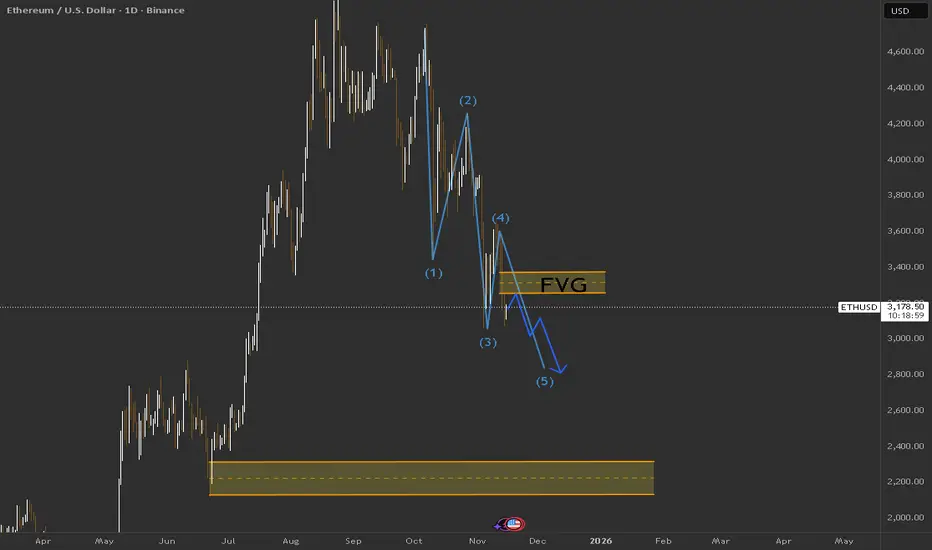
$ETHUSD: In Wave II correctionBINANCE:ETHUSD : After 2021 top, Ethereum went through a length multi-year complex correction that is W-X-Y. Since then, a new uptrend was born. We have completed Wave I of this new uptrend. The 5 subwaves of Wave I can be seen clearly. We're now in Wave II.
Wave II usually retrace 50% or more. It can retrace very deep, even 90%. Let's hope ETH will found a bottom between 50% ($3169) and 61.8% ($2748) retracements.

ETH UpdateHey everyone,
so please see the green bull penant drawn on the closes, as you may notice, it has failed and is being broke back into.
Now, this is where I'd like to share a wild prediction. It will close above the green top rail for November, therefore keeping the pattern as valid.
This is why I say time frames matter, as false moves on patterns can be tricky on depending on the time frame the pattern is meant to hold on.
On weekly it looks disastrous, has cleanly closed below, but is that the correct time frame?
This is a game of chess, between yourselves and the market makers, the gods of this world. Therefore there is a layer of psychology. You need to know what is going to happen, to play this correctly.
If this fails to close above, I will put my hands up, but if it doesn't, understand this world has Gods, and there job is to take as much money from you as possible, and that's a dynamic you need to be able to play against, correctly.
Not financial advice.

Maximum Fear = Maximum Opportunity. Wave 5 is Next
So where are we going? The chart has the target mapped out. The final Wave (5) is programmed to hit the 1.618 Fibonacci extension, which lines up perfectly with a retest of the upper trendline.
That puts us at ~$6,700.

ETHUSDMaybe another bull trap.
Based on market sentiment, catastrophe is not yet...
Before a ledge, the market must be complacent...
As far as I can tell, right now, it's fear.

What Is Crypto Market's Downside Risk?The move to the downside this week has been pretty damn aggressive to say the least.
This has brought in a lot of fear within the market, creating confusion and doubt.
However, if you have been watching my videos, we have been expecting this move. And in this video, I explain, the further downside risk we may have. I am still very bullish, and if we do get the move to the downside, it will confirm my confidence to the upside even more.
The game here is to stay patient, and avoid the noise we are hearing on social media.
I explain all the downside risks on BTC and ETH. I also show you exactly where my invalidation point is on BTC, to confirm that the cycle is officially over and we are fully bearish.
TO CONFIRM: This is the worst case scenario, and I don't really want to see this happening, as I also have had enough of the choppiness.
Lets go Alchemist Traders!
⚠️ Disclaimer:
I am not a financial advisor. The content shared on this channel is for educational and informational purposes only and should not be considered financial advice.
Trading and investing in cryptocurrency involve high risk — you could lose some, or all, of your money. Always do your own research and make sure you understand the risks before making any financial decisions.

ETH has to go up, but some things might need to happen first...While I'm bullish on ETH, it might have to go to these lows to get enough liquidity to fly to new ATH
Buy SetupWe have taken a Long position on ETHUSD target first red line where we take 50% profit and second red line we close the trade.

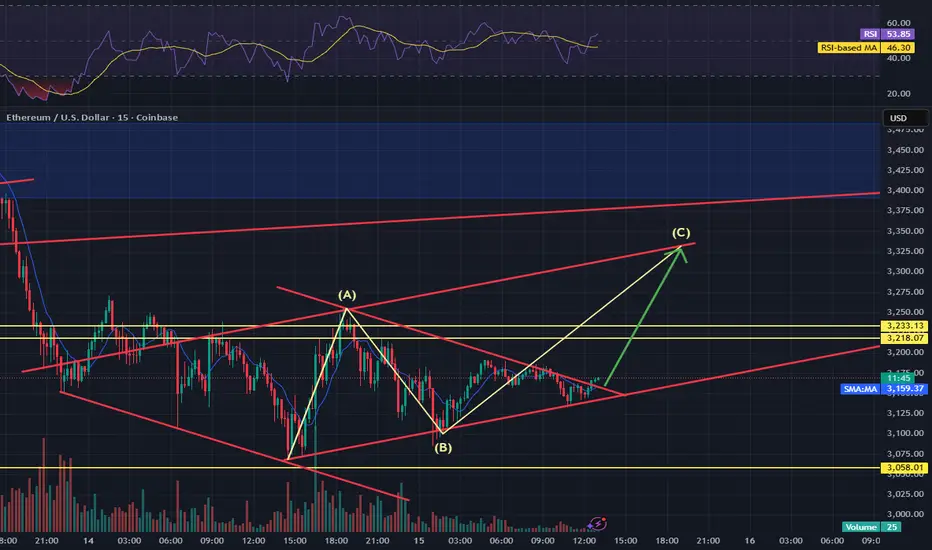
ETHUSD in ABC consolidation ETHUSD is in ABC consolidation at the moment looking for the C leg to the north side. This seems to be a confirmation for resistance move before wave 5 to the south starts.
#ETHUSDT 2025–2028 OutlookFIB/GANN/classic Method Analysis
🔹 Gann Key Timing
According to Gann cycles,
25 November marks the start point of a new bullish attempt for ETH.
The $2,500 level is the critical line
if ETH closes a monthly candle below $2,500, it signals a significant change in the long-term roadmap.
Trend Setup
As long as ETH holds $2,500 and stays above the Blue Trend Line (A),
The bullish roadmap remains valid.
🎯 Roadmap Targets
Breakout Key:
$5,100 → Main breakout confirmation
Target 1:
$5,900 – $6,700 → First bullish leg (until Feb 2026)
Target 2:
$8,200 – $8,900 → Full bullish year if 2026 confirms
Target 3:
$10,150 → Extended top projection (2027–2028)
📌 All levels remain valid as long as ETH holds $2,500 on the monthly close.
💰 Trade Plan
We have active entries: from $3, XXX, with remaining buy levels between $1,500–$1,850–$2,150.
Set up invalidation: Monthly close below $2,500.
Max investment: 15 % of wallet.
Risk-Reward (R: R): ≈ 1: 2 or higher.
Example: If you hold 10 ETH, you risk about $10K vs. the potential upside of $35–70K.
⚖️ Summary
Support to hold: $2,500
Breakout confirmation: $5,100
Main targets: $5,900 → $6,700 → $8,900 → $10,150
Cycle: 2025 → 2028
Exposure: 15 % max
Always trade with a clear plan and controlled risk.
⚓ Renzo Tip
“The chart tells its truth to the patient — not the loudest trader, but the calm observer of time.”
🤲 Prayer
May Allah guide us to trade with clarity, protect our effort from greed and confusion,
and reward our discipline with lasting growth and wisdom.

ETHUSD - Maintain Trend LineDaily chart for ETHUSD
suggesting that this trend line on this chart will be maintained an a strong altseason will ensue with ETH increasing faster than BTC.
This can be seen by comparing BTC dominance and ETH dominance aswell. ETHD going up, BTCD going down.

Eth updatewhile the price of eth is dumping, it is still too low compared to the price of btc.ETH should be atleast 5-6k at the current price of btc. i see the market going down, but a final pump must form

Ethereum Wave Analysis – 14 November 2025- Ethereum reversed from support zone
- Likely to rise to resistance level 3600.00
Ethereum cryptocurrency recently reversed from the support area between the support level 3090.00 (which stopped the previous impulse wave (C) at the start of November), 50% Fibonacci correction of the upward impulse from April and the lower daily Bollinger Band.
The upward reversal from this support zone stopped the previous medium-term ABC correction (2).
Given the strength of the support level 3090.00, Ethereum cryptocurrency can be expected to rise to the next resistance level 3600.00.

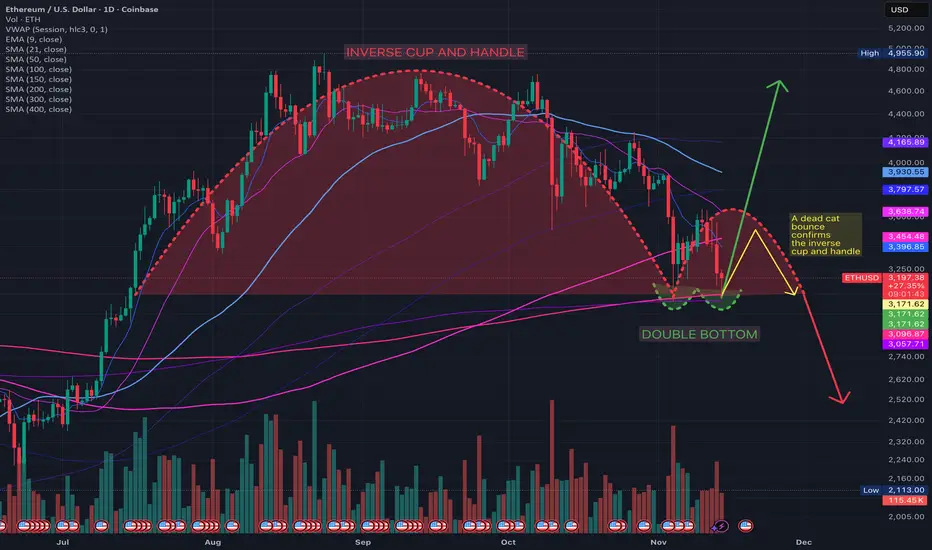
An inverse cup and handle or a double bottom?The chart is in a downtrend sitting on big support, and we have sketched the two obvious branching paths.
Where we are now
Price ~3.2k, below the 9/21/50/100/150/200-day MAs but sitting on the 300–400-day cluster around 3.05–3.10k.
That zone also matches the previous summer range = strong structural support.
Trend is still clearly down until at least the 200-day (~3.45k) is reclaimed.
⸻
Bull case – double bottom
The green double bottom is basically
Lows: ~3.05k–3.10k (twice).
Neckline: the swing high between them, roughly ~3.5–3.6k.
For this to be “real” we want:
decisive daily close above ~3.5–3.6k with volume.
Ideally 200-day MA reclaimed and flattening.
If that happens, measured move targets land somewhere in the mid-4ks, which lines up with your big green arrow.
Subjective odds right now: lower, maybe ~40% until that neckline breaks. We're trying to fight the prevailing downtrend; the pattern is only a potential bottom.
⸻
Bear case – inverse cup / rounded top
The red “inverse cup and handle” is basically a big rounded top since August
Series of lower highs, price rejected by falling MAs.
Current bounce is so far just a retest of that declining structure / MA cluster from below.
Bearish resolution would be
Failure somewhere under ~3.5k.
Breakdown below 3.0–3.05k (loss of 300–400-day MAs and range support).
That opens a move to the mid-2ks or worse, which is your red arrow scenario.
Given the existing downtrend and overhead MA gravity, continuation has the edge for now—call it ~60% vs the bullish reversal, unless the neckline is reclaimed.
⸻
Net take
Above ~3.6k with volume → double bottom validated, trend potentially flips up.
Below ~3.0k with conviction → rounded-top breakdown, expect acceleration down.
In between 3.0–3.6k you’re in Schrödinger’s pattern: chop, fakeouts, and pain.
So the market is basically asking: “Do we defend the 3k fortress, or do the MAs slowly grind everyone down?” The chart slightly favors the bears until price proves otherwise.
This Crypto Dump Was Planned — Don’t Get TrappedThe Crypto Market Is Tanking… But This Is Exactly What I Expected.
In today’s video, I break down the sharp move to the downside across BTC, ETH, and Total Market Cap — a move I warned about in my previous videos. Despite bullish news about the US government reopening, the market dropped aggressively… and that’s not an accident.
This is a psychology game.
They want you scared.
They want you to believe it’s over.
But I’m still bullish, and in this video I explain:
-Why this dump is part of the plan
-How much lower price can still go
-The key levels I am looking at
-The bigger picture for BTC, ETH, and Total
-Why strong hands win in times like this
Stay focused. The real move hasn’t even started yet.

“ETH – Bullish OB broken, downtrend resumes.”ETH Analysis – Nov 14 (VNShark)
Bullish OB: Fully broken — confirming that the previous bullish structure is no longer valid.
Retest: Price pulled back to the trendline and the broken OB zone, showing a clear bearish rejection — a logical sell signal.
Volume: Selling pressure continues to increase with each downside leg.
At this stage, VNShark prioritizes waiting for a pullback and observing the price reaction at the offer zone before considering a short entry aligned with the new downtrend.
This analysis is for educational purposes only and not financial advice.
#Tags
#ETHUSD #Ethereum #OrderBlock #SmartMoneyConcept #SMC #PriceAction #Volume #VNShark #CryptoAnalysis #MarketStructure #BreakOfStructure #Downtrend

NEXT 3 MONTHS are historically BULLSIH FOR CRYPTOEthereum is positioned as a top buy for the coming six months, with technical patterns, historical seasonality, and evolving fundamentals suggesting a realistic pathway toward the $10,000 mark. A clear Double bottom on the technicals is indicating reversal for COINBASE:ETHUSD
### Why Ethereum Is a Great Buy Now
- **Technical Setup**: ETH recently formed a double-bottom pattern at crucial support, signaling strong demand. The recent bounce from the $3,000 range aligns with bullish reversals in volume, moving averages, and on-chain metrics.
- **Network Growth**: Massive increases in layer-2 adoption, thriving DeFi ecosystems, and the emergence of a spot ETH ETF are expanding use cases and institutional interest, setting the stage for explosive price moves.
- **Macro Tailwinds**: The prospect of lower interest rates and renewed risk-on appetite among global investors are catalysts for crypto’s next surge. Hedge funds and corporates are increasingly adding Ethereum to their treasuries, aligning with historic accumulation phases.
- **Price Targets**: Top analysts forecast rapid gains, with DigitalCoinPrice and Changelly projecting $6,900–$11,000 for ETH within the next year, and Gov Capital suggesting $5,400 by late 2025. Bullish scenarios outline $10,000 as achievable if momentum and adoption trends accelerate.
### Seasonally Strong Months for ETH
Historical performance shows that certain months have offered outsized returns for Ethereum . Notably:
- January, February, and July are statistically the strongest rally months
- December and March often show above-average gains.
- May, June, and September tend to be bearish or mean-reverting.
#### ETH Month-by-Month Rally Table
| Month | Average Return | Rally Potential |
|-----------|:--------------:|:--------------:|
| January | +15% | Strong |
| February | +12% | Strong |
| March | +8% | Moderate |
| April | +5% | Positive |
| May | -3% | Weak |
| June | -4% | Weak |
| July | +17% | Very Strong |
| August | +9% | Moderate |
| September | -6% | Weak |
| October | +7% | Positive |
| November | +6% | Positive |
| December | +9% | Strong |
Conclusion
With history on its side and market fundamentals evolving rapidly, Ethereum is set for a major upside move in the next six months. Investors should target accumulation during seasonal lows in late winter and early spring, aiming for parabolic runs in summer and year-end. Technical and on-chain signals, combined with dominant seasonality, paint a bullish picture—making $10,000 a plausible target for proactive ETH buyersbuyers.

eth dip incomingwith simple analysis you can see eth started a bullish channel back in 2022 every time we touch the top of the red trend line we see a reversal. so i will expect to see eth retrace to the green support line and bottom of channel where we could expect 1800.00 to 1500.00 then continue up after a test of support. if we start to see a reversal we well likely create a inverted head and shoulders and will invalidate the trend only time will show us hints of direction .until i see a clear trend change i will remain bear.

Dalai Llama - Oh YeahOh yeah its Dalai Llama time. We must summon the dalai llama, but only to thank him for running this bad boy back turbo. Bottoms in send it to Valhalla for the reasons in all my recent posts.

Global Soft Commodity Trading1. What Are Soft Commodities?
Soft commodities are agricultural goods used for food, textiles, beverages, and biofuels. They are classified into several broad segments:
a) Grains and Cereals
Wheat
Corn (maize)
Rice
Barley
These form the backbone of global food security and are traded extensively via futures contracts.
b) Oilseeds and Edible Oils
Soybeans
Palm oil
Sunflower oil
Rapeseed
These commodities are vital for cooking oil, animal feed, and industrial applications.
c) Tropical Products
Coffee
Cocoa
Sugar
Spices
Produced mostly in tropical regions, they are influenced by regional climate and weather events like El Niño and La Niña.
d) Fiber Commodities
Cotton
Rubber
Jute
Used primarily in textiles, manufacturing, and industrial processes.
e) Livestock and Dairy
Cattle
Hogs
Milk derivatives
These are essential for the food processing and meat industries.
2. Structure of Global Soft Commodity Trading
Soft commodity trading operates through two primary channels:
a) Physical (Spot) Trading
Involves buying and selling the actual agricultural product.
Participants include:
Farmers and cooperatives
Exporters and importers
Commodity merchants (e.g., Cargill, ADM, Bunge)
Food processing companies
Textile manufacturers
Physical trading focuses on logistics, shipping, storage, warehousing, and quality inspection.
b) Derivatives Trading
Soft commodities are widely traded on futures exchanges such as:
Chicago Board of Trade (CBOT)
Intercontinental Exchange (ICE)
NYMEX
Dalian Commodity Exchange (DCE)
Multi Commodity Exchange (MCX India)
Derivatives allow traders, corporations, and governments to hedge price risks or speculate on future price movements.
3. Key Players in the Soft Commodity Market
a) Producers
Countries in Latin America, Africa, India, China, and Southeast Asia dominate production. For example:
Brazil: coffee, soybeans, sugar
Ivory Coast & Ghana: cocoa
India: cotton, sugar, spices, wheat
China: soybeans, rice
b) Traders and Merchants
Large multinational firms manage procurement, logistics, and distribution networks.
c) Commodity Exchanges
Provide transparent pricing and risk-management tools for global participants.
d) Financial Institutions
Banks, hedge funds, and investment firms trade soft commodities for portfolio diversification and speculation.
e) End-Users
Food manufacturers, textile mills, beverage companies, and energy producers rely on stable supply.
4. Factors Influencing Soft Commodity Prices
Soft commodities are highly volatile because they depend on natural events and global economic fluctuations. Major price-moving factors include:
a) Weather and Climate
Extreme weather—droughts, floods, cyclones—can sharply reduce production.
Events like El Niño often disrupt supply chains worldwide.
b) Seasonal Cycles
Planting and harvesting seasons create predictable demand and supply patterns.
c) Geopolitics
Trade restrictions, sanctions, export bans, and conflict zones (like in the Black Sea region) significantly influence grain and oilseed prices.
d) Currency Movements
Most commodities are priced in USD, so a stronger dollar makes them more expensive for importing nations.
e) Supply Chain Disruptions
Port delays, shipping shortages, or logistical failures create shortages.
f) Global Demand Trends
Rising middle-class consumption boosts demand for:
Protein (livestock feed demand increases soy and corn usage)
Coffee and cocoa
Biofuels (palm oil, corn ethanol, sugar ethanol)
g) Government Policies
Minimum support prices, export taxes, and subsidies influence domestic and global markets.
5. Trading Strategies in Soft Commodities
Soft commodity traders use multiple strategies in derivatives and physical markets:
a) Hedging
Producers lock in prices to protect against volatility.
Example: a coffee farmer hedges future production by selling coffee futures.
b) Arbitrage
Traders exploit price differences:
Between markets (inter-market arbitrage)
Between expiration months (calendar spreads)
Between commodity grades (quality spreads)
c) Speculation
Traders take directional bets on future price movements based on:
Weather forecasts
Supply-demand data
Economic indicators
d) Spread Trading
Buying and selling correlated commodities:
Corn vs. wheat
Soybeans vs. soybean oil
e) Algorithmic and High-Frequency Trading
Increasingly used for short-term price anomalies.
6. Importance of Soft Commodity Trading in the Global Economy
a) Food Security and Stability
Soft commodities ensure availability of food grains and edible oils.
Their pricing impacts inflation, especially in developing countries.
b) Industrial and Manufacturing Input
Cotton, rubber, and other fibers support the textile and automotive sectors.
c) Employment Generation
Millions of farmers, traders, and logistics workers depend on agriculture.
d) Global Trade Balances
Major exporters—Brazil, Argentina, India, US—earn significant foreign exchange through soft commodity exports.
e) Price Discovery
Futures markets provide transparent global benchmarks that help governments and industries plan production and inventory.
7. Emerging Trends in Soft Commodity Trading
a) Sustainable and Ethical Sourcing
Consumers demand ethically sourced coffee, cocoa, and palm oil.
Traceability and ESG compliance are becoming mandatory.
b) Digital Farming and Smart Agriculture
Technologies like:
AI-based weather prediction
Drones and satellite imaging
Precision farming
These improve crop quality and supply forecasting.
c) Climate-Resilient Commodities
Investment is rising in drought-resistant seeds, alternative proteins, and regenerative agriculture.
d) Rise of Biofuels
Biofuel policies increase demand for:
Corn (ethanol)
Sugarcane (ethanol)
Soy/palm oil (biodiesel)
e) E-Trading Platforms
Digital trade platforms reduce intermediaries and streamline global trade.
8. Challenges in Soft Commodity Trading
a) High Volatility
Weather and geopolitics create unpredictable price swings.
b) Supply Chain Complexities
Quality inconsistencies, delays, and transportation losses can impact pricing.
c) Regulatory Changes
Sudden export bans (as seen with wheat, sugar, or rice) disrupt global markets.
d) Climate Change
Rising temperatures threaten yields and increase production risks.
e) Financial Constraints for Farmers
Small farmers in developing nations lack access to credit and hedging tools.
Conclusion
Global soft commodity trading plays a vital role in ensuring global food availability, supporting manufacturing industries, and stabilizing economic systems. It connects farmers to international markets, provides effective price discovery mechanisms, and helps manage risk through futures trading. However, the market is highly sensitive to weather, geopolitics, and global economic shifts.
With rising concerns around sustainability, digital transformation, and climate impacts, soft commodity trading is evolving rapidly. Countries and corporations that adapt to these changes—through better risk management, technology adoption, and sustainable practices—will shape the future of global agricultural trade.

Inverse HnSImagine if CRYPTOCAP:ETH inverse Head and Shoulder plays out.
This would be a good 2026 for CRYPTOCAP:ETH

RSI Never Lies🧠 RSI Never Lies
I believe the RSI indicator, especially on the daily timeframe, is the most powerful signal in the market.
Since the moment I noticed the bearish divergence on Ethereum, the price has dropped over 15%, even touching $3500.
I didn’t do anything special — I’m no fortune teller.
I just listened to my dear friend, RSI.
Now RSI is around 40 on the daily chart, which clearly suggests that the downtrend may continue.
#ETH #Ethereum #RSI #TechnicalAnalysis #TradingView #RMBS

ETHUSD long trade activated In my opinion EThUSD has a great potential to benefit from the seasonal trend in November and December, when compared to Bitcoin on ETHBTC chart it also show momentum.
The daily and weekly trends are also strong so a reverseal is the most probable move here.
The stoploss and targets are showed in the chart.
