ETHUSD | Bearish & RangeboundETHUSD is moving between range on 4hr TF as well as on 1hr TF.Moreover it has formed bearish divergence on RSI.Most probably it will go down on short term bases but will determine its course after inflation data to be released on 12th September.
ETHUSD.PI trade ideas

ETHUSD - September 11, 2025Bullish Breakout: A move above $4,541.6 could target $4,639.2.
Bearish Breakdown: A drop below both the trendline and $4,285.1 could lead to $3,870.5.
Sideways Action: The current consolidation range is between $4,285.1 and $4,541.6.

ETH / XRP / BNB / SOL / BTC / HYPE: trend structure review Quick review of key altcoins and what I am expecting in coming sessions
BITSTAMP:ETHUSD briefly touched the key mid-term support zone highlighted in last week’s market review and is showing signs of accumulation. As long as price holds above September lows, I am looking for a potential move into ATH, with 5700 as a target zone.
If price breaks down below the 21EMA, the odds shift toward a deeper corrective wave into 4150–3740 support, where I would expect a higher low to form before the next advance phase into year-end.
Chart:
BINANCE:XRPUSDT double bottom potential, suggested in last week’s review, seems to be playing out. Price may be working on its first upwave within a larger uptrend toward ATH into year-end. For that scenario to remain valid, I would prefer to see price holding above 2.90, moving into 3.30 resistance, and then building a higher low while maintaining key EMAs.
Chart:
BINANCE:BNBUSDT price has briefly touched the key mid-term support zone from last week’s review and is following through with its upside trend structure into the macro resistance zone. As long as price holds above key EMAs, the next important resistance levels are 950–1000.
Chart:
COINBASE:SOLUSD price has held the key local support zone and is following through with its bullish potential. As long as price remains above key EMAs, I am expecting upside momentum to continue, with the next resistance zone at 255–285.
Chart:
CRYPTO:HYPEHUSD price is showing leadership action, as suggested as a potential in last week’s review. Local support is at 52. As long as price holds above this level and key EMAs, I am expecting follow-through action into the 60–65 resistance zone.
Chart:
BITSTAMP:BTCUSD price has potentially established a low and may be working on the first wave of a new macro uptrend into year-end. As long as price holds above yesterday’s lows, I am watching for a breakout above the 50DMA, with upside targets into the 120K+ resistance zone. From there, I would expect a higher low to form before the next advance and potential breakout into ATH.
Chart:
Feel free to comment which coins and assets you’re most interested in, and I’ll prepare a separate review on them.
Thank you for your attention!

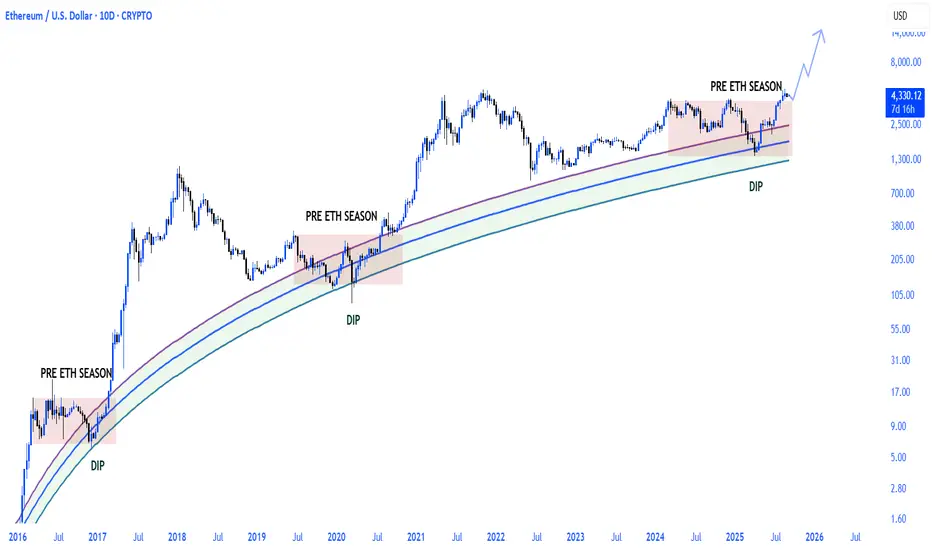
ETHUSD - Bullish Weeks/Months Ahead Curved channel shows consistent bottoms along the solid green line
I think a large pattern will play out like the one seen in this triangle in yellow
The white line is honestly max and wishful
Bullish Weekly Chart

Ethereum ETH Trade Setup: Resistance, Liquidity, and BoS Idea🟣 Ethereum (ETH) Update (further to my previous idea) 🟣
ETH is currently bullish 🟢📈 and pressing into a key resistance level ⚖️ where we see multiple relative equal highs 📍📍 forming consecutively. This is a major level 🔑.
Here’s what I’m watching:
1: The current pullback may give us a bullish BoS for an entry.
2: If price trades above this resistance 🚀, it will likely trigger buy stops 🎯, providing the liquidity 💧 needed for a potential pullback 🔽.
3: If price then breaks through decisively 💥, I’ll be looking for a retest + hold 🔄, followed by a bullish break of market structure (BOS) 🔓 as confirmation to get long 🟢.
⚠️ This is educational only, not financial advice. 📚

Ethereum ETH at Key Resistance: Equal Highs and Liquidity Play🟣 Ethereum (ETH) Update 🟣
ETH is currently bullish 🟢📈 and pressing into a key resistance level ⚖️ where we see multiple relative equal highs 📍📍 forming consecutively. This is a major level 🔑.
Here’s what I’m watching:
If price trades above this resistance 🚀, it will likely trigger buy stops 🎯, providing the liquidity 💧 needed for a potential pullback 🔽.
If price then breaks through decisively 💥, I’ll be looking for a retest + hold 🔄, followed by a bullish break of market structure (BOS) 🔓 as confirmation to get long 🟢.
⚠️ This is educational only, not financial advice. 📚

ETHUSD | Reversed 0.5R ATR Setup(Unfortunately, my original post with the exact entry was hidden due to a house rule violation. This repost only shows a later entry, as I had to publish it again after the fact.)
Setup: 0.5R target | 2 ATR stop | 1 ATR take profit
Entry idea:
Multiple confluences line up for a quick trade. Price found support at a major level, broke several trendlines to the upside, and is now retesting resistance. A safe 0.5R target is in play.
Confirmations:
• RSI trend break to the upside → market showing strength
• Elliott: 1D 5-wave structure completed, followed by an ABC correction → points to continuation higher
//This setup follows my high-probability reversed approach.
I focus on consistency with 80%+ win rate instead of chasing 1:2 or 1:3 risk-reward trades.
Why?
Because a 0.5R target reduces trade time dramatically — no need to sit in positions for hours or days. Less time in trades = less stress, fewer mistakes, more consistency.//
Disclaimer: This idea is for educational purposes only. Please do not place trades solely based on this setup.

ETH/USD – Testing Resistance Zone🔴 SHORT below $4,335 – target $4,278
Ethereum trades at $4,328, stalling under resistance at $4,334–4,340. SMA200 sits at $4,319. Support rests at $4,278. RSI flat near 55, showing no strong momentum. A rejection at resistance could trigger pullback.
📖 Keywords: #ETHUSD #Ethereum #CryptoReversal #AltcoinWatch #ShortSetup

Ethereum Accumulation and Bullish SetupEthereum is currently trading sideways, indicating an accumulation phase. On Monday, price swept equal lows and formed a long-wick bullish candlestick. The 4-hour chart shows two engulfing candles that cleared liquidity on both sides.
Technically, the market remains bullish and is consolidating. If momentum continues, ETH/USD may target the equal highs near $4,500. A confirmed close above the immediate support at $4,384 would validate this bullish outlook.

Will Ethereum lead next Altseason? ETF & Fusaka update in focus!Ethereum ETFs have recently seen significant inflows, outpacing Bitcoin ETFs, just ahead of the upcoming Fusaka upgrade in November.
Ethereum recently broke above its previous record high, a move that was anticipated in earlier analysis, and is pulling back before shooting higher. For a sustained move higher, a strong breakout with increased volume and momentum is needed. There are signs of momentum exhaustion, so traders should watch for confirmation before expecting further upside.
A classic cup and handle formation opens the door to $6,200 if resistance is cleared, with key support at $4,115 (previous resistance now acting as support) and a deeper pullback exposing $3,500. But this would not necessarily change the long-term bullish outlook.
Indicators to Watch
Bitcoin Dominance:
Bitcoin’s market dominance is currently around 55%, suggesting the market is still Bitcoin-led, and a true “altseason” may be at its early stage.
Total Crypto Market Cap:
Watch for breakouts in the total crypto market cap (TOTAL3 - excluding Bitcoin and Ethereum) and the formation of bullish patterns for confirmation of a broader market uptrend.
Altcoin Season Index:
The index remains below the threshold for a full altseason but is rising, indicating that Ethereum and other altcoins are not broadly outperforming Bitcoin but are nearing breakout.
Short/Medium-Term Outlook:
Expect continued consolidation or a possible pullback before any sustained move higher if support above $4,115 holds firm.
Long-Term Outlook:
As long as Ethereum holds above the 50% retracement level, the long-term trend remains positive. A confirmed breakout above resistance could signal the next major upward phase.
This content is not directed to residents of the EU or UK. Any opinions, news, research, analyses, prices or other information contained on this website is provided as general market commentary and does not constitute investment advice. ThinkMarkets will not accept liability for any loss or damage including, without limitation, to any loss of profit which may arise directly or indirectly from use of or reliance on such information.

ETH at Critical Resistance: Break $4500 or Consolidate?
ETH at Critical Resistance: Break $4500 or Consolidate?
Ethereum (ETHUSD) recently saw a significant rally followed by a notable correction, finding substantial support within the $4000 to $4100 "Fib Golden Level" and a descending trendline acting as dynamic support.
Currently, the price is consolidating above this critical support area, forming a series of swings within what appears to be a broader trading range, but is repeatedly encountering an "Immediate Resistance" at $4500.
A crucial challenge for ETHUSD is to decisively clear this $4500 immediate resistance before any substantial bullish breakout can be confirmed, with the next significant hurdle identified as the "Flipping Zone" at $4650.
Until these key resistance levels are overcome with conviction, Ethereum is expected to continue its current consolidative phase; a breakthrough above $4500 is essential to signal renewed up-ward momentum and negate further downside pressure.
Disclaimer:
The information provided in this chart is for educational and informational purposes only and should not be considered as investment advice. Trading and investing involve substantial risk and are not suitable for every investor. You should carefully consider your financial situation and consult with a financial advisor before making any investment decisions. The creator of this chart does not guarantee any specific outcome or profit and is not responsible for any losses incurred as a result of using this information. Past performance is not indicative of future results. Use this information at your own risk. This chart has been created for my own improvement in Trading and Investment Analysis. Please do your own analysis before any investments.

ETHUSD protracted sideways consolidation support at 4,100The ETHUSD remains in a bullish trend, with recent price action showing signs of a corrective pullback within the broader uptrend.
Support Zone: 4,100 – a key level from previous consolidation. Price is currently testing or approaching this level.
A bullish rebound from 4,100 would confirm ongoing upside momentum, with potential targets at:
4,450 – initial resistance
4,730 – psychological and structural level
5,070 – extended resistance on the longer-term chart
Bearish Scenario:
A confirmed break and daily close below 4,100 would weaken the bullish outlook and suggest deeper downside risk toward:
3,990 – minor support
3,830 – stronger support and potential demand zone
Outlook:
Bullish bias remains intact while the ETHUSD holds above 4,100. A sustained break below this level could shift momentum to the downside in the short term.
This communication is for informational purposes only and should not be viewed as any form of recommendation as to a particular course of action or as investment advice. It is not intended as an offer or solicitation for the purchase or sale of any financial instrument or as an official confirmation of any transaction. Opinions, estimates and assumptions expressed herein are made as of the date of this communication and are subject to change without notice. This communication has been prepared based upon information, including market prices, data and other information, believed to be reliable; however, Trade Nation does not warrant its completeness or accuracy. All market prices and market data contained in or attached to this communication are indicative and subject to change without notice.

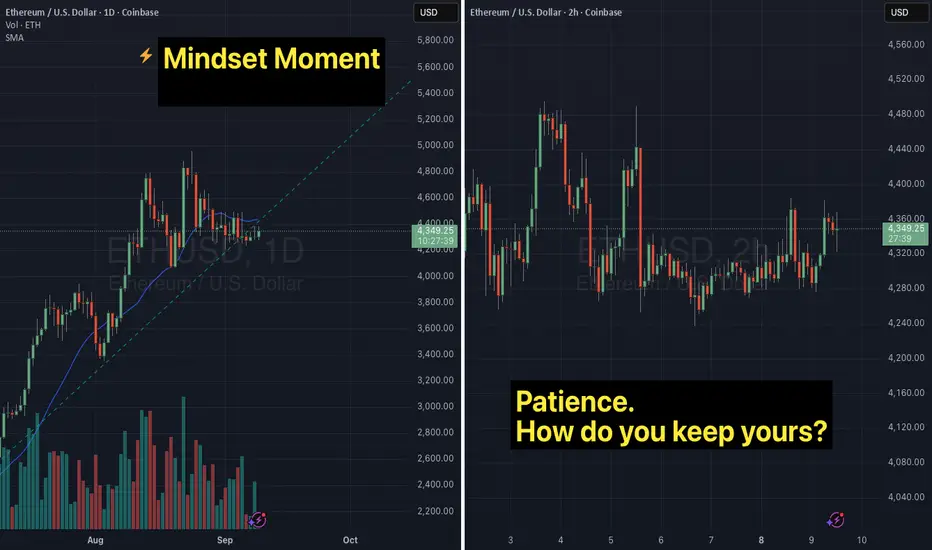
Patience: Is a virtue but it's damn hard...NOTE - This is a post on Mindset and emotion. It is NOT a Trade idea or strategy designed to make you money. If anything, I'm taking the time here to post as an effort to help you preserve your capital, energy and will so that you are able to execute your own trading system as best you can from a place of calm, patience and confidence'.
Here's a scenario:
You want the trade to hurry up… but the market has no reason to move on your timeline.
Here on Ethereum we see consolidation.
We can imagine traders framing for a break in either direction.
There will certainly be plenty trying their hand at getting ahead of the move and getting chopped.
Patience is one of the hardest skills for traders to master. The market doesn’t reward impatience it punishes it. If I'm honest, when I first started out, I certainly didnt think of patience as a 'skill' - but it's certainly essential. Without it, I've either wasted a lot of 'ammunition' in trying - or missed the whole point of a trade once I was depleted of will.
So offering some thoughts for you. Please take what resonates and ignore what doesn't work for you:
How impatience shows up:
You close trades too early because the profit feels “good enough.”
You jump into setups that haven’t confirmed because you’re tired of waiting.
You watch price drift sideways and feel an urge to “make something happen.”
You start to entertain thoughts that undermine your confidence.
You get distracted and do something else entirely risking missing the signal all together.
Emotional side:
Impatience often hides anxiety the need for relief, action, or certainty. Your body feels restless, your mind races with “what ifs,” and you start convincing yourself to bend your rules.
This is not 'woo'. It's an actual internal angst that causes one to act / behave in a way and at a time that is against ones intention. Ironically - as much as we ignore it - it' drives our behaviour.
So how can we get ahold of this to try and ensure it doesn't sabotage our intentions?
Consider the following and see if it works for you.
Shift your mindset
See patience as an active discipline and not just something that's passive. If we practice and nurture patience with mindfulness, the stronger the muscle to holding your ground, sticking to your process and letting the probabilities play out on their own clock not yours.
Practical tips .. the How ..:
When you feel that urge rising:
- notice where in your body you're feeling impatience.
- recognise how it's showing up for you (tension, irritation, restlessness - something else)
- notice what you are saying to yourself
- consider and assess : when was the last time I had a drink of water, had something to eat?
- do something physical to diffuse the feeling and get some energy back in the body:
stretch, breathe, walk away from the screen for a moment
put some music on and dance your ass off, do some burpees
set an alert on your screens, phone etc
Reminder yourself ... 'Waiting is a position too'.
I hope this helps. Interested in hearing what you do to instill and respect your patience
LONG ON ETHEREUMEthereum is coming from a major demand area after sweeping liquidity.
I am taking a buy limit order on ETH looking to catch price rising to the previous highs. Over 500-600 points.

Ethereum eyes $5,000 – but will bulls deliver?Ethereum eyes $5,000 – but will bulls deliver?
Ethereum trades near $4,356, holding above the 50-day EMA at $4,164, signaling strong support. Consolidation above $4,000 keeps the path open toward $4,600–$4,800, with a breakout potentially targeting $5,000.
On-chain activity and RSI at 52 suggest stability, while Bitcoin lags behind. Key supports: $4,164, $3,865, $3,213.
However, falling institutional inflows and weaker volumes pose risks. ETH saw $912M in outflows last week, erasing recent gains in investment products.
Bottom line: Technicals favor upside, but sustained buying is critical for a move to $5K.

ETHUSD - Resistance Now SupportA major resistance that has pushed price down many times has been broken out from
The dotted line is the last line of defense for resistance
I doubt this dotted line will hodl and a further breakout will occur
This is the Weekly chart
Bullish

ETHUSDLet´s put this trade for this 2 coming days.
Our strength indicator signaled an entry for this asset on the 3-hour and 4-hour timeframes, so we’ll place an order with a favorable risk-reward ratio. Tomorrow at midday, we’ll protect the position or close it, depending on its progress.
#ETH/USDT towards upper levels#ETH
The price is moving within a descending channel on the 1-hour frame, adhering well to it, and is heading for a strong breakout and retest.
We have a bearish trend on the RSI indicator that is about to be broken and retested, which supports the upward breakout.
There is a major support area in green at 4260, which represents a strong support point.
For inquiries, please leave a comment.
We are in a consolidation trend above the 100 Moving Average.
Entry price: 4300
First target: 4333
Second target: 4378
Third target: 4427
Don't forget a simple matter: capital management.
When you reach the first target, save some money and then change your stop-loss order to an entry order.
For inquiries, please leave a comment.
Thank you.

Did you Buy ETH or SELL? COINBASE:ETHUSD
📈 ETH TradingView Idea – Long Description (Buy Bias)
Ethereum (ETH) is currently trading in a volatile but constructive range between $4,200 and $4,950, with strong technical and fundamental support favoring a buy-the-dip strategy. Here's a breakdown of the long idea:
🧠 Fundamental Drivers
- Spot ETH ETF inflows remain robust, with multi-billion-dollar monthly additions supporting price stability.
- On-chain metrics like DeFi TVL, daily transactions, and active addresses are near 2025 highs, signaling real usage.
- The Pectra upgrade and upcoming scalability improvements boost medium-term confidence.
- Macro factors (Fed rate guidance, risk sentiment) remain the key swing variables.
📊 Technical Setup
- Immediate Support: $4,300–$4,350
- Deeper Support: $4,150–$4,200
- Resistance Levels: $4,600 (pivot), then $4,950–$5,000
- Trendline: ETH is respecting a strong ascending trendline, showing bullish momentum.
- Breakout Zone: Price broke above consolidation near $4,800, confirming bullish continuation.
🎯 Target Zones
- Primary Target: $4,950–$5,000
- Extended Target: $5,200 if momentum sustains and price holds above $4,600
⚠️ Risk Factors
- Macro downside surprises (e.g., hawkish Fed)
- ETF outflows or regulatory setbacks
- Failure to hold above $4,300 could trigger retests of lower support zones
🧭 Trading Bias
Buy on dips near $4,300–$4,350 with tight risk management. A decisive close above $4,600 opens the path toward $5,000+. If price breaks below $4,300, reassess for potential short-term weakness.

Stage 2 Breakout Incoming on ETH - 8k Post HasteETH is currently in a tight as a tiger sideways range ater making higher highs and higher lows consecutively. Simultaneously, the 150 has crossed the 200ma and they are both pointed upwards below this uptrend.
Accordingly, ETH is in the most explosive and rewarding phase of a stage 2 uptrend.
Zoom out and it's in a parabolic advance. Its time for faces to melt.
Win or dont play.

ETHUSD 1H – Critical Breakout Zone Ahead | BUY LIMIT SELL ACTIVEBITSTAMP:ETHUSD
Structure | Trend | Key Reaction Zones
Ethereum is stuck between resistance at 4,324–4,362 and strong support at 4,215. Price is consolidating, and a breakout will define the next big move.
Market Overview
Buyers are defending the 4,215–4,230 demand zone. A push above 4,362 will confirm bullish continuation toward 4,400+, but rejection could drag ETH back toward 4,215.
Key Scenarios
✅ Bullish Case 🚀
Target 1: 4,324
Target 2: 4,362
Target 3: 4,400 – 4,437
Stop Loss: Below 4,282
Current Levels to Watch
Resistance 🔴: 4,324 – 4,362
Support 🟢: 4,230 – 4,215
⚠️ Disclaimer: This analysis is for educational purposes only. Not financial advice.

Bitcoin & Ethereum ICT Market Analysis | Liquidity Levels to WatIn this week’s crypto market outlook, I break down the total market cap, Bitcoin (BTC), and Ethereum (ETH) using the ICT trading strategy.
📊 What’s inside:
- Key ICT liquidity levels for BTC & ETH
- Market cap structure and directional bias
- My trade outlook for the week ahead
This video is designed to help traders understand the bigger picture and plan their setups with ICT concepts in mind.
👉 Comment below: Do you think BTC will hold above current liquidity, or sweep lower before moving up?
#Crypto #Bitcoin #Ethereum #ICTTrading #CryptoAnalysis #BTC #ETH
