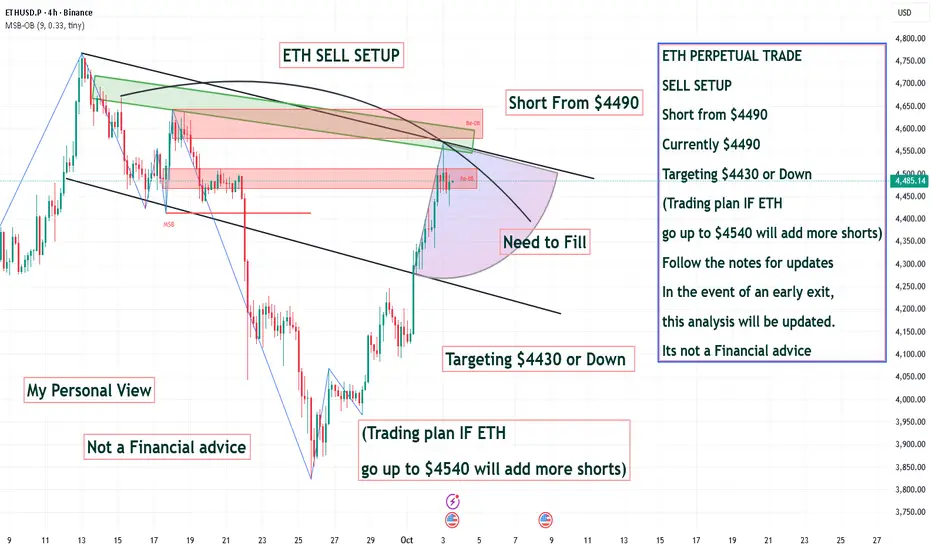
ETH PERPETUAL TRADE SELL SETUP Short from $4490ETH PERPETUAL TRADE
SELL SETUP
Short from $4490
Currently $4490
Targeting $4430 or Down
(Trading plan IF ETH
go up to $4540 will add more shorts)
Follow the notes for updates
In the event of an early exit,
this analysis will be updated.
Its not a Financial advice
ETHUSD trade ideas
BTC smashes 120K, ETH tests 4.5K! Is Altseason finally here?Bitcoin breaks through $120K while Ethereum retests critical $4500 resistance. Our analysis reveals why this "Uptober" rally could signal the start of the biggest altcoin surge since 2021.
🚀 Rally catalysts
US Government shutdown : Dollar weakness from political uncertainty and Fed policy paralysis
"Uptober Effect" : Bitcoin historically averages 20%+ gains in October (currently up 5-6% with 3 weeks remaining)
Institutional flows: $4B+ institutional buying, 850K ETH whale accumulation in past 2 weeks
Q4 seasonality: Crypto's strongest quarter with historical momentum into year-end
📊 Bitcoin Technical Analysis
Pattern : Bullish hidden divergence confirmed with swing high breakout above $118K resistance
Current structure : Potential 5-wave Elliott sequence suggesting final impulse leg
Key levels : Support at $117K (trendline), resistance cluster $122K-$124K
Momentum : RSI recovering, MACD bullish crossover confirms continuation
⚡ Ethereum technical breakdown
Weekly setup : Successful retest and hold above $4K support, pennant/triangle breakout in play
RSI divergence : Bullish divergence confirmed on multiple timeframes, RSI near 60 (room to 70+)
Elliott wave count : Either completing Wave 5 (correction ahead) or early Wave 3 (massive move higher)
Cup & Handle : Measured move target to $6,850 based on long-term pattern
🔥 Altseason indicators - Total3 analysis
Chart pattern : Cup & handle formation on Total3 (altcoins ex-BTC/ETH) approaching ALL-TIME HIGHS
Key level : $1.1T breakout threshold - confirmation needs 3 daily closes above ATH
BTC dominance: Break below 60% support signals potential altcoin rotation
Targets: $1.2T initial, $1.3T extension if breakout sustains
💹 Trading Strategy
ETHEREUM LONG Setup:
Entry: $4,300 on pullback (current: $4,500)
Stop Loss : Below $4,050 (1.618 Fib extension)
Take Profit 1 : $5,200 (2:1 R/R)
Take Profit 2 : $6,850 (measured move target)
Risk Management : Trail stops above breakeven after TP1
Key levels to watch:
Bitcoin : $117K support, $122-124K resistance zone
Ethereum : $4,126 critical support, $4,500 resistance, $6,850 long-term target
Total3 : $1.1T breakout level for altseason confirmation
🎯 Market outlook
October living up to "Uptober" reputation with favourable macro setup. Dollar weakness, institutional flows, and technical breakouts align for potential crypto supercycle. Watch Total3 breakout - if altcoins breach ATH, we could see 2021-style altseason explosion.
This content is not directed to residents of the EU or UK. Any opinions, news, research, analyses, prices or other information contained on this website is provided as general market commentary and does not constitute investment advice. ThinkMarkets will not accept liability for any loss or damage including, without limitation, to any loss of profit which may arise directly or indirectly from use of or reliance on such information.

$ETH market update 5-10-2025📊 Ethereum Market Update (on request)
Right now, there’s nothing major happening for Ethereum. It continues to consolidate in a range between the ATH at $4800 and the $3800 level, because of this massive bearish divergeance.
On the daily chart, the MACD is bullish and the Stochastic RSI is supportive, but momentum looks exhausted. There isn’t much conviction in this move. Bitcoin is the real superstar, while Ethereum is fading in its shadow.
From my analysis, we might still have about one more week of growth, potentially pushing to a new ATH — but don’t expect a parabolic rally. This looks more like a technical follow of BTC rather than genuine investor interest.
⚠️ That means the probability is high that we see a dump back below $4000, likely testing $3800 as support.
If bulls regain control and Bitcoin rotation restarts, ETH could resume its rally. Otherwise, we may see deeper consolidation, possibly down to $3400, before finding the energy to push again toward a new ATH.
#Ethereum #ETH #EthereumPrice #Crypto #CryptoNews #CryptoMarket #Bitcoin #BTC #Altcoins #Trading #TechnicalAnalysis #CryptoUpdate #MACD #StochasticRSI #ATH #CryptoTrading #Investing

ETHEREUM BULLISH BREAKOUT|LONG|
✅ETHUSD shows a clean breakout above the key level as ICT traders anticipate continuation toward the next liquidity pool near 4,760$. Price may retest the breakout zone before pushing higher. Time Frame 2H.Setup Risk: High!
LONG🚀
✅Like and subscribe to never miss a new idea!✅

ETH BUY (Long) Update from $4350ETH BUY (Long) Update from $4350
20% Longs added from $4350
Right now around $4350
Support Levels $4200-4300
Targets to Watch $4600 ,$4640 & $4670
Even possible to $4700 or Above
Stoploss $4150
Not a Financial advice

ETH:Plummeting sharplySince October, Ethereum has exhibited an extreme price trend of "rallying and then pulling back – plummeting sharply", reflecting violent swings in market sentiment between "optimism over technological prospects" and "macro-driven risk aversion".
The psychological levels of 3,400 and 4,000 serve as crucial short-term support. If the price breaks below 3,400, a flood of stop-loss orders may be triggered. Resistance is concentrated around 4,500 , and an effective breakout will require confirmation from increased trading volume.
In the short term, affected by lingering panic and insufficient trading volume, Ethereum is likely to consolidate within the 3,400–4,500 range. Close attention should be paid to the validity of the 3,400 support level.

ETHUSD Bullish Trend Potential | Break and Retest Trade Plan📹 In this video, we take a closer look at Ethereum (ETH), which has been in a strong bullish trend on the higher time frames 🔥. Recently, ETH has seen a deep pullback, offering potential opportunities if price action confirms a bullish break of market structure on the 30-minute timeframe ⏱️.
💡 I’m watching for a break and retest of the existing range low support, which could signal a continuation of the broader uptrend.
📊 In the video, we cover price action, market structure, trend analysis, and share a trade idea based on these factors 🎯.
⚠️ Disclaimer: This content is for educational purposes only and not financial advice.

Eliots wave 5 to $7500Acording to the ascending channel and the eliots wave pattern ethereum could be heading for $7500 by the end op uptober.
Bitcoin made its rally ahead already. Ethereum will follow.

ETHUSD Approaching Highs, On-Chain Activity Shows CautionETHUSD is near its recent all-time high, with accumulation by large holders and institutions. Exchange balances have declined to multi-year lows. On-chain data shows daily active addresses increased in late Sep, while transaction volumes, protocol usage, and ETH burned have decreased, exposing near-term downside risk if network demand and burn rates do not recover.
ETHUSD rebounded from the ascending channel's lower bound at 3880 and closed above the Ichimoku Cloud. A break above the Fibonacci Confluence zone and 5000 psychological resistance may prompt further gains toward the 127.2% Fibonacci Extension at 6000. Conversely, a bearish breakout of the channel and close below the 3880 support may prompt a further decline to the following support at 3400.
By Li Xing Gan, Financial Markets Strategist Consultant to Exness

ETHUSD on the edge!! 3 reasons why i will short ETHUSD today:
- It's testing the trendline
- It's at the fibo levels, and..
- the upward movement created a bearish divergence
LET'S GO BEAR!! CHEEEERRRSSSS...!!!
Megaphone pattern eth potentially to go up to.....With this potential megaphone pattern, there is no way the bull run is over.
For eth to pump to geary ATH's, it NEEDED to this correction, or test the diagonal support line.....
As you can see the measurements have been taken, the dotted lines, give an indication where ETH may hit, minimum $6500!!
Any thoughts would be ever so grateful, including constructive criticism.
ETHSimple chart :
- Don’t fight the trend, just stick to your strategy.
- follow the signs.
- Never go all in and always DCA.
Only this way we will learn to master our emotions.
Happy Tr4Ding !

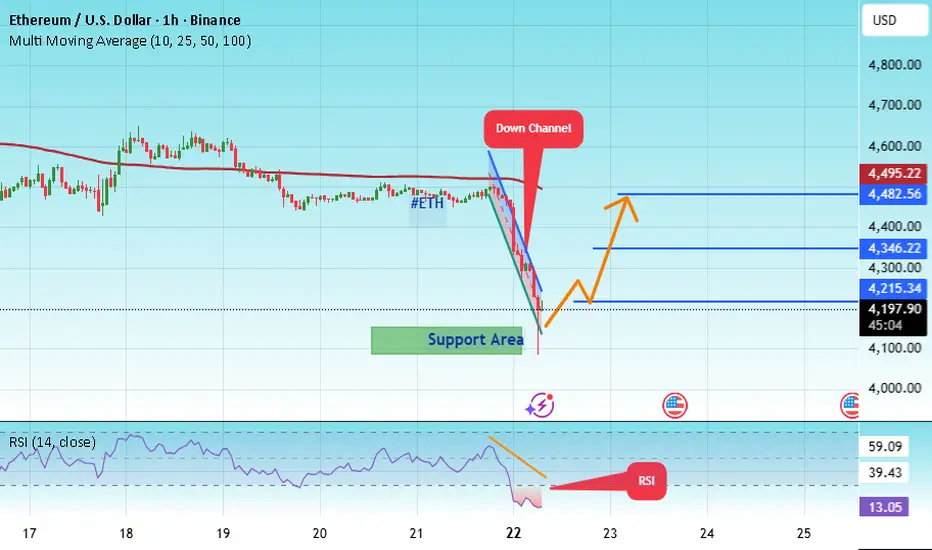
#ETH/USD - Roll back - Its coming baack to 4500#ETH
The price is moving within a descending channel on the 1-hour frame, adhering well to it, and is heading for a strong breakout and retest.
We have a bearish trend on the RSI indicator that is about to be broken and retested, which supports the upward move.
There is a major support area in green at 4111, which represents a strong support point.
We are heading for consolidation above the 100 moving average.
Entry price: 4136.
First target: 4215.
Second target: 4346.
Third target: 4482.
Don't forget a simple matter: capital management.
When you reach the first target, save some money and then change your stop-loss order to an entry order.
For inquiries, please leave a comment.
Thank you.
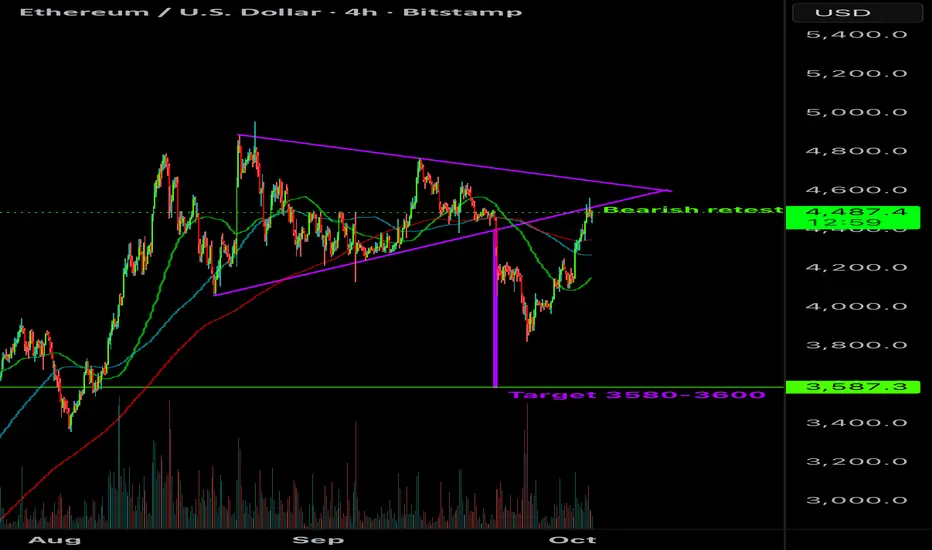
ETH Bearish Retest?Could be looking at a bearish retest of the symmetrical triangle breakdown.
Target remains around $3600. Bearish divergences also confirming potential here.
Ethereum in a blazing October bull flag | The explosion is here!You’re making a mistake if you’re only looking at the chart!!
Because Tom Lee does not see a 10x jump based on that.
Don’t let technical analysis mislead you.
Indicator
Ethereum: Exchange Reserve – All Exchanges
Shows us the largest Ethereum withdrawals from exchanges — the supply shock, just like with Bitcoin, is here.
Indicator
ETH: Balance on Accumulation Addresses
27,700,000 ETH accumulated that will never be sold.
The M2 indicator shows us that liquidity is pushing us upward.

Zoom out $ETH Ethereum is currently retesting the same area after breaking its major falling that has been ongoing since 2021.
The area that was previously resistance is now a strong demand zone.
The pullback in the short term is not a cause for panic, but rather a healthy retest in the bigger picture.
The trend remains upward, and staying above the demand zone will mark the beginning of Ethereum's next major run.

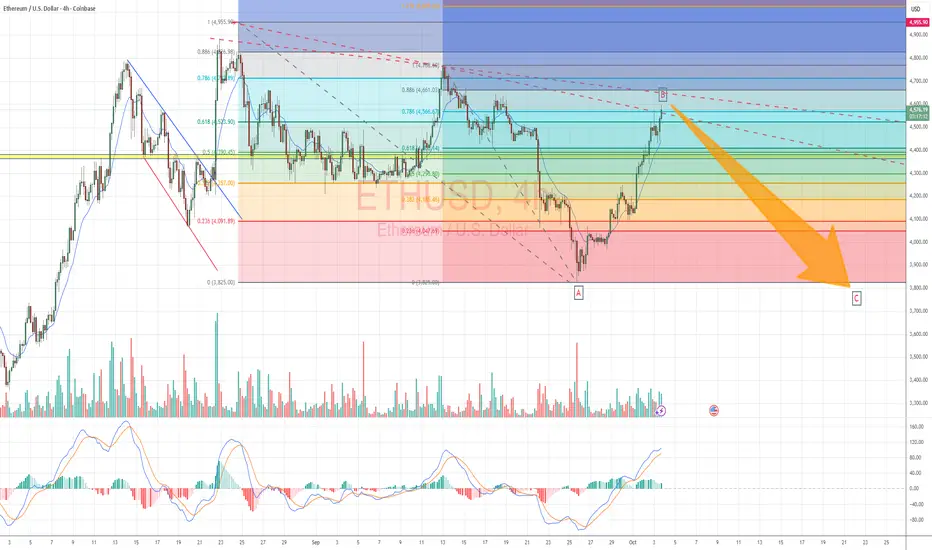
Ethereum Daily Chart (Sell on Rise)Wave Count (Green Labels 1–5):
A 5-wave impulsive move appears to have completed, marking a bullish cycle peak.
Complex Correction (W-X-Y-X-Z pattern):
The correction after the 5th wave is labeled as a Complex Correction, composed of:
Wave W – Zigzag
Wave X
Wave Y – Flat (3-3-5)
Wave X – Smaller bounce
Wave Z – Currently unfolding with a Diametric Pattern (7-wave structure)
📉 Current Market Structure
Ethereum is in a corrective phase, currently moving through the Z wave of the complex correction.
The correction appears to be forming another Diametric Pattern, potentially indicating one final drop before resuming upward.
🛒 Key Buying Zones Highlighted
Upper Buying Zone (~$4,400 to $4,600)
If ETH breaks bullish earlier than expected.
Lower Buying Zone (~$3,600 to $3,800)
More likely based on the projection shown.
Where the final leg (Z) is expected to complete.
📈 Projected Path
Price is expected to dip into the lower buying zone as the Diametric pattern completes.
Following that, a strong bullish reversal is anticipated, likely leading to a new impulsive wave up.
📝 Patterns Used
Zigzag
Flat (3-3-5)
Diametric Pattern – A 7-legged corrective structure, less common, indicating prolonged correction.

ETHUSD: Reversal Expected Near 4100The bullish outlook remains unchanged. We are expecting the price to reverse near 4100 . The sharp move on wave a, a small correction for wave b, indicates a sharp decline and rapid rise in the upcoming days.
Previous research:
Stay Tuned!
@money_dictators
Thanks :)

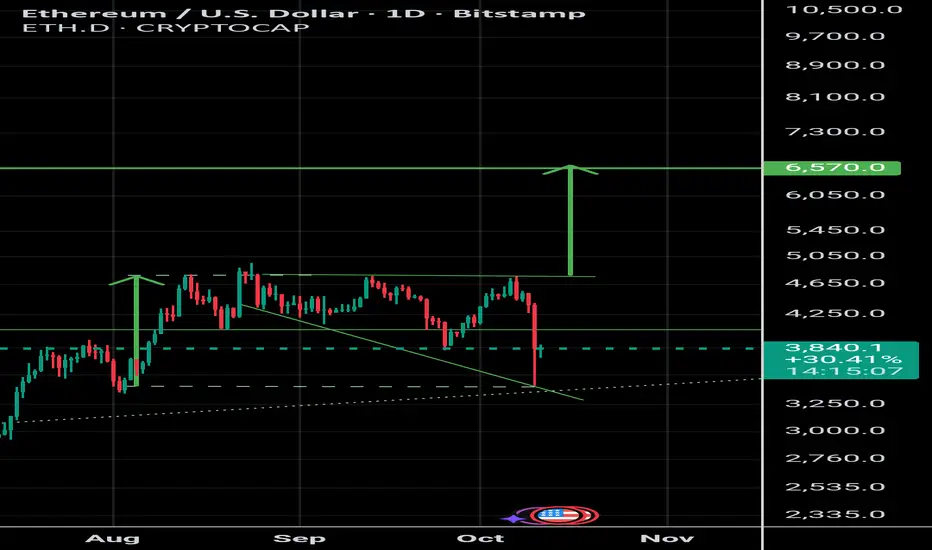
$ETH 3rd Cycle the retest before parabolic.We can see that Ethereum has exhibited a similar pattern before every major bull run.
1st Cycle (2017)
Retest of the demand zone, followed by a parabolic rise.
2nd Cycle (2020)
Same structure, same momentum.
3rd Cycle (2025)
We are now back in the same zone, Pre-Parabolic phase after retest.
This is not just a correction, it will be the beginning of the next major wave of Ethereum.

ETHUSD Breaks The Channel, Pointing Above 5kEthereum has been rising sharply over the last two weeks after only a three-wave retracement from all-time highs, so it looks like a textbook fourth-wave pullback within an incomplete bullish structure that is now ready to resume. We’re seeing a break and push beyond the upper line of the corrective channel, suggesting price is stepping into wave five, so more upside can show up in the weeks ahead.
Ideally, price could rise beyond 5000, possibly even toward 5336, where wave five could match the distance of wave two.
When it comes to potential trading setups, it may be interesting to watch for intraday retracements, especially if we see one while the market still trades below wave three highs. Then, opportunities could show up around the 4350–4500 support area.
GH

Remaining strong - ETH weekly update 06 - 12th OctAfter some misconceptions in the past, I am back with new knowledge now. I think Ethereum currently unfolds the 5th wave in the intermediate cycle, which completes the 1st wave in the primary cycle and means the first step towards the end of the bullrun. It is crucial to sustain this pump now, as if not it would signal us that the 4th wave of the intermediate cycle is not completed yet. If so, the alternative scenario comes into play and we would form a drop out of 5 parts. The indicators rather support this move, as the strength of the trend rises and momentum pushes higher meanwhile the RSI enters overbought areas as expected from 3rd waves. Besides that, funding rates are rising as we would like to and the open interest shows inflow. Taking a look at the week in front of us, Jerome Powell is going to have a speech on thursday at the Community Bank Conference. Volatility is expected. On friday we will also receive some economic data like the unemployment rate.
Have a sucessful week,
Phillip

Dejavu Ethereum Version.Same setup, same rhythm, just a different cycle.
The 2020 ETH chart is progressing almost identically to 2025.
The September low, followed by the October start and then that mega run.
The upcoming period will mark the beginning of a new era.
CRYPTOCAP:ETH 🔃

$ETH Before the parabolic expansion.ETH is once again in a similar technical structure to that seen before its parabolic run in 2020.
As was the case then, the falling trend breakout and subsequent retest phase are now complete.
As seen previously, the RSI is still holding above the 50 level, clearly indicating that momentum continues in a positive direction.
The structure is clear in both linear and stick bar charts.
The trend has broken, the retest is happening, and Ethereum is on the verge of a major expansion movement.
