ETH LONG TA UPDATE Anything below $4480, is a good buy ETH LONG TA UPDATE
Anything below $4480, is a good buy
Right now at $4470
Stoploss at $4200
Demand Zone $4350-4450
Expecting a bounce soon
towards $4710-4730 Area
Targeting $4730 or Above
Not a Financial advice
ETHUSD trade ideas

ETHUSD: Reversal Expected Near 4100The bullish outlook remains unchanged. We are expecting the price to reverse near 4100 . The sharp move on wave a, a small correction for wave b, indicates a sharp decline and rapid rise in the upcoming days.
Previous research:
Stay Tuned!
@money_dictators
Thanks :)

#ETH/USDT looking extremely bullish#ETH
The price is moving within a descending channel on the 1-hour frame, adhering well to it, and is heading for a strong breakout and retest.
We have a bearish trend on the RSI indicator that is about to be broken and retested, which supports the upward move.
There is a major support area in green at 4400, which represents a strong support point.
We are heading for consolidation above the 100 moving average.
Entry price: 4455
First target: 4512
Second target: 4573
Third target: 4650
Don't forget a simple matter: capital management.
When you reach the first target, save some money and then change your stop-loss order to an entry order.
For inquiries, please leave a comment.
Thank you.

EthereumETHUSD
- RSI - Divergence
- Order Block
- Demand Zone
- Fibonacci Level - 38.20%
- Completed " 1234 " Impulsive Waves

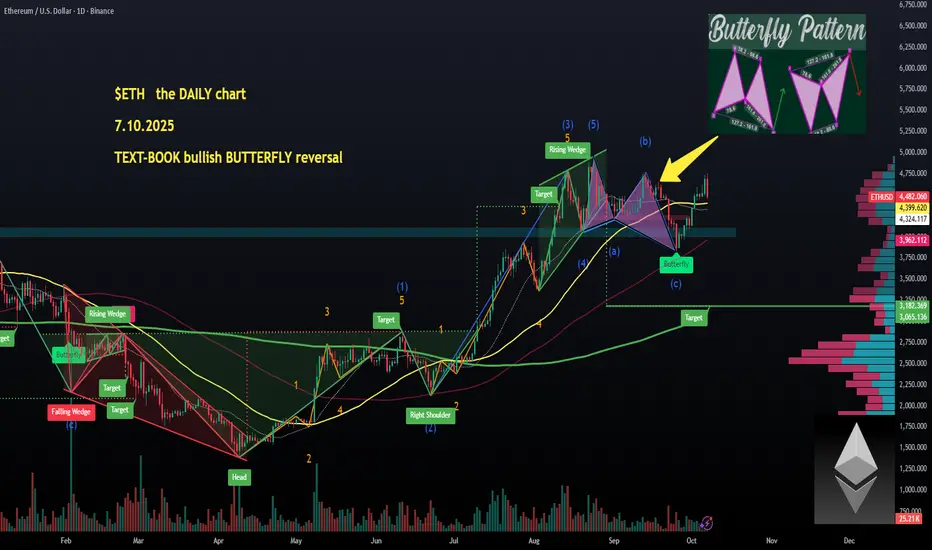
$ETH (1-D): text-book BUTTERFLY reversal. Rare speciesThese text-book BUTTERFLY harmonic patterns are very rare species and I have learnt the hard way to NEVER ever trade against them.
I don't even wanna think how much money I lost over the years when I wasn't paying attention to them. They are just very very difficult to detect with a naked eye.
So here, my gift to all my regular reader who are into TECHNICAL ANALYSIS: on trandingview you can switch on this indicator that detects them automatically once they appear.
Use it. Costs you nothing, and don't ever go against them. You can even base your positions on them and turn good profit.
CRYPTOCAP:ETH was $4100+ on SEP 29 when I published the quoted post, it was not BULLISH yet and the BUTTERFLY by itself gave a LONG signal.
Another weapon in your arsenal, and 99% of traders NEVER use it💙👽
ETH - Inverse H&S PatternWanted to outline this potential pattern we have noticed on the lowertimeframes, then will zoom out and make a higher timeframe post as well.
The main range ETH has been trading in for a while now is between our red line and white line. There have only been two deviations both above and below this pattern before the range was reestablished.
If ETH is to break the $5k ATH resistance level then this bullish pattern that could be developing could give ETH the fuel to push through.
This pattern is an inverse Head & Shoulders pattern is ETH can hold the levels price is currently at.
After getting rejected at our red line ETH fell to around the $4,250 level for a while creating a rounding bottom and "LEFT SHOULDER"
Price rebounded, was rejected at our red line again, and plummeted below our white line creating a lower deviation and also what we can identify as the "HEAD" of this pattern.
Price rebounded once again all the way to the red line, got rejected and now have been falling back to the $4,250 level. If we can see bulls hold this level and form the predicted "RIGHT SHOULDER" of this pattern, then the next time price visits the red line we should break through it decisively.
If that is the case, the Measured Move price target of this potential Inverse Head & Shoulders Pattern would be $6k.


ETHUSD falling resistance retest?The ETHUSD remains in a bullish trend, with recent price action showing signs of a breakout within the broader uptrend.
Support Zone: 4,395 – a key level from previous consolidation. Price is currently testing or approaching this level.
A bullish rebound from 4,395 would confirm ongoing upside momentum, with potential targets at:
4,670 – initial resistance
4,770 – psychological and structural level
4,860 – extended resistance on the longer-term chart
Bearish Scenario:
A confirmed break and daily close below 4,395 would weaken the bullish outlook and suggest deeper downside risk toward:
4,330 – minor support
4,250 – stronger support and potential demand zone
Outlook:
Bullish bias remains intact while the ETHUSD holds above 4,395. A sustained break below this level could shift momentum to the downside in the short term.
This communication is for informational purposes only and should not be viewed as any form of recommendation as to a particular course of action or as investment advice. It is not intended as an offer or solicitation for the purchase or sale of any financial instrument or as an official confirmation of any transaction. Opinions, estimates and assumptions expressed herein are made as of the date of this communication and are subject to change without notice. This communication has been prepared based upon information, including market prices, data and other information, believed to be reliable; however, Trade Nation does not warrant its completeness or accuracy. All market prices and market data contained in or attached to this communication are indicative and subject to change without notice.

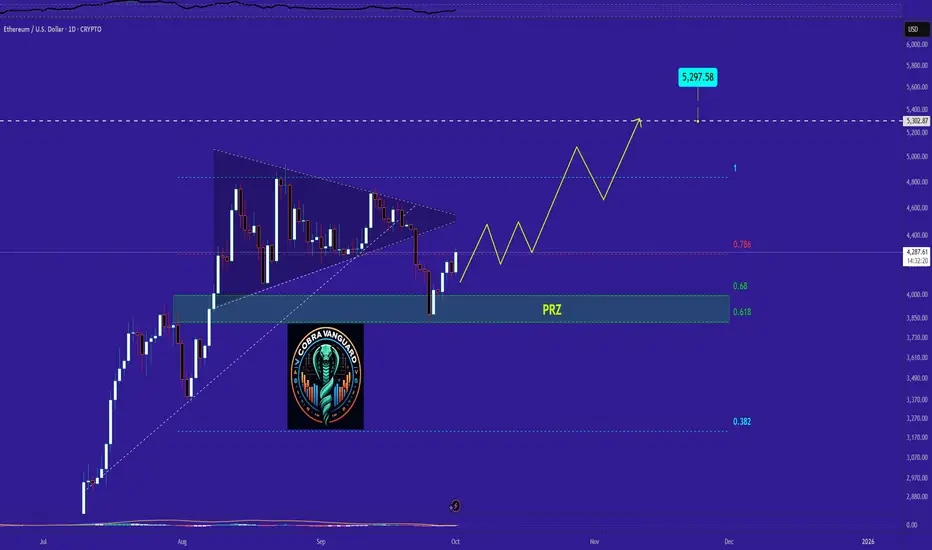
"ETH Analysis" (Update)The price can easily reach the shown targets from here.
Best regards CobraVanguard.💚
PREVIOUS ANALYSIS
Fakeout, now breakout.Rejected the top resistance fell, then broke.. only up from here. Target potential between nov 11 to December 11.. minimum 11,500..

My view on ETH This is my though on Ethereum in the last moments of this bullcycle!
I shoot at green box. Every small downturn are only oppertunity to buy as long as we not starting to trend down with lower lows and lower highs. RSI have bottomed out and ready for some more action! Take care and have fun trading :)

ETH 2020\2025Ethereum Parabolic run is coming.
same vibes \ same setup \ different cycle
CRYPTOCAP:ETH ⟠

ETHUSD - Bubble Territory Band Using this indicator that predicts higher than 15000
That is pretty astounding if it really occurs.
Indicator analysis on this Weekly timeframe

Ethereum Wave Analysis – 6 October 2025- Ethereum broke daily down channel
- Likely to rise to resistance levels 4755.00 and 5000.00
Ethereum cryptocurrency recently broke the resistance trendline of the daily down channel from the end of August (which encloses the previous intermediate ABC correction (2)).
The breakout of this down channel accelerated the active intermediate impulse wave (3) – which started earlier from the round support level 4000.00.
Given the clear daily uptrend, Ethereum cryptocurrency can be expected to rise to the next resistance level 4755.00 (top of the earlier wave B) – the breakout of which will open the way for further gains toward 5000.00.

ETH LONG eth sweep low , i expect us to continue expanding upwards from here .
Targeting premium arrays near 4,560+
Stop-loss below the SMT / OB low (4,430)

ETH/USD: $6,000 at the End of the Cycle in Late 2025?While the debate over the timing of the end of the bullish cycle continues, Ether (ETH) has reached the 26th position worldwide ($540 billion USD) in the ranking of global market capitalizations across all asset classes. For comparison, gold ranks first at $27 trillion USD, and Bitcoin is in 7th place with $2.45 trillion USD.
Regarding Bitcoin’s price and the possible dates for the end of the bullish cycle linked to the 2024 halving, I invite you to click on the chart below. You’ll see that the end-of-cycle window lies between October 18 and November 20.
But let’s return to the focus of this analysis: Ethereum — specifically the ETH/USD price and a realistic price target for this cycle, taking into account its positive correlation with Bitcoin.
In this article, I will rely on chart analysis using weekly and daily timeframes, applying classical charting tools, Elliott Waves, and Fibonacci extension ratios.
1) According to the medium-term chart (Japanese candlesticks, weekly data), the underlying trend remains bullish above the $3,800 support.
The chart below shows that ETH/USD’s long-term trend remains bullish as long as the market price holds above a large triangular pattern that broke upward this summer. The primary trend is therefore bullish above the $3,800 support on a weekly closing basis.
The first chart below shows ETH/USD weekly Japanese candlesticks:
2) According to Elliott Wave analysis, the final end-of-cycle target could be $6,000 by late 2025.
On this Ethereum (ETH/USD) chart, Elliott Wave analysis shows a five-phase bullish structure, with Wave 5 yet to come. After the Wave 4 correction, the market appears to have found a bottom around $3,800 — an area corresponding to the 0.382 retracement of Wave 3. The current recovery suggests the potential start of the fifth impulsive wave.
The theoretical target for Wave 5 is around $6,000, corresponding to a 0.618 Fibonacci extension from the bottom of Wave 1 to the top of Wave 3, projected from Wave 4. This level also aligns with a major psychological zone and a classic target for the end of a full bullish cycle.
As long as the price stays above $3,800, this remains the most likely technical scenario.
The second chart below shows ETH/USD daily Japanese candlesticks:
DISCLAIMER:
This content is intended for individuals who are familiar with financial markets and instruments and is for information purposes only. The presented idea (including market commentary, market data and observations) is not a work product of any research department of Swissquote or its affiliates. This material is intended to highlight market action and does not constitute investment, legal or tax advice. If you are a retail investor or lack experience in trading complex financial products, it is advisable to seek professional advice from licensed advisor before making any financial decisions.
This content is not intended to manipulate the market or encourage any specific financial behavior.
Swissquote makes no representation or warranty as to the quality, completeness, accuracy, comprehensiveness or non-infringement of such content. The views expressed are those of the consultant and are provided for educational purposes only. Any information provided relating to a product or market should not be construed as recommending an investment strategy or transaction. Past performance is not a guarantee of future results.
Swissquote and its employees and representatives shall in no event be held liable for any damages or losses arising directly or indirectly from decisions made on the basis of this content.
The use of any third-party brands or trademarks is for information only and does not imply endorsement by Swissquote, or that the trademark owner has authorised Swissquote to promote its products or services.
Swissquote is the marketing brand for the activities of Swissquote Bank Ltd (Switzerland) regulated by FINMA, Swissquote Capital Markets Limited regulated by CySEC (Cyprus), Swissquote Bank Europe SA (Luxembourg) regulated by the CSSF, Swissquote Ltd (UK) regulated by the FCA, Swissquote Financial Services (Malta) Ltd regulated by the Malta Financial Services Authority, Swissquote MEA Ltd. (UAE) regulated by the Dubai Financial Services Authority, Swissquote Pte Ltd (Singapore) regulated by the Monetary Authority of Singapore, Swissquote Asia Limited (Hong Kong) licensed by the Hong Kong Securities and Futures Commission (SFC) and Swissquote South Africa (Pty) Ltd supervised by the FSCA.
Products and services of Swissquote are only intended for those permitted to receive them under local law.
All investments carry a degree of risk. The risk of loss in trading or holding financial instruments can be substantial. The value of financial instruments, including but not limited to stocks, bonds, cryptocurrencies, and other assets, can fluctuate both upwards and downwards. There is a significant risk of financial loss when buying, selling, holding, staking, or investing in these instruments. SQBE makes no recommendations regarding any specific investment, transaction, or the use of any particular investment strategy.
CFDs are complex instruments and come with a high risk of losing money rapidly due to leverage. The vast majority of retail client accounts suffer capital losses when trading in CFDs. You should consider whether you understand how CFDs work and whether you can afford to take the high risk of losing your money.
Digital Assets are unregulated in most countries and consumer protection rules may not apply. As highly volatile speculative investments, Digital Assets are not suitable for investors without a high-risk tolerance. Make sure you understand each Digital Asset before you trade.
Cryptocurrencies are not considered legal tender in some jurisdictions and are subject to regulatory uncertainties.
The use of Internet-based systems can involve high risks, including, but not limited to, fraud, cyber-attacks, network and communication failures, as well as identity theft and phishing attacks related to crypto-assets.

ETHEREUM (ETHUSD): Time to RecoverIt appears that a confirmed bullish reversal is evident on the 📈Ethereum, following a test of a significant daily horizontal support level.
The formation of an ascending triangle pattern, coupled with a subsequent violation of its neckline, suggests a strong bullish signal.
I believe that the price may soon reach at least the 4,400 resistance level.

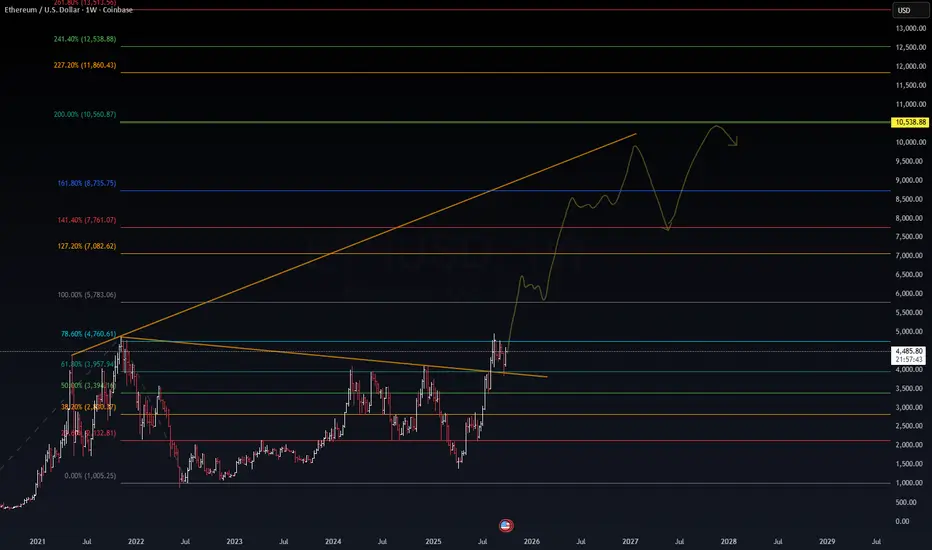
$ETHUSD – Multi-Year Expansion Structure | VolanX Macro FrameworBITSTAMP:ETHUSD – Multi-Year Expansion Structure | VolanX Macro Framework ⚙️
📍 Current Price: $4,488.99
📊 Timeframe: Weekly
🧠 Model Context: VolanX Macro Liquidity Map v1.9
Technical Outlook
Ethereum has broken out from a multi-year descending structure, confirming the end of its 2022–2024 accumulation cycle.
The breakout aligns with Fibonacci expansion confluence levels projecting a multi-phase institutional rally.
Key Fibonacci Zones:
0.786 (4,760) → current breakout zone
1.0 (5,783) → initial target / structural confirmation
1.272 (7,082) → reaccumulation band
1.618 (8,735) → high liquidity expansion level
2.0 (10,560) → macro wave completion
2.414 (12,538) → euphoric blow-off potential
The projection path implies a two-wave expansion: initial breakout to ~$8.7K, retrace to ~$7K, then final leg to ~$10.5K–$12.5K.
Macro & Fundamental Drivers
Ethereum ETF Approvals (U.S. + Global)
Regulatory acceptance of spot ETH ETFs opens institutional liquidity pipelines and enhances legitimacy.
Staking Economics & Supply Compression
Over 27% of ETH supply is now staked, significantly reducing available float and increasing sensitivity to inflows.
L2 Expansion & Ecosystem Maturity
Rollups (Arbitrum, Optimism, Base, zkSync) continue to scale transaction throughput → network value consolidation.
Monetary Backdrop
Fed rate pivot expectations for mid-2026 → renewed risk-on appetite.
Dollar liquidity cycle bottoming out favors crypto risk assets.
AI + Tokenization Narrative
Ethereum remains the dominant infrastructure layer for tokenized assets and AI-integrated DeFi protocols — a key driver for 2026–2028 adoption cycles.
VolanX Institutional Outlook
Bias: Long-term bullish
Phase: Post-breakout reaccumulation
Short-term risk: Pullback toward $4.0K–$4.3K equilibrium
Mid-term targets: $7.1K → $8.7K
Long-term extension: $10.5K → $12.5K
The overall structure mirrors Ethereum’s 2020 setup: compression → breakout → expansion → rebalancing.
“Liquidity follows conviction, and conviction forms where structure and macro align.
VolanX models show ETH entering its next institutional expansion phase.”
🧠 VolanX Principle: Structure first. Sentiment later. Liquidity always follows.
#ETHUSD #Ethereum #VolanX #SmartMoney #DeFi #AITrading #MacroOutlook #LiquidityCycle #Crypto
Ethereum Beautiful RetestQuick Update :
- Remember what i always insist on :
" Resistances often tend to become supports, and supports often turn into resistances "
- You don’t need ten indicators to find the way, keep your chart simple. Indicators are just supplements, helping confirm when you already have a good chance of being right.
- The target for ETH remains unchanged, it could reach around 15,000 or even higher accordling to Fibonnacci.
Be Ready for Uptober
Happy Tr4Ding !

Stop Blaming Market Manipulation: It’s Your Wrong InterpretationThe Excuse Factory
Recently, Bitcoin dropped from 118k to 108k. Suddenly, TikTokers, YouTubers, and X posters spiraled into paranoia, copy-pasting the same narrative: the “big masterminds,” reptilians, or aliens manipulated the market to liquidate 1.7 billion in buy orders.
Let’s pause for a second. A 10% pullback in Bitcoin is now considered a “market crash”?
If we look deeper... Ethereum fell about 20% from its top — but this same ETH had already grown 300% since April.
Was that also “manipulation”? Or does manipulation only happen when you are losing money?
How do you think markets work in general? Do they move only upward, just to make you richer?
The truth is simpler: there is no manipulation conspiracy here. There are no “false signals.” What exists are wrong interpretations.
The Market Is Neutral
The market doesn’t care about your position. It doesn’t send “false” signals; it simply moves. Price action reflects the sum of supply and demand in each moment.
When traders label a signal as “false,” what they really mean is:
• They misread the context.
• They didn’t account for a higher timeframe.
• Their stop placement wasn’t aligned with market structure or was too close.
The market doesn’t lie. It only reveals how much or how little you understand it.
Examples of Misinterpretation
• The “false breakout” myth – What you see as a false breakout on the 1H chart may be a perfect retest on the daily timeframe. The market wasn’t wrong—you were looking at it from the wrong lens.
• Stop hunting paranoia – Many traders cry “manipulation” when price takes out a cluster of stops. But think: stops are liquidity, and liquidity is where big players need to fill orders. That’s not manipulation—it’s how markets function.
• News volatility – Many traders call sudden spikes around economic releases “market tricks.” In reality, it’s about liquidity gaps. There aren’t buy and sell orders evenly distributed at every price level. When major news hits, price “rearranges” itself to include the new information and moves sharply until it finds liquidity — usually around strong support or resistance zones.
The Psychology Behind Blame
Blaming manipulation is easier than admitting error. It protects the ego. If the loss was due to some shadowy force, you don’t have to change. But this mindset locks traders into a cycle of frustration. Progress begins when you stop blaming the market and start analyzing your own decision-making.
Case Study: Ethereum’s Current Setup
As the saying goes, a picture says more than a thousand words.
Since April, Ethereum has rallied over 300% in just six months. On this path upward, the chart shows two apparent “false breaks” of support.
The question now is: will the current move be the third “false break,” or the first real break? As I wrote in yesterday’s analysis, confirmation is key...
But even if ETH drops further, say to 3600, nothing truly changes in the broader picture. Such a move would only be a healthy correction of the trend that started in April — perfectly aligning the price with the 38% Fibonacci retracement and the rising trendline support.
Conclusion: The Trader’s Responsibility
There are no false signals. There is no hidden enemy in the market. There is only your interpretation.
ETHUSD - Monthly MACD This is the MACD for Ethereum on the Monthly timeframe.
The recent cross in 2025 is suggestive of a greater bull run coming.
The ETHBTC pair also suggests something for ETH is coming soon this alt season.

ETH to $6000 by end of October or early November Don't listen to me, but according to my advanced charting techniques (just kidding), it's going to $6000 after touching an RSI of 30. Pattern:
- Touch RSI of 30
- Make a big move.
- Coil
- Retest 100 EMA
- RSI hits 30
- Make a big move!
Prediction: it goes to $6000 by the end of October or early November.
Let me know what you guys think. Let's get some confirmation bias going and fill our veins with hopium!!!
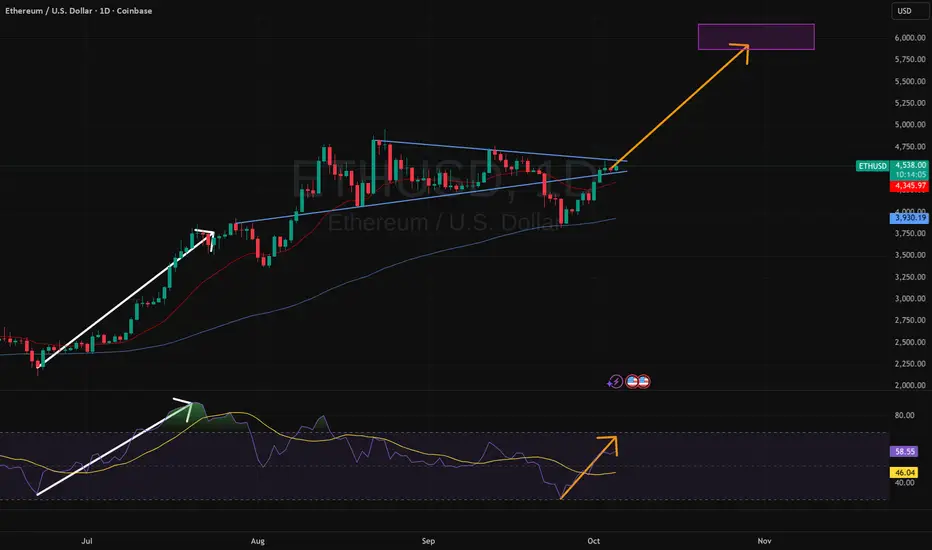
If we stick to the price tunnel started in April...My drawings show what I see as a likely continuation by examining the chart and finding patterns and trendlines.
