ETHUSDT Breaks Downtrend, Bullish Structure HoldsEthereum has broken above the recent red downtrend line, reclaiming momentum after a brief consolidation. The broader structure remains bullish as long as price respects key daily and weekly supports. This setup offers swing opportunities with clear risk levels.
🔍 Technical Analysis
Current price: $4,433
Break above the descending red trendline confirms bullish momentum.
Supports below align with major daily and weekly demand zones.
🛡️ Support Zones & Stop-Loss (White Lines):
🟢 $3,730 – Daily Support
Key short-term defense.
Stop-loss: Below $3,536
🟡 $2,680 – Weekly Support
Stronger swing entry zone.
Stop-loss: Below $2,481
🟠 $1,848 – Daily Support (Long-Term Buy Zone)
Macro level for deeper entries.
Stop-loss: Below $1,745
🧭 Outlook
Bullish Case: Break of red downtrend + hold above $3,730 → continuation higher toward $4,600–$4,800.
Bearish Case: Break below $3,730 → correction into $2,680. Losing $2,680 exposes $1,848.
Bias: Bullish while above $3,730.
🌍 Fundamental Insight
Ethereum continues to benefit from network upgrades, growing ETH staking, and institutional adoption. Macro drivers like potential U.S. rate cuts and weaker USD also support crypto upside. Risks include regulatory pressure and shifts in liquidity.
✅ Conclusion
ETHUSDT has broken its recent downtrend and is holding bullish structure above $4,400. Support zones at $3,730, $2,680, and $1,848 provide clear swing levels for traders.
⚠️ Disclaimer
This analysis is for educational purposes only and does not constitute financial, investment, or trading advice.
ETHUSDT.3L trade ideas

Eth bullish trade planEthUSDT is bullish in the hourly timeframe, already overbought, expecting it for retracement.
I am sharing my trade plan.
Please comment, do you think it will work?

Ethereum Trade Setup - Sep 12th📲 NFX Trade Alert – Swing Setup
💹 Instrument: BINANCE:ETHUSD Ethereum (ETHUSD.r)
🛒 Trade Type: Swing – Buy at Market
📍 Entry: $4,540
⛔ Stop Loss: $4,450
✅ Target Profit: $4,950
📊 Trade Setup Analysis – Ethereum
Ethereum has finally broken through the $4,500 block order, which is now acting as solid support after multiple rejections on both the H1 and H4 timeframes.
With this breakout confirmed, price has no significant resistance until $4,650 (minor) and $4,850 (major). This opens the path for higher prices in the near term.
⚖️ As always, manage risk carefully — even a high-probability setup requires discipline and protection.💚


Short-term analysisEthereum managed to break through a very significant resistance level, and if confirmed without being a fake breakout, the price could easily reach the **4,666.66** area.
However, for entering a position, you should wait for strong confirmation, as there is a high chance that the breakout could turn out to be fake.

ETHUSDT – Breakout from Contraction Zone Setup:
Ethereum (ETH) has been consolidating in a tight range for several weeks, holding above its 50-day and 200-day moving averages. Price has now pushed above short-term moving averages and cleared the local resistance zone, signaling renewed momentum.
Entry:
🔹 Buy near $4,420–4,450 on confirmation of breakout.
Stop:
🔻 Place stop just below supertrend and recent swing low at $4,050 (tight risk management).
Targets:
🎯 $4,700 (first target, prior swing high)
🎯 $5,000+ (measured move if momentum expands)
Why I Like This Trade:
✅ Strong base & contraction → volatility squeeze setup
✅ Clear risk level (tight stop) for high R/R
✅ Market sentiment improving, crypto strength building
⚠️ Risk Note: Watch for sharp volatility around macro data releases — consider reducing size or scaling in gradually.
DISCLAIMER : The content and materials featured are for your information and education only and are not attended to address your particular personal requirements. The information does not constitute financial advice or recommendation and should not be considered as such. Risk Management is Your Shield! Always prioritise risk management. It’s your best defence against losses.

Continuation of Ethereum’s rangeUnlike many currency pairs and Bitcoin, Ethereum showed no reaction to today’s news and is still moving within the same previous range. In such cases, this itself is a signal — meaning that whichever side the price manages to break the range from, the move will likely be strong, since the price has already made up its mind. At the moment, if you are insisting on opening a position on this coin, you can trade based on the range pattern. ✅

ETH: Moving ForwardOn September 8, I entered a long on the 1-hour chart from $4322 with 15x leverage. Price moved up to $4382, hitting the first target. The $60 difference per coin delivered a solid result even with partial profit-taking. The rest was left to the market — missed profit is always there, but it’s not critical when the process is systematic.
The decision was based on the indicator’s readings: levels were outlined in advance, control points marked. This removed unnecessary guessing and kept the trade calm. Instead of chasing price emotionally, the move unfolded step by step like a planned route.
With a clear structure, holding a position becomes easier. Even with leverage, risk stays manageable, and decisions are made without rush. The market picture turns transparent: when to take profit, when to wait, when to keep a cool head.
The trade isn’t fully closed yet — I continue to observe. The market always brings new moves, and discipline is what allows you to face them prepared.

ETH 4H Analysis - Key Triggers Ahead | Day 19😃 Hey , how's it going ? Come over here — Satoshi got something for you!
⏰ We’re analyzing ETH on the 4-Hour timeframe.
🔭 ETH 4H Chart: Observing Ethereum on the 4-hour timeframe, after breaking the midline of the box, ETH closed above the box. Then, following the news, it formed a shadow that hit the lower box level, triggering a series of buy orders. Now, we’re watching to see if ETH will continue upward. The overall trend behind ETH is still bullish, and a breakout above the multi-timeframe range could push it toward the box’s top again.
⛏ Key RSI Levels: ETH’s RSI is around 70 and 50. A breach of these levels could signal the start of a move, especially following today’s inflation news impact.
💰 Candle Size & Volume: Green candle sizes and volume have increased. Yesterday, $164M of ETH was bought via ETFs, which is notable.
🪙 ETHBTC 4H Chart: Observing the ETH/BTC pair on the 4-hour timeframe, this pair tends to act slightly more precisely compared to ETH/USDT. Currently, it’s trading within a box with declining volume. News caused a reaction at the top of the box. If the box’s top breaks, a significant amount of BTC could convert into ETH, potentially pumping the ETH/USDT pair as well.
🔔 Entry & Target Zones: A potential early entry is around $4443, with the box top at $4500 — a strong resistance. If ETH breaks this level, it could aim for a new ATH. Make sure to confirm across multiple timeframes before taking a position.
❤️ Disclaimer : This analysis is purely based on my personal opinion and I only trade if the stated triggers are activated .

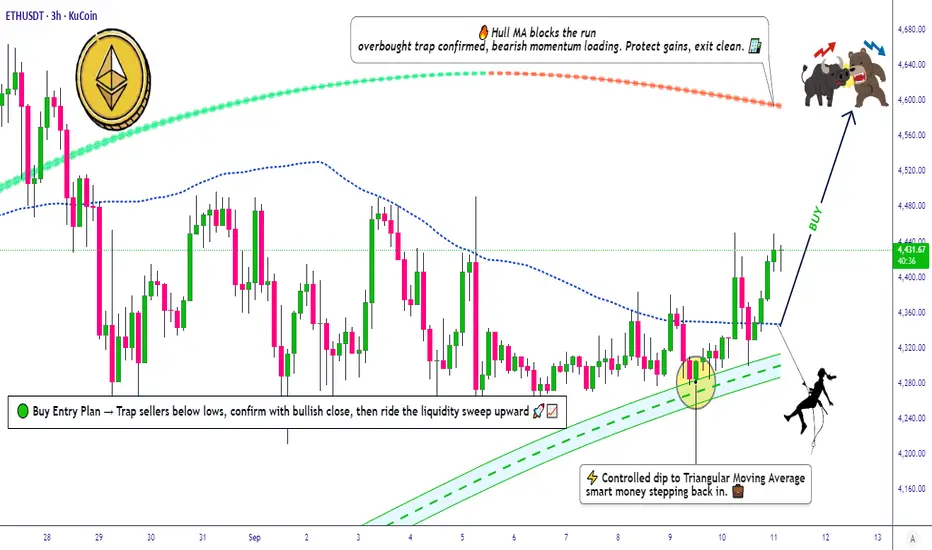
Ethereum (ETH): Momentum Kicking Inn | Very BullishETH is building momentum right above the EMAs, which continue to act as a zone of pressure. Similar setups in the past gave us strong bounces, and now we’re seeing early signs of the same.
If buyers keep the pressure here, a breakout and continuation higher looks very likely. Target levels remain unchanged — next stop is around $4,800 with a major target at $5,555.
Swallow Academy

ETH/USDT Technical Roadmap | Bullish Swing & Day Trade Levels📌 ETH/USDT "Ethereum vs Tether" Crypto Market Plan (Swing/Day Trade)
🔹 Plan: Bullish (Pending Order Breakout Plan)
We are preparing for a breakout setup around 10.000⚡ TRIANGULAR MOVING AVERAGE BUY PLAN.
Price action shows strong buyer strength with signs of institutional accumulation on dips.
🛠️ Thief Strategy (Layered Entry Style)
This strategy uses multiple limit orders (layering method) after breakout confirmation.
✅ Example buy limit layers (can be adjusted to your own risk):
4350
4370
4390
4420
👉 Please set a TradingView alert near the breakout level so you don’t miss confirmation.
🛑 Stop Loss (Risk Management)
📍 Suggested risk level: 4300 (after breakout confirmation)
This is the Thief SL reference point, but remember:
Adjust your SL based on your personal risk tolerance & strategy.
🎯 Target (Profit Zone)
Price may face resistance near moving averages with possible overbought traps.
📍 Planned exit zone: 4600
Manage your own TP — use targets that fit your risk/reward ratio.
🔗 Related Pairs to Watch
BINANCE:BTCUSDT – Bitcoin breakout strength often leads ETH moves.
BINANCE:ETHBTC – Key ratio showing ETH’s relative strength vs BTC.
BINANCE:SOLUSDT – High-beta crypto that often correlates with ETH sentiment.
BINANCE:BNBUSDT – Another major altcoin for cross-market momentum comparison.
✨ “If you find value in my analysis, a 👍 and 🚀 boost is much appreciated — it helps me share more setups with the community!”
#ETH #ETHUSDT #Ethereum #Crypto #SwingTrade #DayTrade #BreakoutStrategy #LayeredEntries #CryptoTrading #TradingPlan
ETHUSDT in Strong Uptrend: What's Next?Hey everyone, what do you think about ETHUSDT?
ETHUSDT is currently moving in a strong upward channel, hovering around 4427 USD, with a 1.85% increase on the day. This rally is driven by strong institutional inflows, favorable monetary policies, and the continuous development of the Ethereum ecosystem. Technical indicators such as the EMA 34 and EMA 89 continue to support the uptrend, especially as ETH breaks through short-term resistance levels.
With the current momentum, ETH could aim for a target of 5400 USD in the near future, if the buying pressure remains steady. If you're watching ETH, this is an ideal time to consider potential trading opportunities.
What do you think about ETHUSDT? Is this upward trend sustainable? Feel free to share your thoughts and join the discussion on ETH's potential moving forward!

#ETHUSDT 2H ChartPrice broke out of the consolidation and is currently moving up. MACD is bullish, RSI is bought and EMAs are turning bullish. Price is currently expected to liquidate the equal highs at $4,490 as a short-term target.

$ETH doesn’t look done pumping yetCRYPTOCAP:ETH doesn’t look done pumping yet. While it’s screaming for consolidation, past cycles suggest another leg up toward $5,200–$5,400 or even higher at $6,000 before hitting critical overbought levels.
The likely scenario, if history repeats, is a sharp correction back to the EMA 50. However, strong institutional inflows could front-run this, pushing CRYPTOCAP:ETH higher without ever revisiting $4,000.
MACD and RSI are extended, but price action remains resilient. CRYPTOCAP:ETH can stay overbought longer than expected before finally flipping bearish.
No bearish divergeance, just a nice pump.
Bottom line: CRYPTOCAP:ETH still looks bullish, with 20–50% upside from here likely. But momentum is heating up, so it may be wise to gradually secure profits before the inevitable pullback.
DYOR

ETH – pumpa or fakie?Very tight consolidation in our demand box. We're finally doing another attempt at breaking up and taking all the highs at 4500.
I would look for a rejection there, then either a retest of the current price, or a sweep of all the lows at 4270.
If we fail to even get to 4500, I think it's more likely that we take the lows of our demand box.
In that case we need a fast reclaim of the ema and demand cluster, or we open up the gates to a lot lower (3500-3700).
No certainty on this chart for me, although it is looking very likely that some resolution will come sooner rather than later.

ETH - Don’t be fooled - Bearish Retest ETH (like Bitcoin) has risen only to retest a bearish breakdown on the HTF.
This whole upwards movement is one big set up - to trap liquidity in longs and absorb it all from the chart.
My initial call is marked here with original entry.
Second entry can be 4,420 region.
Short to my targets marked on chart.
Don’t be a sucker and get trapped by this.
Happy trading

ETH 4H Analysis - Key Triggers Ahead | Day 18😃 Hey , how's it going ? Come over here — Satoshi got something for you!
⏰ We’re analyzing BTC on the 1-Hour timeframe.
🔭 On the 4-hour timeframe of Ethereum we can see that ETH is clearly in a very strong consolidation, and for several days even the oscillator has been ranging around the 50 zone. This time-based range will eventually come to an end. Ethereum now has two important levels ahead with the upcoming news: the top of the box midline at $4373, where breaking this zone could trigger a strong pump, and the bottom zone, which is a maker-buyer area at $4252, considered a very strong and important support for Ethereum.
⛏ The key RSI levels for Ethereum are at 57 and 40. If the range of oscillation crosses these levels, ETH could gain more volatility and even move toward its overbought or oversold regions. Usually, this type of short-term consolidation ends with a good price move once the compression is broken.
💰 The size, volume, and number of green candles have really decreased, and multiple candles inside the range have formed, creating a decision-making phase for ETH. With today’s PPI news, it is likely that one of these zones will either be touched or broken, and after this news, candles are expected to come with stronger volume.
🪙 On the 4-hour timeframe of the ETHBTC trading pair we can see that it is in a descending continuation channel. Each time the price has reached the top or bottom of this channel, it has reacted with a reversal and then moved in the opposite direction. Currently, ETHBTC is above its midline and has shown a positive reaction to it. The volatility of this pair has significantly decreased in recent days and is now ranging under its 50 zone. A breakout above the channel top and the 0.03893 level could start a bullish move.
💡 The zones we are considering for Ethereum’s top and bottom are $4493 and $4252. Breaking either of these levels after this multi-day consolidation could start a strong trend and even a sharp directional move! Keep in mind that war and economic news have created interconnections for risky markets—trade with low risk.
❤️ Disclaimer : This analysis is purely based on my personal opinion and I only trade if the stated triggers are activated .

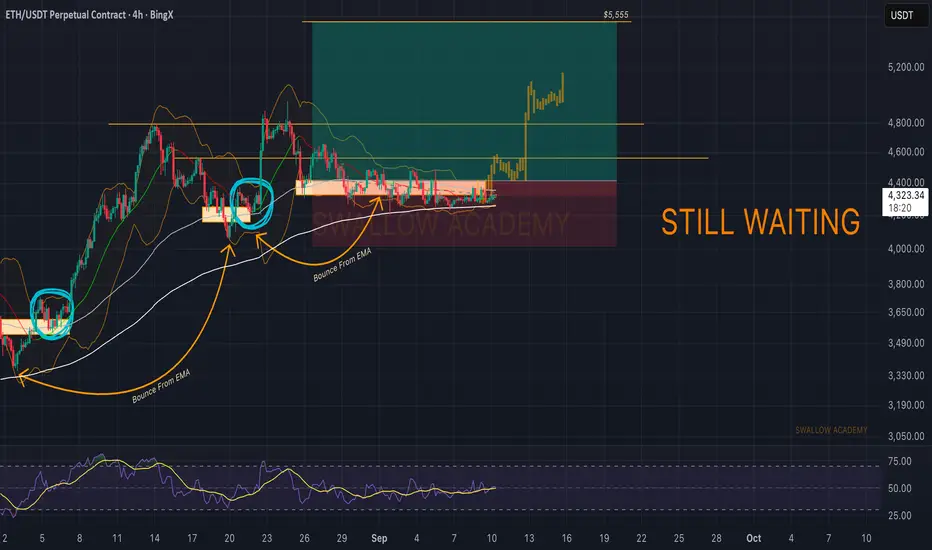
Ethereum (ETH): Still near EMAs | Expecting An Explosive MoveETH is still sitting around the EMAs on the 4H timeframe, where pressure continues to build up. Buyers haven’t let the structure break down, but we’re still waiting for that clean confirmation to trigger the bullish move toward our target zone near $5,555.
Patience is key here — the setup remains valid, and the EMAs continue to act as the zone of pressure we highlighted earlier.
Swallow Academy
ETHUSDT – Sideways with Long-Term OpportunitiesCurrently, ETHUSDT is trading in a sideways range, fluctuating between key support and resistance levels. After facing resistance at 4,360 USD, the price has corrected and is now moving within the range of 4,170 USD – 4,360 USD. The market is lacking decisiveness and there are no strong signals to break these levels.
On the H4 chart, ETHUSDT remains below the downtrend line, indicating hesitation in breaking out. The price has not been able to surpass EMA34 and EMA89, reflecting uncertainty in the trend.
In this sideways market, the price could continue to fluctuate within the 4,170 USD support and 4,360 USD resistance. If a breakout occurs, ETHUSDT may target higher levels, especially if strong capital inflows continue.
Overall, the sideways trend still dominates. However, the market could change quickly if macroeconomic factors or shifts in monetary policy and major events come into play.

ETH/USDT COILING I often return to assets with fresh eyes and new time-factor . Here is my latest for: ETH/USDT idea.
ETH/USDT is COILING and ready for another leg to test ATH high again. It must first travel and claim the a new DISCOUNT ARRAY before its true moment can be filled.
DAILY FVG has been disrespected and now acting as the new DISCOUNT ARRAY for a potential move higher. A BREAKAWAY candle on the DAILY FVG just below is what will be our confirmation. Best of luck.
🚩 Invalidation: If the Daily FVG breaks with a clear breakaway candle, this setup is void.

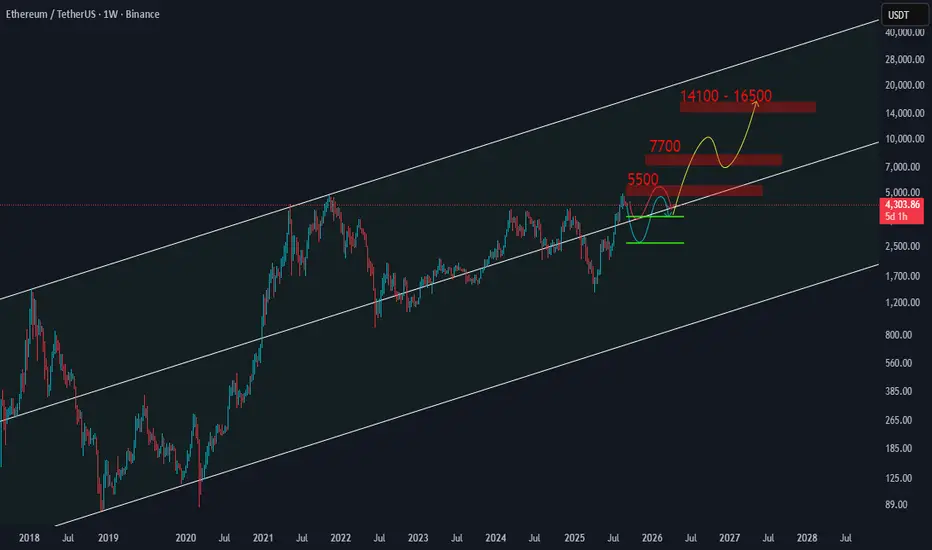
Ethereum Weekly Time Frame AnalysisEthereum is correcting to $3,600 or in the most pessimistic case to $2,500 and then will move towards the next targets of "5,500" and "7,700" and "14,100" to "16,500" respectively .
Ethereum short?The more and more ether hits support at $4,250 the more likely it is to break, keep a close eye on $4,250, as a daily close below this level will open up an opportunity to short ether before it drops 8% +

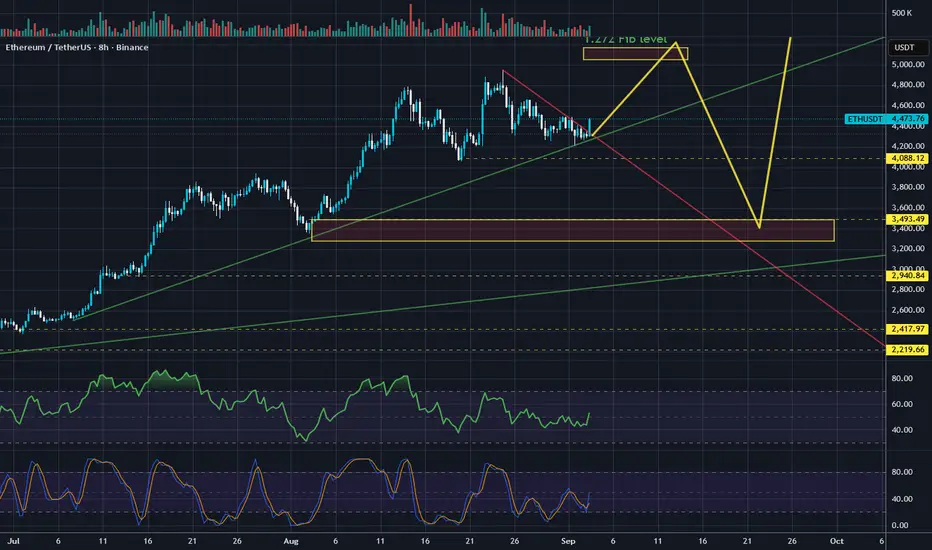
ETH one last push before rate cuts in September.Ethereum broke down-trend since last All time high while holding green trend line.
This gives one more opportunity to visit 1.272 fib level which is at 5100-5250$
After this move is done expect agressive correction to ~3440$. ETH will surge up to the new ATH at the end of this cycle after correction is over probably somewhere in october.