$ETH WHITE -SWAN BULLISH CONTINUATIONA bullish white-swan on #ETHUSDT showing trend continuation to the upside.
Strong support around $2300-$2400zone
ETHUSDT.3L trade ideas

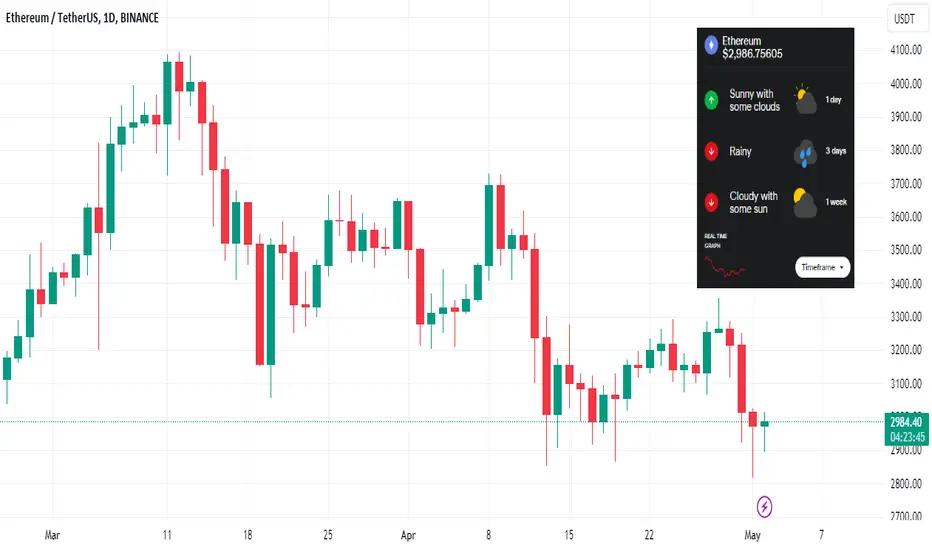
ETH Slightly Bullish 24-Hours ☀, Bearish ☁️ & Downside Next WeekIn the US, there were outflows from the spot Bitcoin exchange traded funds (ETFs) for the sixth consecutive day. “We have seen six consecutive days of outflows, and as the average entry price ($57,300) approaches the current spot price ($59,800), we will likely see more ETF unwinding. Since March 18, the ETFs have seen outflows on 58% of all trading days,” 10x Research said in its daily note.
“This will likely lower prices to our target levels and cause a -25% to -29% correction from the $73,000 top - hence our price target of $52,000/$55,000 during the last three weeks,” the crypto research company forecasts.
In Hong Kong, the first trading day of the spot Bitcoin and ETH ETFs approved proved to be a cold shower with only $12 million flowing into these new ETFs. Analysts had expected up to $300 million. The price of Ether fell 2.5 percent to $2,918 over the past 24 hours.
A slightly bullish sun shines over Ethereum and ATTMO signals a potential upside over the next 24 hours. Over a one-week horizon, bearish clouds are likely to sweep over most of the cryptoverse putting pressure on Ethereum, indicating a potential price drop.
Follow us for more crypto news and weather reports!
ETHEREUM / ETHUSDTGood Luck >>
• Warning •
Any deal I share does not mean that I am forcing you to enter into it, you enter in with your full risk, because I'll not gain any profits with you in the end.
The risk management of the position must comply with the stop loss.
(I am not sharing financial or investment advice, you should do your own research for your money.)

ETH - locally looks bullish. Key level - 3023.24.I expect to see a rise to 3023.24 in the near future. This is the start of a fresh daily fair value gap.

ETH target 4700 (perp)4h time frame
-
TP: $4616~$4890
SL: $2575
-
ETH is creating a potential wedge structure, that hasn't been confirmed yet. A standard structure is made of 6 six touching points at least, it's not completed due to lack of one more point on the wedge top. Also, there are two paths if we consider it as a continuation patter, first is the green one, that leave $2817 as the last low and keep going up, second is the red path, which make another low to build a robust bottom before pumping.
No matter what scenarios, they can reclaim $4800 in future if sustain continuation of the bull trend since $2171.

📉🔍 ETH Trading Analysis 🔍📈Market Observation:
Yesterday's significant dip brought many altcoins, including ETH, into their support zones.
Trade Setup:
Entry: Long spot position between $2,850 - $3,050.
Take Profit: $3,400 - $3,700 or $4,100 - $4,350.
Stop Loss: Just below $2,800.
Risk Management:
Implement a stop loss just below $2,800 to mitigate potential losses.
📈💡 Trade Strategy Rationale:
Anticipate a bullish move in ETH from the support zone, targeting potential profit levels as indicated.
📊🔄 Stay updated on market conditions for trade adjustments! #ETHTrading #CryptoAnalysis 🌐🚀

Eth short time long trade setup with SL As per price action, the volume of eth will get one more dip to complete (C) of the (Y) wave.
follow me if u like and want to get more TA.
ASKE ME ANY THING IN COMMENT

Ethereum can correct to support level and then continue riseHello traders, I want share with you my opinion about Ethereum. By observing the chart, we can see that the price rebounded from the resistance level, which coincided with the seller zone and declined to the mirror line, where it at once turned around and in a short time rose higher to the 3530 level with the seller zone, thereby breaking them. But soon, ETH declined lower this level this mirror line, breaking them again and fell a little lower, after which in a short time rose to 3270 points. Then price turned around and made a strong impulse down to the support level, which coincided with the buyer zone, thereby breaking the mirror line with the 3530 resistance level one more time. As well then, the price started to trades inside the range, where ETH rebounded from the support level and tried to rise, but at once made a correction. Then price in a short time rose to the top part of the range, after which rebounded down to the buyer zone, which recently turned around and started to rise. So, at the moment, I think Ethereum can make small correction to support the level and then continue to rise. For this case, I set my target at the 3200 level inside range. Please share this idea with your friends and click Boost 🚀

ETHUSDT SHORTAs I said before here is my idea for ethusdt in the next 30-60 days
After it reached 4000+ it started to created a 5 waves down we are now in wave number 5 after 4 perfect completed waves with perfect retracements
So in my point of wiev 2700-2650 is a price that we might see before we start to go up again
The wave 5 that you see complete the 5 waves analysis
Enjoy !

ETH - Massive Bullish Impulse Soon ❗️Hello TradingView Family / Fellow Traders. This is Richard, also known as theSignalyst.
📈 ETH has been overall bullish, trading above the red trendline which is acting as a non-horizontal support.
Currently, ETH is in a correction phase trading within the falling orange channel.
Moreover, it is retesting a strong demand in green at $2900 - $3000.
🏹 Thus, the highlighted red circle is a strong area to look for buy setups as it is the intersection of the green demand and lower orange/red trendlines.
📚 As per my trading style:
As #ETH approaches the red circle zone, I will be looking for bullish reversal setups (like a double bottom pattern, trendline break , and so on...)
📚 Always follow your trading plan regarding entry, risk management, and trade management.
Good luck!
All Strategies Are Good; If Managed Properly!
~Rich

ETHUSDTETHUSDT is trading in falling wedge pattern. The price was reacting well the support and resistance of wedge.
Currently the price has given the massive breakout from falling wedge and after successful retest of the level will be bullish signal and seems like the price may go for another leg higher.
If the breakout sustain to upside the optimum target could be 3700
What you guys think of this idea?

A case for Ethereum BounceLots of support right here.
A bounce will make a lot of sense
Along with setting a monthly higher low
Just have your stops in because on the flipside if bears manage to break it it will become a resistance

ETHUSDT Bearish FlagETHUSDT has formed the bearish flag pattern in the absence of divergence which indicates continuation of bearish trend.

Ethusdt Bullrun from my line's ***in sha Allah***Ethusdt Bullrun from my line's ***in sha Allah***
thnx me later must follow my lines
lets c........
hahahahaha
t0p 6k

#ETH did a flush before a retest because of CZ news.#ETH did a flush before a retest because of CZ news.
#ETH is now forming a bullish Shark Pattern in 4-Hour TF!
Don't worry guys a bounce is coming. We will soon see #ETH at $3500. There is a 4H FVG that will be filled soon.

Ethereum's Bull FlagEthereum has recently formed a bull flag, indicating significant potential for upcoming market movements.
On Ethereum's upward trajectory, the first notable barrier is resistance A, and successfully overcoming it could pave the way to reaching the channel's ceiling.
If Ethereum can respond positively to these resistances, we can expect a substantial increase in prices.

in low timeframe eth has grow potentialafter we see breakup eth last high in low tf we can buy that on 0.618 fibo
update soon...

ethusdAfter the completion of the monthly pattern, it entered correction. I expect the fall to continue in the range of $2815-2541.

ETH Ethereum Selloff Price TargetIf you haven`t sold the top on ETH Ethereum:
After analyzing the chart patterns, I would define the revised buy zone as ranging from $2170 to $2370, as illustrated in the chart.

Ethereum Scalping Zones 5/1Upside Targets:
* 2987/3015/3052
Downside Targets:
*2898/2863/2795
Daily Trend Tracker -
*Bitcoin- DXY+ VIX+ US10Y+

ETH WEEKLY CLOUD SUPPORTOut of sheer boredom, I clicked on my old favorite indicator, the Ichimoku Cloud. Without going into too much detail on how it works. I can say that those who use this strategy should be salivating at ETH at the moment.
The flat cloud top (kumo) is considered strong support - this is the third test. The brown line, or Kijun, is also viewed as a support level for an entry.
Interesting...

✴️ Ethereum 10X SHORT (400% Potential)Here the leverage can now be increased. It doesn't matter if you entered before or after the peak, if you are doing it short or long-term; this is easy profits.
Ethereum seems to be headed lower based on chart signals and lots of data we looked at in previous weeks.
The correction might end up being boring... I think nobody is going to like seeing the market red, so we will have to detach, go away and comeback when we are ready for the next bullish wave.
The interesting part though will be to find out if the correction low will come in after three months or two weeks... We can only wait and see.
This chart is showing bearish potential.
Namaste.

ETHUSDT UPDATE#ETHUSDT
Dear Valued Traders, we hope this communication finds you well. Today, we are convening a discussion focused on ETHUSDT
ETH is struggling on the major support in the HTF, where we can a short retest before going downward.
Soon, We will see a bullish wave , that can gives us up to minimum of 10% move before going down.
