Ethereum (ETH): Still Hovering Near EMAs, Looking For BounceETH is still hovering around the 200EMA, a zone that has historically acted as a strong bounce level. If you look back, every major recovery started with similar setups, where price dipped into the EMAs and buyers stepped in with momentum.
Right now, we are waiting for that same confirmation. If buyers hold the 200EMA and push higher, we are set for a move towards $5,555, keeping the same bullish plan in play. Nothing major has changed — just patience until the bounce plays out.
Swallow Academy
ETHUSDT.3L trade ideas

This is where we heading bitch.I believe that we are heading to valhalla and this is your last chance to buy this shit. I aint gonna say this is the golden hour but time is not on our hands. Believe on ETH. ETH is going to be BTC's bitch and we are going to be happy about that! fuk yall.
PS
I will delete this idea if I am wrong so I would have 100 percent success rate going forward

ETH - Can it break 4300?The probable moves as shown here is something to be taken care off, just breaks red, makes the pattern no longer work

ETHUSDT. Where to Go Long and Where to Take ProfitsHi traders and investors!
This analysis is based on the Initiative Analysis concept (IA).
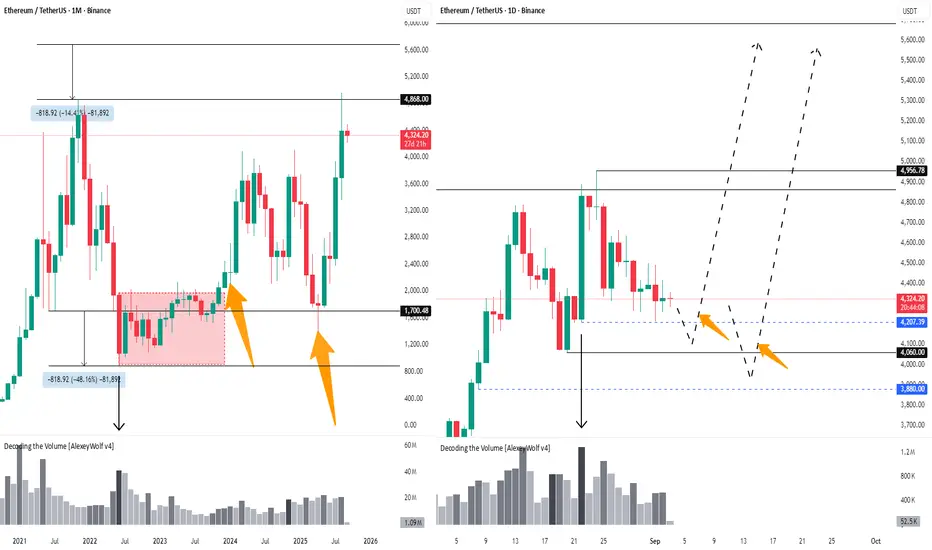
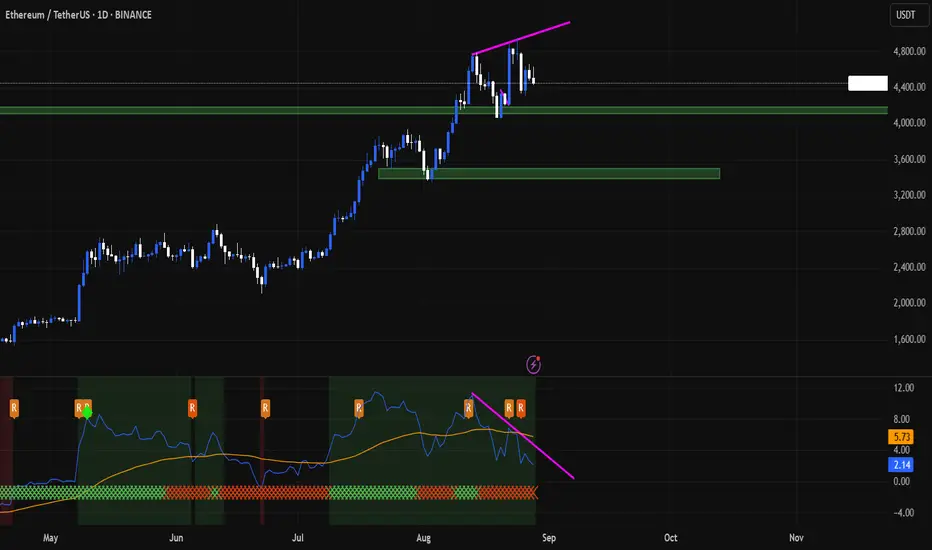
August has ended, and it’s time to look at the monthly charts. Let’s focus on Ethereum. The price is trading within the 1,700–4,868 range. The August candle touched the upper boundary of this range and we saw a pullback.
If we go back a bit to June 2022, we can see a strong seller candle that broke through the lower boundary of the range on high volume. After that came accumulation, and then the buyer absorbed the seller’s candle. That was the moment when investors could look for long entries with the goal of reaching the upper boundary of the range. The second good entry opportunity for investors came in April–May of this year, when the price retested 1,700.
So, where should we be looking for trades now? Let’s first identify where the price could go. To do this, we measure the price deviation downward from the 1,700 level and project it onto the upper boundary of the price range. I estimate the price could reach around 5,681.
Now it’s important to understand where we can find an entry. For this, let’s look at the daily chart.
On the daily timeframe, the price is also trading within the 4,060–4,956 range. There’s a strong buyer candle with high volume, but so far the buyer hasn’t been able to resume the move from it. That’s why I expect the price might dip below 4,207 and then head toward a new ATH. That’s the first scenario.
The second scenario is a dip below 4,060 into the 3,880–4,060 range, followed by a move to a new ATH. The target of about 5,700 was already defined on the monthly chart.
So, where should you enter? The entry comes after the price, in either of these scenarios, moves back above the broken level.
Wishing you profitable trades!
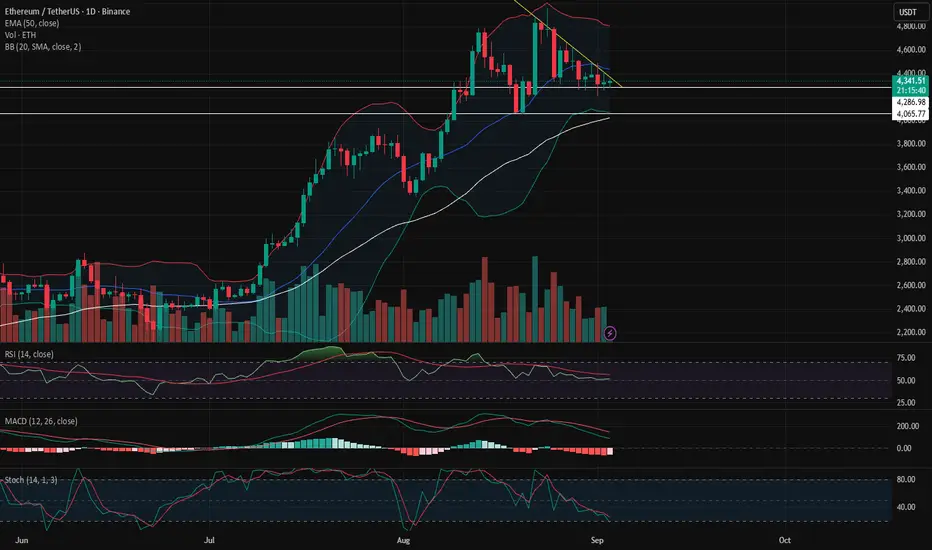
ETH at a Make-or-Break Level — Will $4,286 Hold or Fold?ETH Daily – Descending Triangle at Key Support
ETH is currently testing major support at $4,322, forming a bearish descending triangle. Price is compressing, and volume has decreased over the last week — typical of consolidation before a breakout.
RSI is around 50, sitting below its moving average and flattening, showing neutral to slightly bearish momentum.
MACD is below the signal line but still above zero. Histogram is red and trending lower, indicating weakening bullish momentum.
Stochastic RSI is near oversold territory, which could suggest a short-term bounce — but no confirmation yet.
Volume continues to decline, suggesting a bigger move is coming.
If $4,322 breaks, next support is around $4,286, with a potential drop toward $4,065 if momentum accelerates.
If support holds, expect possible sideways action or accumulation. Watch for fake-outs — especially if price attempts to reclaim the upper triangle trendline without volume support.
Bias: Neutral to Bearish — waiting for confirmation.
ETHEREUM WILL MAKE NEW ALL TIME HIGHS AND THEN !!! DOOMSDAY !!ETH looks primed for new ATH now that late longs have been wiped off. There is considerable fear in the market but not fear enough ! ETH is about to explode with rest of the ALTS ! make you money while you can and then run for the hills my dudes. This will be epic !
Disclaimer: Not financial advice.

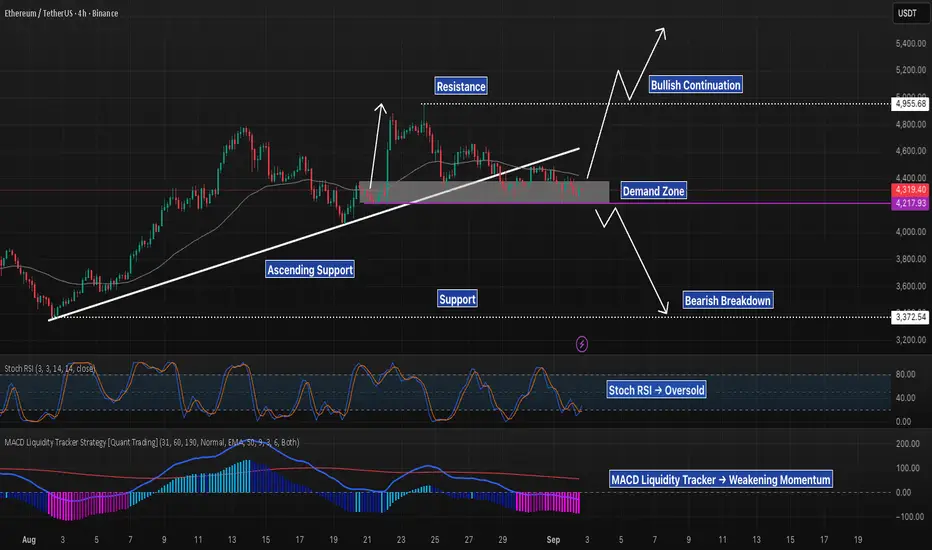
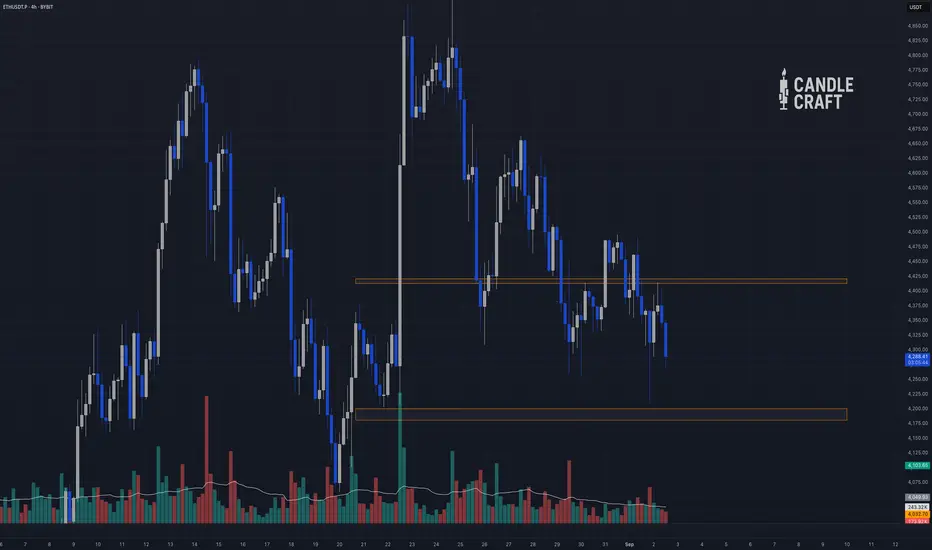
ETH 4H Demand Zone Retest, Defend $4.2K or Break Down To $3.3K?Ethereum is sitting at the key $4.2K demand zone, where price meets the ascending support trendline and prior liquidity levels. This area will decide whether ETH continues higher or breaks lower into a broader correction.
If buyers defend $4.2K, the next upside target is $4.95K resistance, which aligns with the dotted range high. A successful retest here would confirm continuation of the broader uptrend.
On the flip side, losing $4.2K and sweeping liquidity could trigger a breakdown toward $3.37K, the next major support zone.
Indicators show a mixed picture: Stoch RSI is near oversold, suggesting a bounce could form, while the MACD Liquidity Tracker is pointing to weakening momentum.
Key levels:
– Demand Zone: $4.2K
– Resistance: $4.95K
– Support: $3.37K
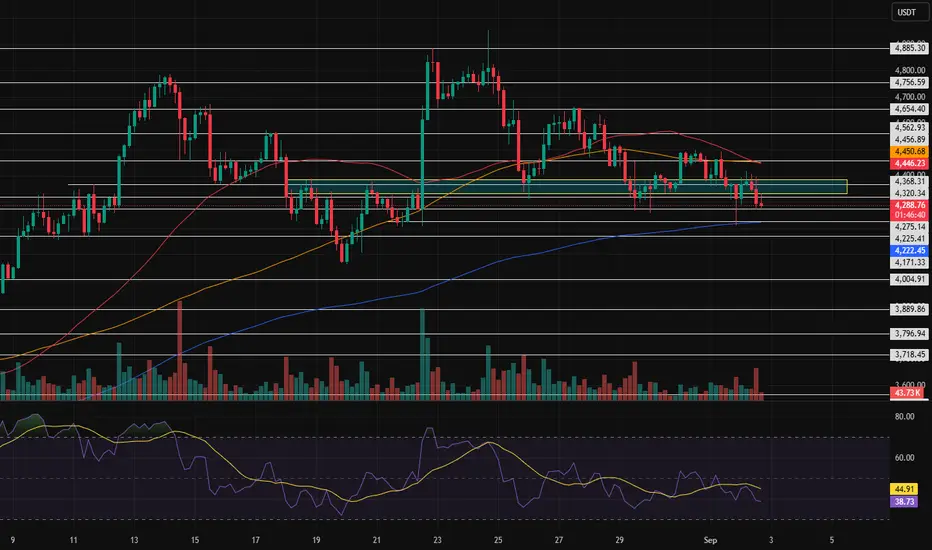
ETHUSDT: 4200-4280 Reversal ZoneIdea:
Looking at the daily chart for ETHUSDT, the zone between 4280 and 4200 has repeatedly acted as strong support. This area continues to hold, showing resilience as sellers struggle to push price meaningfully lower.
If a trend reversal is in play, this is exactly where I would look to get involved on the long side.
Curve Model Explanation:
Price often follows a cycle: it moves from the top of the curve (overbought, higher risk to long) down to the bottom of the curve (oversold, lower risk to long). Currently, ETHUSDT is positioned at the bottom of this curve, making it a favorable risk area to consider a long trade.
Risk/Reward View:
Entering here means low risk to the upside, as buyers have been consistently absorbing downward moves. The reward is attractive if sellers continue to lose steam and momentum shifts upward.
Candlestick Evidence:
Recent candles show decreasing selling pressure—smaller real bodies and longer downward wicks reflect seller exhaustion and a battle to hold lower prices. While ETHUSDT is still challenging the trendline above, the push lower is weakening.
Summary:
I am watching the 4280-4200 support zone as a prime area for a potential trend reversal. It aligns with the bottom of the curve—classic low-risk, high-reward territory. The candlestick structure supports my thesis: sellers are fading, and an upside break could provide a strong opportunity for bulls.
Would love to hear your thoughts on this setup! Do you see the same reversal potential in the 4280-4200 zone? Are there other signals or confluences you’re watching here? Share your perspective and let’s discuss possible trade ideas or alternative scenarios.

ETHUSDTI think moved trend by break 4485$ resistance and 4250$ support in BINANCE:ETHUSDT .
Support: 4250 - 3900 - 3510
Resistance: 4485 - 4720 - 5000
Please control risk management.

Waiting for support confirmationIf Ethereum manages to give a strong confirmation of breaking the key support level it’s currently testing, it’s not unlikely that the price could drop much further. However, for a real bearish move, there are still many major supports ahead, and it would require a significant amount of selling pressure to break through them. Overall though, the bullish path seems much easier for Ethereum than a deep decline.
ETHUSDT TRADE 09.02.2025We can see a bullish wedge on 4 hour timeframe, in addition ETH price formed three low lows while RSI index is growing which a clear sign of a bullish divergence. Additionally, ETH bounced up from a strong support level EMA-200 on 4 hour timeframe, it indicates that bulls managed to defend this level. Therefore we can expect the growth on the chart. I applied Fibonacci Retracement from the highest to lowest price and key levels for take profits will be on 0,5 level of fibonacci, then 0,61, and the last one is 0,786. I will try to hold a trade till 0,61 level, but depending on trading approach you can close it earlier, at least on 0,5 level of fibonacci. Good luck with your trades, pals!

Ethereum vs Solana: Which One Will Explode First?!In this episode, we’ll compare Ethereum (ETH) and Solana (SOL) head-to-head:
👉 Trend strength
👉 Volatility & cycles
👉 Candles & momentum
👉 Dominance vs Bitcoin
Both ETH & SOL are in an uptrend on the daily chart — but which one is better for trading and long-term investment? In this analysis, I’ll break it all down using the simplest technical tools so everyone can follow.
We’ll check:
Daily & 4H momentum comparison
Sharpe ratio for investment reliability
Which altcoin has stronger liquidity inflows
Key resistance & long triggers for ETH and SOL
❌ Don’t FOMO.
Stick to risk management.
Trade your trigger, not your emotions.

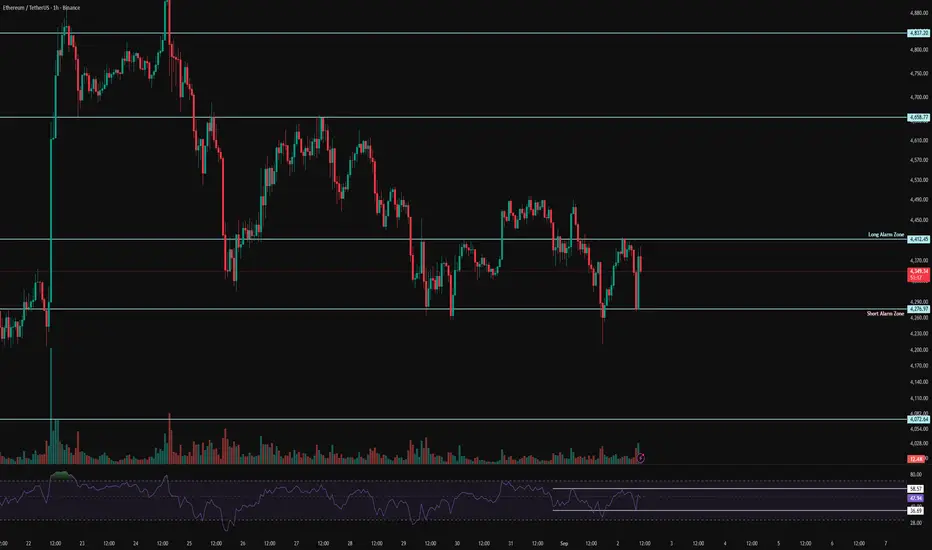
ETH 1H Analysis - Key Triggers Ahead | Day 10💀 Hey , how's it going ? Come over here — Satoshi got something for you !
⏰ We’re analyzing ETH on the 1-hour timeframe timeframe .
🔭 On the 1-hour timeframe for Ethereum, we can see that in the last few candles ETH faced a drop with some selling pressure, reaching the support zone at $4276, and then bouncing back. Now we need to see whether Ethereum manages to break the $4400 resistance or not. If it does, this level could give us a strong long position opportunity.
⛏ Two key RSI zones are being watched: 58 and 37. Once the RSI swings beyond these levels, ETH could start a solid move.
💰 Volume and green candles could continue to increase, and even while I’m writing this, a strong whale green candle with very good volume just closed for Ethereum.
🪙 On the 1-hour timeframe of ETHBTC, if the drawn support zone is lost, ETH might struggle to move upward, since Bitcoin dominance is closing green candles and this adds selling pressure on Ethereum. However, a long alarm zone has been set — and if ETH breaks above this zone, it could pump massively.
🔔 Two alarm zones are considered for Ethereum: $4400 and $4276. Personally, I’m not really thinking about short positions today, and if ETH gives a good setup, I’d rather look for a long entry.
❤️ Disclaimer : This analysis is purely based on my personal opinion and I only trade if the stated triggers are activated .
Ethereum (ETH): Looking For Bounce From 200EMAETH is now back at the 100EMA on the 4H timeframe, the same area where we’ve caught strong bounces before. Both of the last retests gave us solid upside moves, and we’re waiting to see if the same play-out happens again from here.
As long as ETH holds above this EMA zone, the bullish structure remains intact. We’re looking for buyers to step in here and build momentum towards the $5555 target.
Swallow Academy

Ethereum Daily Chart Update📉 Ethereum Daily Chart Update
ETH has diverged on the daily timeframe and indicators suggest a pullback.
⚡ First support: $4,000
⚡ Second support: $3,500
Stay cautious — key levels ahead! 🚀
ETHUSDT price targetsThey all say that September is not a good month for Crypto.
Let's see how these targets work for us.

ETH — Scalp Duel at 4.2k vs 4.5k: Bulls’ Floor or Bears’ CeilingEthereum’s acting like it’s in a holding pattern — circling the runway at 4.3k while traders argue if it’s cleared for takeoff or about to be waved back. The 12H structure is still bullish, but the seatbelt sign is on.
Structure (12H)
• Price consolidating near 4.3k.
• Support: 4.2k. Resistance: 4.45–4.5k.
Orderflow + Derivatives
• OI steady → no new fireworks yet.
• Funding positive → longs footing the bill.
• CVD mixed, hinting at some quiet spot weakness.
Scalp Scenarios
• Short Idea (Grade A): Fade rejection at 4.45–4.5k. Target 4.3k → 4.25k.
• Long Idea (Grade B+): Sweep 4.18–4.2k lows, reclaim 4.22k, then push toward 4.45k.
Conclusion
ETH is boxed in between hungry bears at the ceiling and patient bulls under the floor. Whichever side blinks first sets the scalp of the day.
🐺 Trade safe, stay sharp, and remember: the market hunts sheep, not wolves.
02-09-2025 ETHUSDTThe market is not always chaotic and disorderly, and there is a precise geometric beauty hidden in price fluctuations. The harmonic form long strategy is a powerful tool for accurately identifying potential market reversal points based on the Fibonacci ratio. When the form forms perfectly at the key support level, it often indicates the depletion of bearish momentum and the initiation of bullish trends.
As shown in the figure: 1H Bullish Shark


ETHUSDT Imminent BUYWell, looks like the BUY should happen any moment from now. Hopefully, no devastating setback occurs😂📈

The Levels on ETH That You're MissingYo, what's up. New chart, same story. ETH/USDT, let's look at the August playbook on the 1H chart.
The Setup
We kicked off August in the gutter, bottoming out at 3355. Then came the two-week joyride. Pure euphoria. We blasted past all-time highs to 4800 in mid-August, hitting that old November '21 resistance like a brick wall.
And then, as expected, we got our reality check. One ugly week where we dumped to 4070. That's a clean hit on the March/December '24 support and a perfect 0.5 Fibo retrace from that run. Don't let anyone tell you Fibo doesn't work in crypto.
A little nudge from the Fed got us back on our feet and we managed to break that last resistance. But now, we're back to some sideways movement with a slight downtrend on the 1H and 4H charts. The party's over for now.
What's Happening Now
Over the past week, we've been in a bearish trend on the 1H and 4H charts. What's interesting is that it's forming a beautiful descending wedge within the larger bullish trend. This is a textbook pattern that tells us volatility is condensing and a big move is likely coming soon. Inside this wedge, a smaller triangle has been coiling up since the 4070 bottom. Everything now hinges on the breakout of that orange triangle. (same pattern mid august)
The market has been bouncing between the pattern's boundaries, specifically at 4480 (resistance) and 4260 (support). The next direction depends entirely on which of these two levels gives way. Could this be signaling a new bullish trend?
The Levels That Matter Now
- To go higher: A strong breakout above 4480 is what we need to see. The price already corrected to the 0.786 Fibo, which often suggests that the selling pressure might be exhausted. If we clear this level, the path is open.
- To go lower: A breakdown below 4260 is the decisive point. It’s also a key 0.786 Fibo level from the recent pullback. Worst case, it's back down to the dumpster at 4070
Personally, I'm betting we run it back to a new ATH one more time for a final hoorah before the real bear season kicks off. But hey, that's just me.
Let's see who's right. As always, don't get rekt.

Ethereum Holds Above Key Support, Eyes Rotation Toward $7,200Ethereum is consolidating above $4,090, retesting a critical support zone. Market structure remains bullish, with the next upside target situated at $7,200, a key Fibonacci resistance level.
Ethereum’s price action is showing resilience as it consolidates above its previous all-time high, retesting the $4,090 support level. This zone represents a crucial pivot point for continuation higher, supported by strong technical confluence. With the weekly market structure still intact, Ethereum is preparing for a potential rotation toward higher resistance levels.
Ethereum (ETH) Key Technical Points
- Support at $4,090: Critical zone reinforced by bullish order block and value area low below.
- Market Structure: Weekly trend remains bullish with consecutive higher highs and higher lows.
- Upside Target at $7,200: Fibonacci resistance and major level in focus for continuation.
Ethereum is currently defending the $4,090 region, which has become a vital support following its breakout above previous all-time highs. This level not only represents horizontal structure but also aligns with a bullish order block just below. The presence of the value area low further strengthens the confluence, allowing for potential wicks into the zone before a bullish continuation.
Price action suggests that Ethereum’s bullish structure on higher timeframes remains valid. The weekly chart continues to print higher highs and higher lows, signaling a trend that is well intact. As long as $4,090 holds, the probability of continuation toward higher objectives outweighs the risk of a breakdown.
The next major resistance lies at $7,200, which represents a Fibonacci extension level. This region is significant because it marks not just a technical resistance but also a psychological milestone. A test of this level could attract renewed demand and potentially fuel an even higher rotation if breached with conviction.
Volume behavior will be crucial in confirming the move. Sustained bullish influxes are needed to validate momentum toward $7,200. Without increased participation, Ethereum risks extended consolidation around current levels. However, given the alignment of technical support zones and preserved market structure, conditions remain favorable for continuation.
What to Expect in the Coming Price Action
As long as Ethereum maintains the $4,090 support level, traders can expect continuation higher. A clean defense of this region opens the path toward $7,200, with the broader bullish structure intact. A breakout above this Fibonacci level would further extend Ethereum’s uptrend, while failure to defend $4,090 may trigger a wick into the value area low before continuation resumes.

Sep 2, 2025 - ETHUSDT 1H Chart Analysis-02Yesterday, Ethereum printed another bearish leg, but after reacting to the daily support, it managed to reverse that move and form a " V-shaped ” pattern — a positive signal for those of us looking for long opportunities.
Our entry trigger for ETH remains at 4,485.5 , and with this recent V-shaped recovery, our confidence in that trigger has increased.
Currently, if the trigger activates, the only logical stop-loss would be around 4,220 , which isn’t ideal. It would be better if ETH could form a higher low on the 1H timeframe later today, giving us the chance to enter with a tighter stop-loss.
