Ethereum (ETH/USDT) – Neowave UpdateEthereum continues to move inside a short-term descending channel. Based on the Neowave count, the current structure can be interpreted as wave G of a Diametric pattern.
🔑 Main Scenario:
• If ETH manages to hold above 4315, buyers could regain control.
• In that case, a move toward the channel’s upper boundary around 4410 is likely, completing wave G of the Diametric.
⚠️ Alternative Scenario:
• Failure to sustain above 4315 will keep the bearish tone intact.
• In this case, ETH may retest the lower boundary of the channel, with possible extensions toward 4200–4150.
📌 Conclusion:
Ethereum is at a decision point. A confirmed breakout above 4315 opens room for a rally to 4410, while rejection from this level could extend the corrective phase lower.
ETHUSDT.3L trade ideas

ETH Game PlanETH Game Plan
📊 Market Sentiment
Market sentiment remains strongly bullish as the FED is expected to deliver a 0.25% rate cut, with speculation building for a possible 0.5% cut in September. Monetary policy shifts are being driven by both inflation trends and weakening labor market data. The latest August and September job reports were soft, signaling that the economy is cooling rapidly. This environment continues to fuel expectations for a major bullish run in the weeks ahead.
📈 Technical Analysis
Price has shown strong HTF bullish momentum, recently reaching all-time highs.
Currently, ETH appears to be in an accumulation phase, gathering liquidity and energy before the next expansion higher.
📌 Game Plan
Price should run the $4200 level, which is equal lows and likely contains significant liquidity.
I will then look for a close back above $4200 with a newly formed 4H demand zone.
🎯 Setup Trigger
4H structure break following the liquidity run.
📋 Trade Management
Stoploss: 4H swing low confirming the BOS
Targets:
TP1: $4500
TP2: $4650
TP3: $5000 (All-Time Highs)
💬 Like, follow, and comment if you find this setup valuable!
⚠️ Disclaimer: This content is for informational and educational purposes only and does not constitute financial, investment, or trading advice. Always do your own research before making any financial decisions.

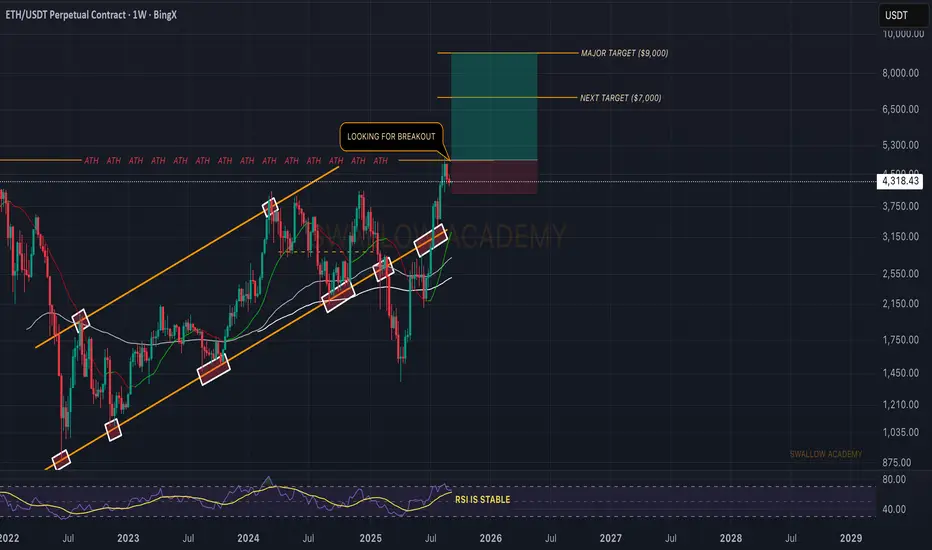
Ethereum (ETH): Getting Ready For New ALL-TIME-HIGHETH has shown strong momentum, and as long as buyers keep dominating the $4,000 zone, the structure stays bullish. This level has been holding, and now we’re entering the next phase of the bull run — liquidity is starting to rotate from BTC into ETH.
Our eyes are on the breakout above the channel highs. If that happens, we expect ETH to push toward $7,000 next, with $9,000 as the major target for this cycle.
Swallow Academy
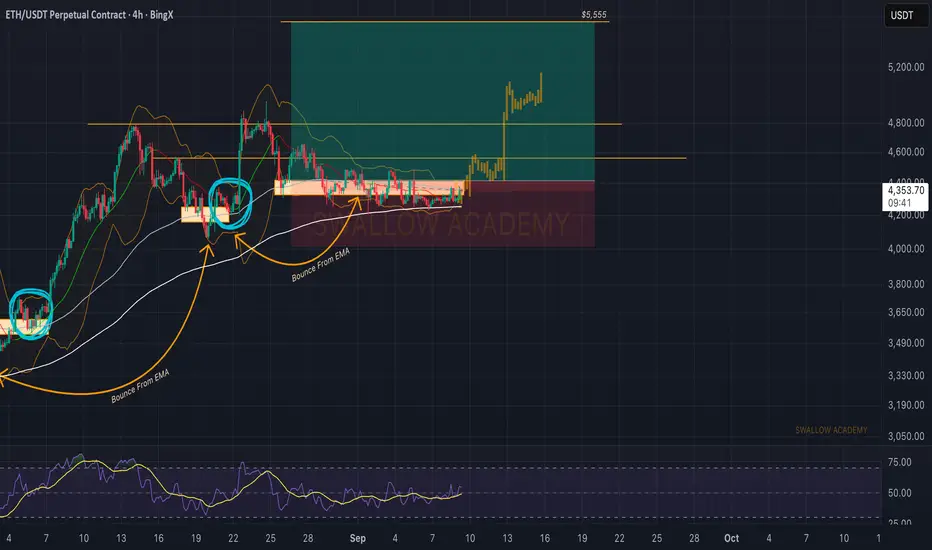
Ethereum (ETH): Pressure Around Zone of EMAs | Bullish? BINGX:ETHUSDT.P is still hovering around the EMAs, creating a zone of pressure. This area has repeatedly acted as a pivot point in the past, and we are now waiting to see if buyers step in with the same momentum.
As long as price holds above this structure, the bullish setup remains valid. A clean bounce from here could open the door for continuation toward $4,800 and eventually $5,555.
Swallow Academy

ETH Breakout Ahead: $6700 Target on the Horizon !Hello Traders 🐺
As I mentioned before, when ETH was around $1430, I said price is on its way to reclaim its ATH. Now, after breaking above this huge triangle pattern — an obvious sign of long-term accumulation — the next target sits around $6700 at the 0.5 Fibonacci level.
But it’s not just the technicals. Fundamentals are also pointing toward a strong upcoming pump:
Inflation at 2.7% → almost in line with the Fed’s target.
Unemployment at 4.3% → highest in 4 years, signaling labor market weakness.
NFP only 22K → far below trend.
Jobless Claims above expectations → more signs of deterioration.
This combination puts the Fed in a forced position: either cut rates or risk a severe recession.
📉 Realistic Odds
A 25bps rate cut in September looks almost certain.
A larger 50bps cut is, in my opinion, more likely than what the market is currently pricing (above 10–14%), given how weak labor data really is.
Now let’s zoom into the 4H chart:
As you can see, ETH is forming a falling wedge, ready to break to the upside. If price manages to push above the current high, we can expect strong volatility and continuation to the upside.
I hope you enjoy this idea and as always remember our golden rule :
🐺 Discipline is rarely enjoyable , but almost always profitable . 🐺
🐺 KIU_COIN 🐺

ETH New Update (4H)This analysis is an update of the analysis you see in the "Related publications" section
Honestly, as you know, the market had been ranging for several days without much movement. On the chart, we had signs of a drop, but the drop didn’t happen, and instead the market dropped in a way that was shown.
Considering that the demand zone has held and the market is still ranging, we can return to the scenario of (this analysis () and expect to see some recoveries from Ethereum.
Either Ethereum can get rejected from the identified supply zone, or it can make a new all-time high afterwards.
For risk management, please don't forget stop loss and capital management
When we reach the first target, save some profit and then change the stop to entry
Comment if you have any questions
Thank You

Short SqueezeShort Squeeze on ETH once it fakes the deviation. Expecting an entry shown as that is prev resis but also will be in the current range. TP: scale out half once ATH is reached then the sky is the limit.

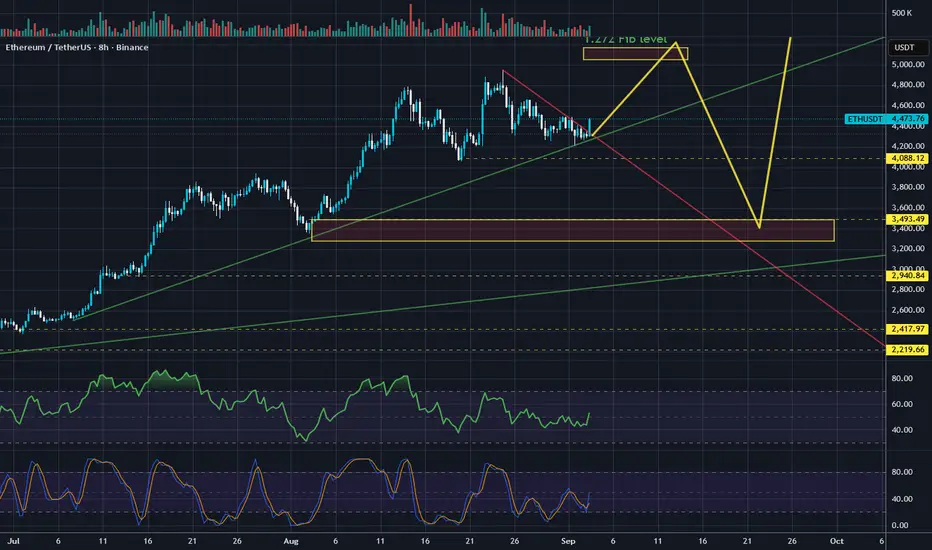
ETH one last push before rate cuts in September.Ethereum broke down-trend since last All time high while holding green trend line.
This gives one more opportunity to visit 1.272 fib level which is at 5100-5250$
After this move is done expect agressive correction to ~3440$. ETH will surge up to the new ATH at the end of this cycle after correction is over probably somewhere in october.
ETHUSDT – The “BIG” Wave Is Coming ?Hello everyone, glad to see you again as we dive into BINANCE:ETHUSDT !
Today, Ethereum continues to show strong accumulation as it consolidates tightly around the 4,200 USDT support zone. This area is being strongly defended and also aligns with key retracement levels on higher timeframes, suggesting that the bulls are far from giving up.
At the moment, ETH is in a “compressed spring” state – the longer it moves sideways, the stronger the breakout potential. If the support holds, we could see a powerful bullish wave emerge, with the potential to test resistance and even break higher. Smart traders know: accumulation equals opportunity!
What about you – do you think ETH will break through or bounce back from the 4,800 USDT resistance? Share your thoughts in the comments below!


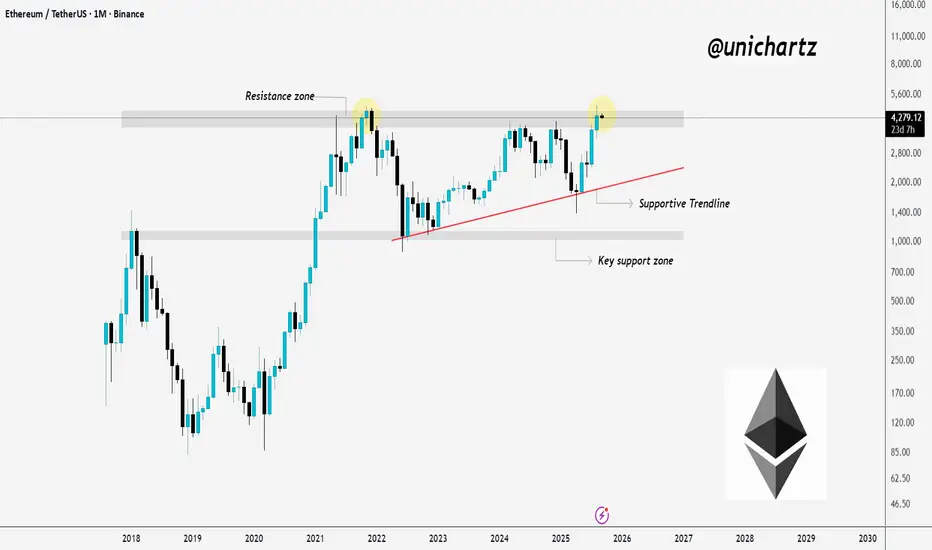
Decision Time for ETHCRYPTOCAP:ETH is struggling at the marked resistance zone.
Price has tested this area multiple times, which confirms it as a strong supply region. Right now, ETH is consolidating below resistance while holding above the supportive trendline.
If bulls can secure a clean monthly close above this resistance zone, the path opens for continuation toward higher levels. But if rejection plays out again, we could see a pullback to the supportive trendline or even toward the key support zone before another attempt.
This level is critical, it will decide whether ETH breaks into a new rally or spends more time ranging.
DYOR, NFA
More updates coming soon, Stay turned
Ethereum (ETH): Buyers Secured The EMAs | Mega BullishCRYPTOCAP:ETH showing strong signs as momentum starts kicking in right above the EMAs. Buyers have defended these zones multiple times, and now we’re finally seeing that push we’ve been waiting for.
As long as price holds above this area, the target at $5,555 stays active. This bounce near EMAs could be the key driver for continuation in the coming sessions.
Swallow Academy

ETHEREUM TO BREAKOUTEthereum is holding above September's pivot at $4,230, and when the yellow resistance line is broken, it may start the rally again and $4775 can be the first target

ETHUSD Long Trade BITSTAMP:ETHUSD Long Trade
Entry: 4270 - 4335
TP-1: 4390
TP-2: 4580
This is good trade.
Don't overload your risk like Greedy gambler!!!
Be Disciplined Trader, risk what you can afford.
Use proper risk management.
Disclaimer: Trading is risky, only idea, not advice.

Ethereum Update📊 Ethereum Update
ETH is ranging between $4,200 – $4,500.
We’re waiting for a breakout on either side to confirm the next trend. ⚡️
Crypto markets in waitCrypto markets in wait ⚖️
BTC & ETH are range-bound as traders await major news:
📌 Fed interest rate decision
📌 Bitcoin ETF review
A potential breakout—up or down—could happen after these events

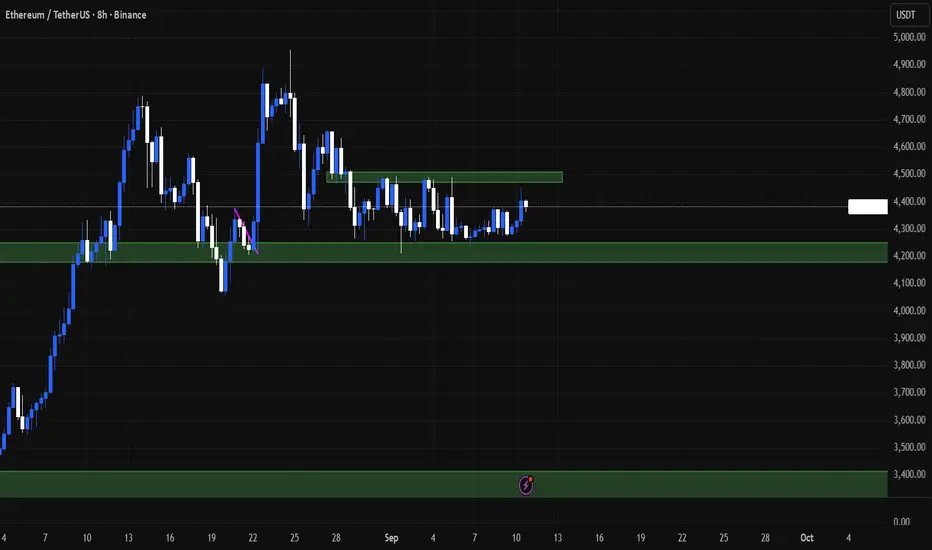
Ethereum ETH 2025 analysis and prediction daily demand levelEthereum ETH 2025 analysis and prediction as a reaction to the daily demand level at $4336. If the daily high in red is broken, a breakout is expected. ETH has been doing nothing for days, price action is not behaving as it usually does at these imbalances.
This is happening with Bitcoin BTC weekly demand level in control and playing out well. Refer to my BTC analysis in another trading idea.

ETH - Don’t be fooled - Bearish Retest ETH (like Bitcoin) has risen only to retest a bearish breakdown on the HTF.
This whole upwards movement is one big set up - to trap liquidity in longs and absorb it all from the chart.
My initial call is marked here with original entry.
Second entry can be 4,420 region.
Short to my targets marked on chart.
Don’t be a sucker and get trapped by this.
Happy trading

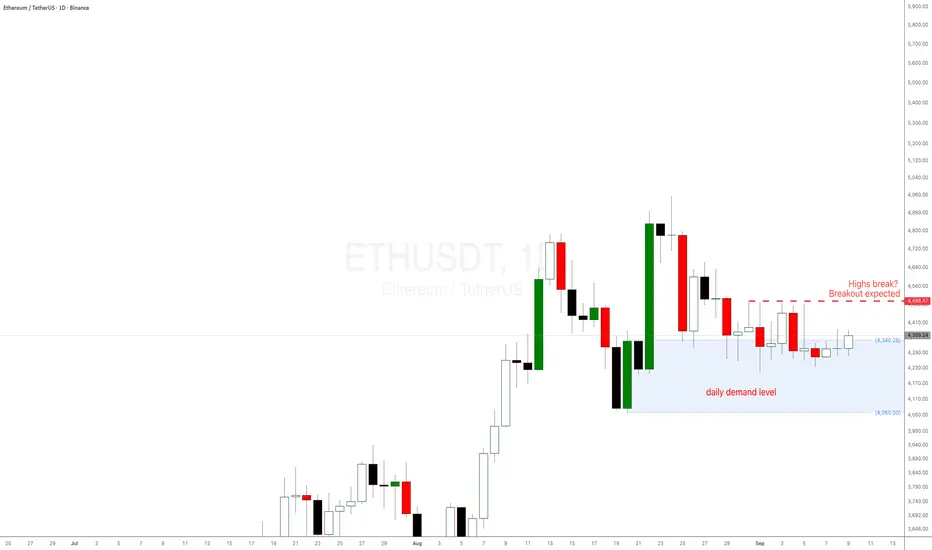
Ethereum Weekly Analysis📊 Ethereum Weekly Analysis
This week, I have analyzed the ETH/USDT chart focusing on key support & resistance levels, market structure, and potential trading zones.
The breakdown includes:
🔹 Weekly trend direction
🔹 Major support & resistance zones
🔹 Key liquidity levels & possible reversal points
🔹 Short & long opportunities based on structure
This analysis is purely educational and based on my personal trading experience. Always manage risk properly and do your own research before trading

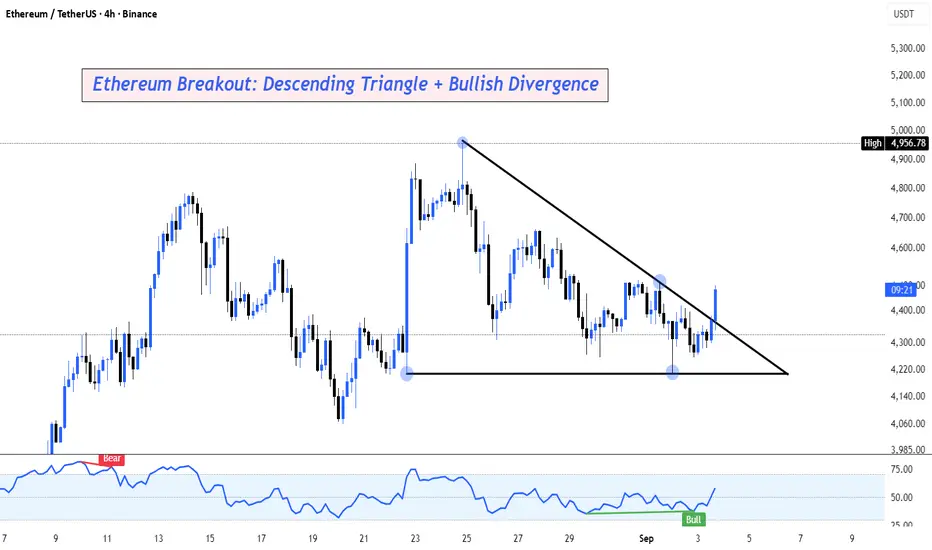
Ethereum / TetherUS – 4H ChartETH has been consolidating inside a descending triangle, with lower highs pressing into horizontal support around $4,200–$4,250.
On this 4H timeframe, price has just broken above the trendline resistance with momentum confirmation from the RSI, showing a bullish divergence.
🔹 Bullish Case:
If ETH holds above the breakout zone, we could see continuation towards $4,480 → $4,600 liquidity pocket.
A sustained move above $4,600 opens the door toward $4,950–$5,000.
🔹 Bearish Invalidation:
If ETH fails to hold above $4,250, a retest of the $4,060 low remains on the table.
This breakout, paired with RSI strength, makes ETH one to watch closely this week.
👉 Do you think bulls can finally reclaim $4,600 and flip structure back to bullish?
ETH/USDT: Bullish Rise to 4580? BINANCE:ETHUSDT is gearing up for a bullish move on the 4-hour chart , with an entry zone between 4200-4250 near a key support and trendline. 🎯
The target at 4580 aligns with the next resistance, signaling strong upside potential. 📈 Set a stop loss on a close below 4000 to manage risk effectively.
Be patient until the price reaches the Entry Zone . If it doesn't, don't worry. The market is always alive and always gives us good trading opportunities.💡
Ready for this lift-off? Drop your take below! 👇
📝 Trade Plan:
✅ Entry Zone: 4200 – 4250 (support + trendline confluence)
❌ Stop Loss: Close below 4000 to manage risk
🎯 Target: 4580 (next resistance level)
