ETH/USDT COILING I often return to assets with fresh eyes and new time-factor . Here is my latest for: ETH/USDT idea.
ETH/USDT is COILING and ready for another leg to test ATH high again. It must first travel and claim the a new DISCOUNT ARRAY before its true moment can be filled.
DAILY FVG has been disrespected and now acting as the new DISCOUNT ARRAY for a potential move higher. A BREAKAWAY candle on the DAILY FVG just below is what will be our confirmation. Best of luck.
🚩 Invalidation: If the Daily FVG breaks with a clear breakaway candle, this setup is void.
ETHUSDT.3L trade ideas

ETH 4H Analysis - Key Triggers Ahead | Day 15💀 Hey , how's it going ? Come over here — Satoshi got something for you !
⏰ We’re analyzing ETH on the 4-Hour timeframe .
🔭 On the 4-hour timeframe for Ethereum, we can see that ETH is currently moving inside a very strong box and is preparing for this week’s upcoming news. The resistance (ceiling) of this box sits at $4,471, while the support (floor) is around $4,254. Once either of these levels is broken, Ethereum could make a strong move after this long consolidation phase. There’s also an early trigger zone at $4,332; if ETH breaks and stabilizes above this level, we can consider entering a position toward the top of the box.
⛏ Key RSI levels for Ethereum are at 58 and 40. Breaking these ranges could signal the start of a strong move. With increased volatility, ETH could even push toward the overbought (OB) or oversold (OS) zones.
💰 Currently, the size and volume of candles have dropped significantly — something we often see during holiday sessions. But with the start of the new week and upcoming economic reports, Ethereum could generate bigger candles and stronger momentum once it breaks out of this box.
🪙 Looking at the ETHBTC pair on the 4-hour timeframe, the chart still looks bearish with decreasing volume. The current zone is considered a maker-buyer area, and we’ll need to watch how the whales react here. If this level is lost, Ethereum could face a deeper correction and move toward its lower support levels.
💡 Ethereum currently has 3 alarm zones:
A short alarm zone at the bottom of the box — if broken, it could trigger stronger selling pressure.
A long alarm zone #1 at $4,332, acting as an early trigger for a potential breakout toward the top.
A long alarm zone #2 at $4,471 — breaking and holding above this level could lead to a solid upward move.
❤️ Disclaimer : This analysis is purely based on my personal opinion and I only trade if the stated triggers are activated .

#ETH Sideways Consolidation📊#ETH Sideways Consolidation📊
🧠From a structural perspective, we're currently within the target of a bullish structure on the daily chart, so be wary of a correction on the daily chart! The price is currently in a sideways consolidation phase on the 4-hour chart, with resistance near 4500 and support near 4200.
➡️There are signs of a third test of the 4500 resistance level, but be cautious of false breakout scenarios, as the risk of chasing the rally is too high. Furthermore, ETH spot ETFs have recently seen net outflows, so I'm more inclined to believe a rebound scenario after testing lower support levels, such as a rapid drop below 4000 followed by a strong rebound.
➡️It's worth noting that the altcoin wave has already arrived, so we should keep an eye on the altcoin market opportunities.
Let's take a look👀
🤜If you like my analysis, please like💖 and share💬 BITGET:ETHUSDT.P

ETH 4H Analysis - Key Triggers Ahead | Day 18😃 Hey , how's it going ? Come over here — Satoshi got something for you!
⏰ We’re analyzing BTC on the 1-Hour timeframe.
🔭 On the 4-hour timeframe of Ethereum we can see that ETH is clearly in a very strong consolidation, and for several days even the oscillator has been ranging around the 50 zone. This time-based range will eventually come to an end. Ethereum now has two important levels ahead with the upcoming news: the top of the box midline at $4373, where breaking this zone could trigger a strong pump, and the bottom zone, which is a maker-buyer area at $4252, considered a very strong and important support for Ethereum.
⛏ The key RSI levels for Ethereum are at 57 and 40. If the range of oscillation crosses these levels, ETH could gain more volatility and even move toward its overbought or oversold regions. Usually, this type of short-term consolidation ends with a good price move once the compression is broken.
💰 The size, volume, and number of green candles have really decreased, and multiple candles inside the range have formed, creating a decision-making phase for ETH. With today’s PPI news, it is likely that one of these zones will either be touched or broken, and after this news, candles are expected to come with stronger volume.
🪙 On the 4-hour timeframe of the ETHBTC trading pair we can see that it is in a descending continuation channel. Each time the price has reached the top or bottom of this channel, it has reacted with a reversal and then moved in the opposite direction. Currently, ETHBTC is above its midline and has shown a positive reaction to it. The volatility of this pair has significantly decreased in recent days and is now ranging under its 50 zone. A breakout above the channel top and the 0.03893 level could start a bullish move.
💡 The zones we are considering for Ethereum’s top and bottom are $4493 and $4252. Breaking either of these levels after this multi-day consolidation could start a strong trend and even a sharp directional move! Keep in mind that war and economic news have created interconnections for risky markets—trade with low risk.
❤️ Disclaimer : This analysis is purely based on my personal opinion and I only trade if the stated triggers are activated .

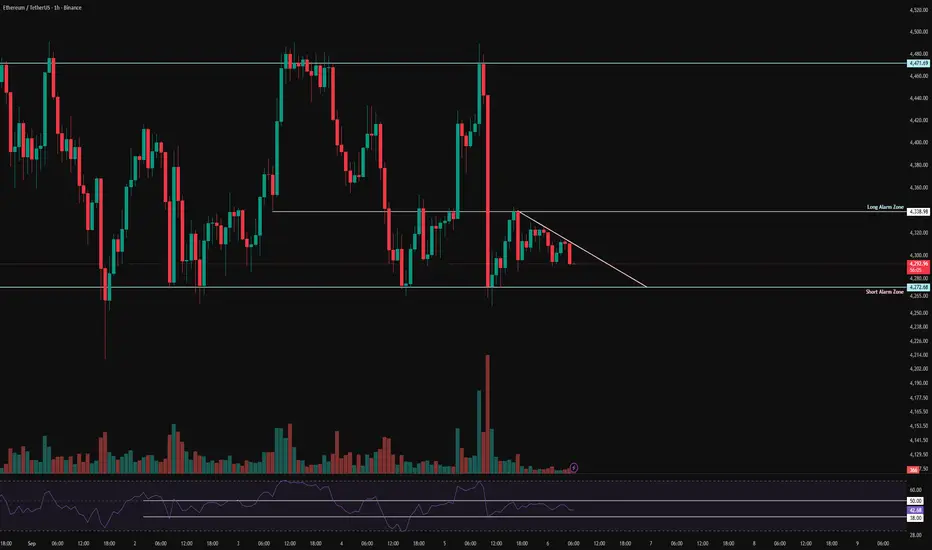
ETH 1H Analysis - Key Triggers Ahead | Day 17💀 Hey , how's it going ? Come over here — Satoshi got something for you!
⏰ We’re analyzing BTC on the 1-Hour timeframe.
🔭 On the 1H timeframe for Ethereum (ETH), price rejected strongly from the 4336$ resistance and started moving lower. ETH is now trading close to its support zone at 4286$, having recently broken out of a consolidation range.
⛏ On the RSI, the key levels are 70 and 37. A move beyond these zones could trigger momentum toward either overbought or oversold conditions. Keep in mind that volatility is still closely tied to macroeconomic news.
💰 Candle structure shows increasing red candle size and volume, signaling stronger selling pressure. With ETH being heavily involved in both futures contracts and DeFi markets, much of this move reflects profit-taking and sell pressure at higher levels.
🪙 Looking at the ETHBTC pair on the 1H, the chart shows a steady downtrend within a compression zone. If ETH loses its current support, the pair could extend further down. The volatility index for this pair is sitting at 45.52, below the 50 zone, and with short positions picking up, ETH could face additional sell pressure.
💡 The current zone ETH is trading in looks like a maker-buy area, but likely to be broken by whale candles.
For short positions : The better setup would be to wait for a whale candle break, then enter on the pullback for higher win rate.
For long positions : A clean breakout above 4336$ would allow for an order stop-buy entry or a pullback + candlestick confirmation setup to get in long.
⚠️ Note: Today looks like a high-impact day with global shifts in play—trade with reduced risk.
❤️ Disclaimer : This analysis is purely based on my personal opinion and I only trade if the stated triggers are activated.

EnthusdEth still bullish , tens of billions of inflows in August . is very positive for eth . Institutions very confident purchasing as strategic asset . I think ethereum tops 8k at least before the bull run is over but you never know

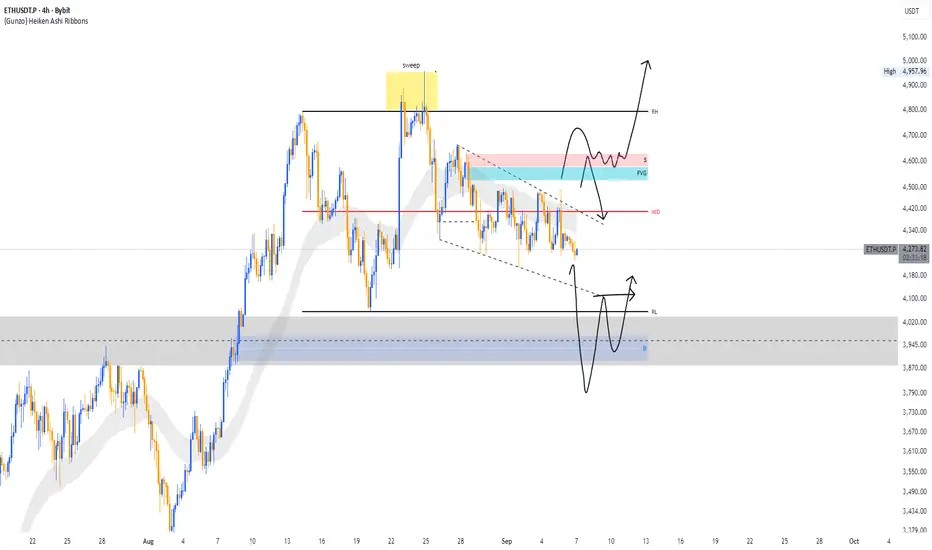
ETH/USDT 4H AnalysisEthereum is consolidating after a recent liquidity sweep near $4,950. Price is currently ranging between mid-level resistance ($4,420) and the demand zone around $3,950–$4,000.
Two possible scenarios in play:
🔹 Bullish Case: If ETH holds above $4,200 and clears the FVG + supply zone ($4,600–$4,700), we could see a strong continuation toward $5,000 psychological level.
🔹 Bearish Case: If current support fails, ETH may retest the grey demand zone ($3,900–$3,950) before any bullish recovery.
Key Levels to Watch:
Resistance: $4,420 / $4,700 / $5,000
Support: $4,200 / $3,950
⚠️ This analysis is for educational purposes only, not financial advice. Always trade with proper risk management.
💬 Do you think ETH will reclaim $5k next, or will we see a deeper correction first?
$ETH Breakout Signals 10% Upside PotentialCRYPTOCAP:ETH has broken out of its downtrend and reclaimed support around 4.5K.
If it holds, momentum could push toward 5K, nearly a 10% move.
DYOR, NFA

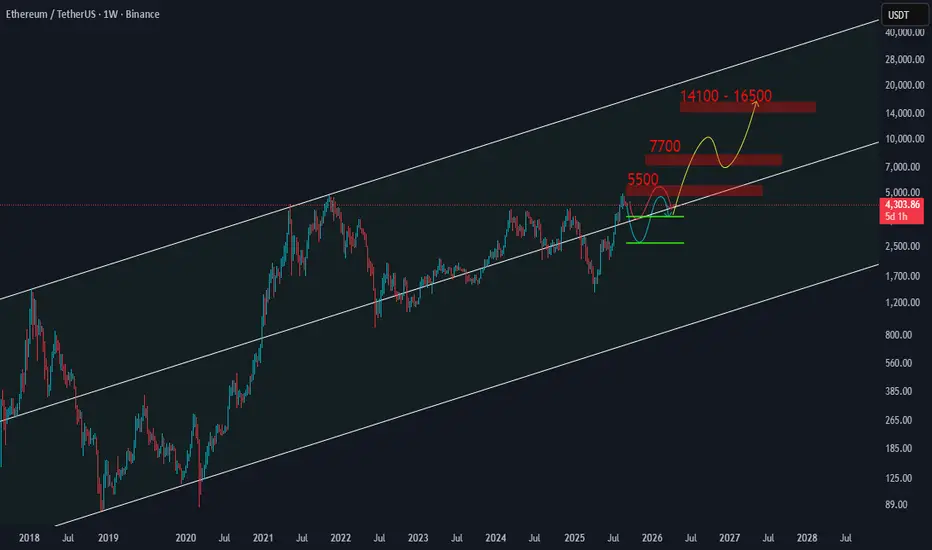
Ethereum Weekly Time Frame AnalysisEthereum is correcting to $3,600 or in the most pessimistic case to $2,500 and then will move towards the next targets of "5,500" and "7,700" and "14,100" to "16,500" respectively .
Weekly trading plan for EthereumAll last week, Ethereum’s price was forming a range. At the moment, it is near the key 4,373 level and trying to break through it. Most likely, if this level breaks, the price will push toward the resistance zone and could break it this time.
If, however, a correction starts soon and the weekly pivot point breaks, the target will be a new local low, bringing the price down toward 4,000 .

ETH: Step by StepOn September 6, I opened a short on the 1-hour chart from $4294 — the decision was based on the indicator’s readings. The move down to $4227 allowed me to close the first target. About $70 difference per coin. Part of the profit was realized, part was left to the market — and that’s part of the plan.
The key here is not guessing but consistency. The indicator outlined the key levels, highlighted the control zone, and I followed the scenario step by step. This approach removes chaotic decisions and reduces emotional pressure.
When you see the structure of the move in advance, holding a position becomes easier. The plan turns the market from chaos into a map, where it’s clear when to take profit and when to stay calm. It helps to remain in the trade longer and make decisions without rushing.
The market will always remain unpredictable. But when actions are built on a system, results are shaped not by luck, but by discipline and the ability to move step by step.

ETH ETH price prediction for the upcoming days
If breaks out of this box, higher targets to ATH and 5400 is feasible
If it loses this level, 3800 is the next stop

ETH 1H Analysis - Key Triggers Ahead | Day 14💀 Hey, how's it going ? Come over here — Satoshi got something for you!
⏰ We’re analyzing ETH on the 1-hour timeframe timeframe.
🔭 On the 1H timeframe for Ethereum, we can see that after yesterday’s news, ETH pushed upward toward the top of its range but failed to break out. From that resistance, it faced a heavy rejection, and this drop happened within just two 1H candles! At the moment, ETH is in a consolidation zone, and breaking out of this compression could provide us with an entry.
⛏ The key RSI oscillator levels are at 38 and 50. Once RSI breaks above or below these zones, Ethereum could start its next move following the effects of yesterday’s NFP news.
💰 The size and volume of red candles have increased sharply, showing strong selling pressure. The corrective bounce happened step by step, but then another fairly large red 1H candle was printed. With continued selling pressure, Ethereum may test lower price levels.
🪙 On the 1H timeframe for the ETHBTC pair, we can see it is moving inside a multi-timeframe range. Each time it reaches the bottom of the box, volume increases and the price reacts with zig-zag moves. Note that the bottom of this box is at 0.03864, which has already been tested twice. This area should be considered as a short alert zone for ETHBTC.
💡 The alert zones for Ethereum itself are at 4,272$ and 4,338$. If either of these levels is broken, ETH could start a strong move, especially considering the momentum after yesterday’s NFP News.
❤️ Disclaimer : This analysis is purely based on my personal opinion and I only trade if the stated triggers are activated .
Intra-Day Trade Review: GOLD, Ethereum, Bitcoin, OilHey guys heres a quick review on FX:XAUUSD , COINBASE:ETHUSD , FX:USOIL & BITSTAMP:BTCUSD
Let me know your thoughts in the comment section below.
Cheers!

ETH Losing Momentum — Correction AheadETH has been one of the most overheated assets for a long time, but now it’s finally cooling off. Attention has shifted back to BTC and SOL. But what’s next for ETH? Let’s break it down.
The price has broken below its ascending channel pattern, something I’ve warned about many times. This is the first sign of a trend shift — at minimum, into a range.
Confirmation of a full trend reversal into a bearish phase will be a break of market structure (MS) at $4,060.
And that looks likely soon, because:
➡️ Money Flow shows divergence — liquidity continues to flow out of ETH, already reaching levels last seen when ETH traded at $2,200 and below.
➡️ Buying Volume keeps declining, also diverging. Not at the new ATH, not anywhere, did we see growth in buying activity. That means the crowd simply has no interest in ETH.
➡️ Three gaps have formed below: $4,180–3,638, $3,565–2,975, and $2,467–1,856. And as we know — as SOL just reminded us — gaps close 99% of the time sooner or later. ETH has already started partially closing one of them.
Even today, while the whole market is rising, ETH can’t move. And when price can’t go up, it obviously goes down.
📌 So the next target is $4,000 — a critical psychological level plus the MS level.
A breakdown there will officially flip ETH into a bear market.

ETH – Back at support?Demand box is still holding price. We just tagged H4 EMA200 and trendline again too, good long opportunity with a very tight invalidation.
More importantly, watch a possible loss of the trendline and demand zone for a flush into the 3800 zone, I think the better long opportunity is there and it can pay to have some bids sitting there.

ETH/USDTLooking for a sweep of the LPL candle that prohibited the next bullish FVG. Return to the FVG followed with a rejection candle higher and close above Breaker Block, open a long and target prior high.

ETH at a Crossroads: Bounce or Breakdown?ETH at a Crossroads: Bounce or Breakdown?
ETH hit our first target at 4335 and bounced back over the weekend.
Right now, it's testing a strong resistance zone—the same area that caused a drop before. If this zone holds, ETH could start another bearish wave (as shown in the black scenario), but the setup still needs more time to develop.
If ETH pushes a bit higher, it might reach 4650, where another resistance zone could trigger a reversal.
BTC also looks weak, and if it drops, ETH might follow—even though it’s holding up better for now.
Overall, it’s still a risky setup, especially with the USD lacking clear direction.
I lean toward the bearish scenario in black, but we’ll need to watch how things unfold.
You may find more details in the chart!
Thank you and Good Luck!
PS: Please support with a like or comment if you find this analysis useful for your trading day

ETHUSDT Aiming Recent HighsHi there,
ETHUSDT has the potential to increase from the support zone of 4285.01 and reach between 4417 and 4459, with a bias toward 4560. It will take time, and monitoring will be required.
Happy trading,
K.
Not trading advice

ETHUSDT.PHello friends
Given the good growth we had, the price has made a 14% correction. If the specified support is maintained, the price can see the specified targets. If the support is broken, the price can fall by another step. We have identified important support points for you.
*Trade safely with us*

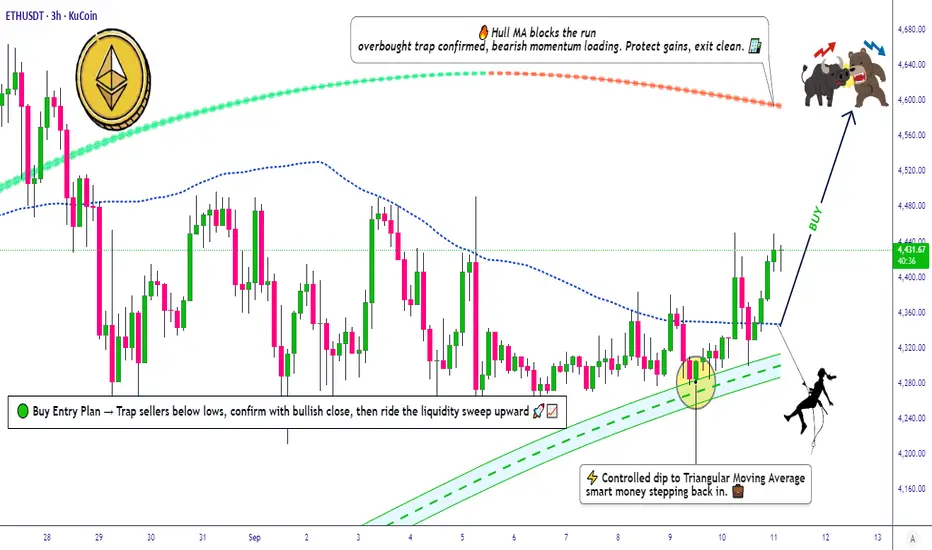
ETH/USDT Technical Roadmap | Bullish Swing & Day Trade Levels📌 ETH/USDT "Ethereum vs Tether" Crypto Market Plan (Swing/Day Trade)
🔹 Plan: Bullish (Pending Order Breakout Plan)
We are preparing for a breakout setup around 10.000⚡ TRIANGULAR MOVING AVERAGE BUY PLAN.
Price action shows strong buyer strength with signs of institutional accumulation on dips.
🛠️ Thief Strategy (Layered Entry Style)
This strategy uses multiple limit orders (layering method) after breakout confirmation.
✅ Example buy limit layers (can be adjusted to your own risk):
4350
4370
4390
4420
👉 Please set a TradingView alert near the breakout level so you don’t miss confirmation.
🛑 Stop Loss (Risk Management)
📍 Suggested risk level: 4300 (after breakout confirmation)
This is the Thief SL reference point, but remember:
Adjust your SL based on your personal risk tolerance & strategy.
🎯 Target (Profit Zone)
Price may face resistance near moving averages with possible overbought traps.
📍 Planned exit zone: 4600
Manage your own TP — use targets that fit your risk/reward ratio.
🔗 Related Pairs to Watch
BINANCE:BTCUSDT – Bitcoin breakout strength often leads ETH moves.
BINANCE:ETHBTC – Key ratio showing ETH’s relative strength vs BTC.
BINANCE:SOLUSDT – High-beta crypto that often correlates with ETH sentiment.
BINANCE:BNBUSDT – Another major altcoin for cross-market momentum comparison.
✨ “If you find value in my analysis, a 👍 and 🚀 boost is much appreciated — it helps me share more setups with the community!”
#ETH #ETHUSDT #Ethereum #Crypto #SwingTrade #DayTrade #BreakoutStrategy #LayeredEntries #CryptoTrading #TradingPlan
ETH Pullback before ATH and AltseasonOver the past few months, ETH has been a beast. Now it needs to cool off before it can push to higher highs, igniting the broader altcoin market and the long-awaited "altseason."
Coinciding with an oversold RSI, I anticipate that we will see a "sell the news" event for next week's FOMC announcement on 9/17. This aligns with historic seasonality of September being a bearish month.
My forecast is that we pull back to the $3,900-$3,500 zone (.618 fib and 21 week EMA confluence) before pushing to higher highs.
IF ETH holds above $5k with volume, this will allow the broader altcoin market to pump, attracting massive liquidity to close out Q4 in euphoria.
Happy trading,
Melonfarmer

what I will do with eth“On ETH, waiting for a range breakout and reversal at 4330 to target 4423. This implies a 2% move, with a stop at 4290 (≈1%), giving a 2:1 risk-reward ratio.”
