ETH Pullback before ATH and AltseasonOver the past few months, ETH has been a beast. Now it needs to cool off before it can push to higher highs, igniting the broader altcoin market and the long-awaited "altseason."
Coinciding with an oversold RSI, I anticipate that we will see a "sell the news" event for next week's FOMC announcement on 9/17. This aligns with historic seasonality of September being a bearish month.
My forecast is that we pull back to the $3,900-$3,500 zone (.618 fib and 21 week EMA confluence) before pushing to higher highs.
IF ETH holds above $5k with volume, this will allow the broader altcoin market to pump, attracting massive liquidity to close out Q4 in euphoria.
Happy trading,
Melonfarmer
ETHUSDT.3L trade ideas

what I will do with eth“On ETH, waiting for a range breakout and reversal at 4330 to target 4423. This implies a 2% move, with a stop at 4290 (≈1%), giving a 2:1 risk-reward ratio.”

ETH/USDT - 1D ETH is consolidating just below its ATH. The news candle low from Aug 22 has held up well so far. Today’s CPI release will likely dictate short-term direction until next week’s FOMC meeting.
Key level to watch: a daily close above 4500. That would open the door for a retest of the ATH, and I expect a new ATH to form into the FED meeting if that breakout holds.

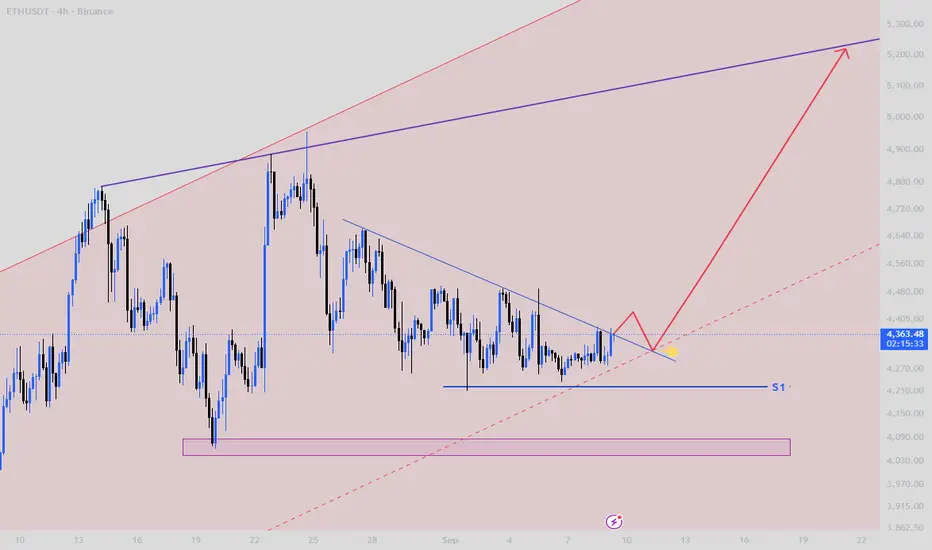
ETHUSDTWe can enter after the blue line breaks at the yellow dot. If the price falls again, the support area (S1) is also a good point to enter.
Ethereum (ETH) Spot AnalysisEntry: 4,195
Stop Loss: 3,790
Targets:
4,590
4,790
4,992
I’m monitoring Ethereum with a potential long setup as outlined above. Risk management is key here — always stick to your stop loss and take profits gradually at the defined levels.
⚠️ Disclaimer: This is purely my personal market outlook and not financial advice. Please trade responsibly, apply proper risk management, and remember that the responsibility for any trade lies solely with you.

EthusdEthereum about to break monthly resistance if it can last 4600 I think it will keep going higher Macd looks good . Next week interest rates are cut crypto will reach new highs very soon

#ETHUSDT 4H ChartPrice is still moving upwards after liquidating the equal highs. MACD is starting to show some bullish weakness, RSI is bought and EMAs are turning bullish. Price is expected to keep pushing upwards aiming towards the 4h supply zone at around $4,800.

Short-term analysisEthereum managed to break through a very significant resistance level, and if confirmed without being a fake breakout, the price could easily reach the **4,666.66** area.
However, for entering a position, you should wait for strong confirmation, as there is a high chance that the breakout could turn out to be fake.

ETH: Moving ForwardOn September 8, I entered a long on the 1-hour chart from $4322 with 15x leverage. Price moved up to $4382, hitting the first target. The $60 difference per coin delivered a solid result even with partial profit-taking. The rest was left to the market — missed profit is always there, but it’s not critical when the process is systematic.
The decision was based on the indicator’s readings: levels were outlined in advance, control points marked. This removed unnecessary guessing and kept the trade calm. Instead of chasing price emotionally, the move unfolded step by step like a planned route.
With a clear structure, holding a position becomes easier. Even with leverage, risk stays manageable, and decisions are made without rush. The market picture turns transparent: when to take profit, when to wait, when to keep a cool head.
The trade isn’t fully closed yet — I continue to observe. The market always brings new moves, and discipline is what allows you to face them prepared.

ETH 1H Analysis - Key Triggers Ahead | Day 16💀 Hey , how's it going ? Come over here — Satoshi got something for you!
⏰ We’re analyzing ETH on the 1-Hour timeframe.
🔭 On the 1H timeframe for Ethereum, we can see that ETH has broken through its resistance zone at $4332. A pullback and consolidation above this level could give us strong trading opportunities. From a multi-timeframe pattern perspective, ETH is still trading inside a larger box, with significant distance remaining to the box’s upper boundary. If ETH confirms this breakout, the next resistance level sits around $4480, and a break above that could push ETH outside of its current range.
⛏ The key RSI zones are 70 and 37. If momentum crosses above 70 into Overbought territory, ETH could continue its current bullish trend.
💰 The size and volume of recent green candles on ETH have been increasing, supported by strong buying. The compressed range structure built during the weekend has now been broken with higher buying volume and the clearing of sell orders. As long as open interest remains strong, ETH has room to move higher.
🪙 Looking at the ETH/BTC pair on the 1H timeframe, it faked out below the marked support level and is now pushing upward. The key resistance here is at 0.03883, and a confirmed breakout above this level could fuel further upside for ETH against USDT.
💡 Currently, Ethereum is sitting in a crucial zone. Multi-timeframe confirmation above this level could give us a clean long setup. The immediate resistance zone is $4332, while further resistance levels can be mapped out with a Fibonacci retracement.
❤️ Disclaimer : This analysis is purely based on my personal opinion and I only trade if the stated triggers are activated .

Continuation of Ethereum’s rangeUnlike many currency pairs and Bitcoin, Ethereum showed no reaction to today’s news and is still moving within the same previous range. In such cases, this itself is a signal — meaning that whichever side the price manages to break the range from, the move will likely be strong, since the price has already made up its mind. At the moment, if you are insisting on opening a position on this coin, you can trade based on the range pattern. ✅

#ETHUSDT 4H ChartPrice is currently consolidating between the 100MA and 200MA showing no major changes. MACD is showing some bullish momentum, RSI is bought and EMAs are neutral. Price needs to break above the 100MA in order to expect further bullish movements towards the 4h supply at $4,750.

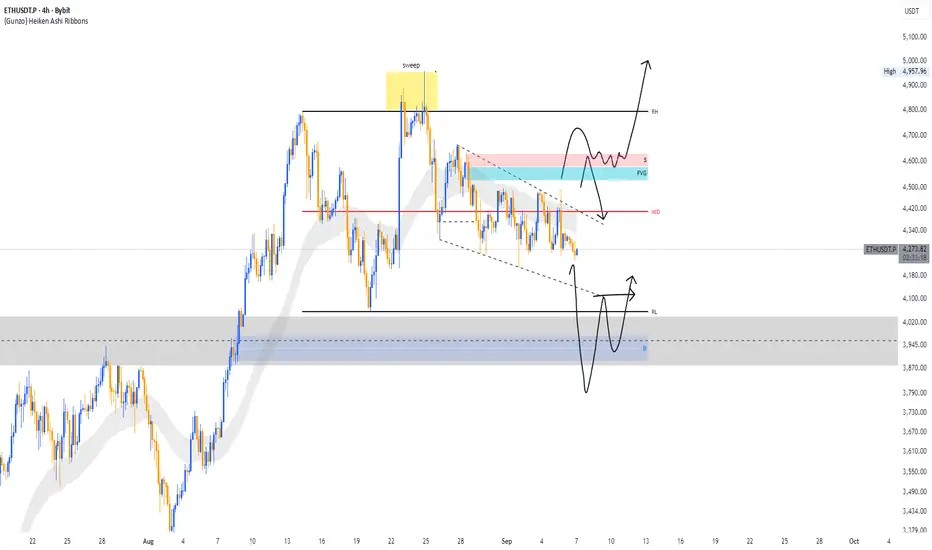
ETH/USDT 4H AnalysisEthereum is consolidating after a recent liquidity sweep near $4,950. Price is currently ranging between mid-level resistance ($4,420) and the demand zone around $3,950–$4,000.
Two possible scenarios in play:
🔹 Bullish Case: If ETH holds above $4,200 and clears the FVG + supply zone ($4,600–$4,700), we could see a strong continuation toward $5,000 psychological level.
🔹 Bearish Case: If current support fails, ETH may retest the grey demand zone ($3,900–$3,950) before any bullish recovery.
Key Levels to Watch:
Resistance: $4,420 / $4,700 / $5,000
Support: $4,200 / $3,950
⚠️ This analysis is for educational purposes only, not financial advice. Always trade with proper risk management.
💬 Do you think ETH will reclaim $5k next, or will we see a deeper correction first?
Elliott Wave 4 still in play ?There’s nothing worse than trading a slow, choppy market that doesn’t range far enough in either direction to give a clean read. This past week I’ve been tracking whether Wave 4 has finished or if we’re still stuck in its structure. My bias is that Wave 4 will drag on a little longer.
I expect price may test near the 0.382 Fib retrace before we get another leg higher that could still be part of Wave 4. Ideally, I’d like to see a correction down to the 55 EMA (green line), followed by two higher highs, a pullback, and then a breakout above the end of Wave 1. That would confirm the start of Wave 5 on the daily timeframe.
Based on my Fib time-cycle analysis (the vertical lines on the chart), Wave 5 might not truly start until late October. In the meantime, I’m scalping shorter timeframes—using Elliott Wave counts on the lower TF and MACD divergence on the slightly higher TF—to secure some overnight trades while waiting for a bigger breakout.
Trade with caution. Always check the higher timeframe before entering, and always use a stop loss. Protect your account.

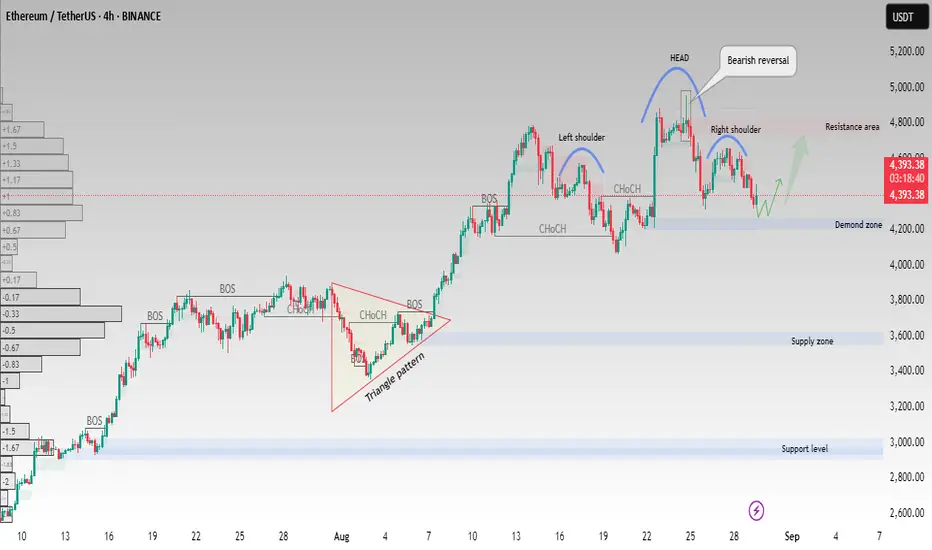
ETH/USDT–Head&Shoulders BearishReversal with DemandZone ReactionEthereum (ETH/USDT) on the 4H timeframe is showing a Head & Shoulders pattern, which often signals a potential bearish reversal after a strong bullish move.
Pattern Observed: Head & Shoulders formation with clear Left Shoulder, Head, and Right Shoulder.
Resistance Area: Around $4,750 – $4,850, aligning with the neckline rejection.
Demand Zone: Current support seen near $4,300 – $4,350. If buyers defend this level, ETH could see a short-term rebound.
Supply Zone: Strong supply below $3,600, in case bearish momentum continues.
Possible Scenarios:
A bounce from the demand zone could push ETH back toward resistance.
A breakdown below support may trigger further downside toward the supply zone.
This setup combines BOS (Break of Structure) and CHoCH (Change of Character) signals, strengthening the bearish case in the short term.
This analysis is for educational purposes only and not financial advice. Always manage your risk before entering any trade.
Short SqueezeShort Squeeze on ETH once it fakes the deviation. Expecting an entry shown as that is prev resis but also will be in the current range. TP: scale out half once ATH is reached then the sky is the limit.


Ethereum Weekly Analysis📊 Ethereum Weekly Analysis
This week, I have analyzed the ETH/USDT chart focusing on key support & resistance levels, market structure, and potential trading zones.
The breakdown includes:
🔹 Weekly trend direction
🔹 Major support & resistance zones
🔹 Key liquidity levels & possible reversal points
🔹 Short & long opportunities based on structure
This analysis is purely educational and based on my personal trading experience. Always manage risk properly and do your own research before trading

Ethereum (ETH): Strong Support Zone Forming Here | BullishETH is showing signs of building momentum here. The EMAs are starting to squeeze closer together, which usually signals that we are gearing up for a strong move.
Price is already holding well above local support, and if we get the expected bounce from this zone, we could see an explosive push higher. The structure is similar to the previous EMA reactions we’ve had, and as long as this dynamic support holds, the upside target at $5,555 remains in play.
Swallow Academy

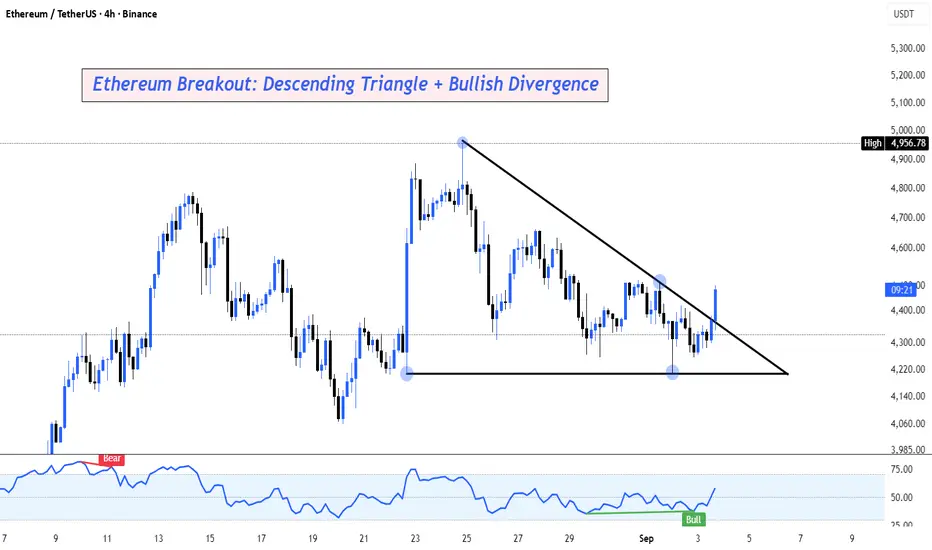
Ethereum / TetherUS – 4H ChartETH has been consolidating inside a descending triangle, with lower highs pressing into horizontal support around $4,200–$4,250.
On this 4H timeframe, price has just broken above the trendline resistance with momentum confirmation from the RSI, showing a bullish divergence.
🔹 Bullish Case:
If ETH holds above the breakout zone, we could see continuation towards $4,480 → $4,600 liquidity pocket.
A sustained move above $4,600 opens the door toward $4,950–$5,000.
🔹 Bearish Invalidation:
If ETH fails to hold above $4,250, a retest of the $4,060 low remains on the table.
This breakout, paired with RSI strength, makes ETH one to watch closely this week.
👉 Do you think bulls can finally reclaim $4,600 and flip structure back to bullish?
Market update for EthereumEthereum’s price has once again approached the key 4,482 level, and I’m closely watching the price action here.
If this level breaks, I expect growth into the 4,800–5,000 area. The current risk level is 4,373 — if it breaks, the situation will need to be reassessed.

ETH/USDT | Hits $4950 ATH After 130% Rally – More Gains Ahead?By analyzing the Ethereum (ETH) chart on the weekly timeframe, we can see that, as expected, price has continued its bullish rally since our last analysis — successfully hitting all three targets at $4000, $4400, and $4900. With a remarkable 130% growth in just 77 days, Ethereum finally printed a new ATH at $4950!
Currently, ETH is trading around $4300, and as long as the price holds above the $3330–$3950 support zone, we can expect another strong bullish wave in the near future.
This analysis will be updated — stay tuned for the next move!
Please support me with your likes and comments to motivate me to share more analysis with you and share your opinion about the possible trend of this chart with me !
Best Regards , Arman Shaban

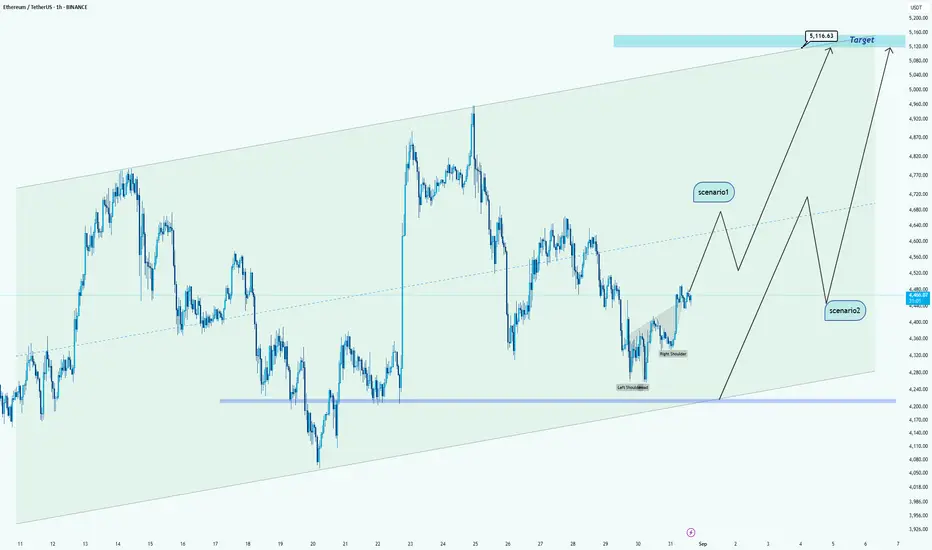
ETH/USDT Analysis -> towards upper levelsHello guys!
Currently, Ethereum is trading inside a clear ascending channel and has just formed a potential inverse head & shoulders pattern near the channel’s support. This setup gives us two possible scenarios:
🔹 Scenario 1:
If ETH continues its bullish momentum and breaks above the mid-line of the channel, we could see a strong push toward $5,116, which is also aligned with the channel’s upper boundary.
🔹 Scenario 2:
If ETH fails to hold above the current levels, we may first see a retracement back toward the $4,200 – $4,250 support zone (channel bottom). From there, the price can gather momentum and still aim for the $5,116 target in the bigger picture.
Conclusion:
Both scenarios point toward a bullish bias in the mid-term. The difference lies in whether we get a direct rally (Scenario 1) or a deeper correction before continuation (Scenario 2).