#ETH is on a mission New ATH#ETH is on a mission to reach its new all-time high (ATH).
First, it may liquidate some long traders, then fill the order blocks of smart buyers before creating a new ATH.
~Namaste~
$ Jai Shree Ram $
ETHUSDT.3L trade ideas

Ethereum at a Critical Resistance Zone – Will $4,800 Hold or Bre📝 Analysis:
Ethereum (ETH/USDT, 4H) is testing a critical resistance zone at $4,700–$4,800, where several technical factors converge:
1. Descending Channel:
Price is touching the upper boundary of the long-term descending channel.
2. Fibonacci Extension:
The recent rally has reached the 1.618 Fibonacci extension (~$4,720), which often acts as a potential reversal zone.
3. Resistance Cluster:
The $4,700–$4,800 area combines both static resistance and the channel top, making it a high-risk region for buyers.
4. Wave Structure:
The strong rally from ~$4,050 could be part of a corrective wave (possibly Wave D). If ETH fails here, we may see a sharp pullback.
⸻
📊 Scenarios:
🔸 Bearish Case (more likely):
Rejection from $4,720–$4,800 could trigger a correction toward:
• First support: $4,580–$4,600
• Key support: $4,100–$4,200
🔸 Bullish Case (conditional):
A daily close above $4,800 would confirm a breakout from the channel, opening the door for targets at:
• $4,950–$5,000
⸻
📌 Conclusion:
ETH is at a make-or-break level. Failure to hold above $4,800 could bring a strong correction, but a confirmed breakout may fuel a run toward $5,000.

ETH/USDT: Bullish Rise to 4770?As the previous analysis worked exactly as predicted, BINANCE:ETHUSDT is gearing up for a bullish move on the 4-hour chart , with an entry zone between 4350-4395 near a key support and trendline.
The target range of 4735-4770 aligns with the next resistance, signaling strong upside potential. Set a stop loss on a close below 4228 to manage risk effectively. Watch BTC trends! 💡
📝 Trade Plan:
✅ Entry Zone: 4350 – 4395 (support + trendline area)
❌ Stop Loss: Daily close below 4228 to manage risk
🎯 Target Zone: 4735 – 4770 (next resistance level)
Ready for this lift-off? Drop your take below! 👇

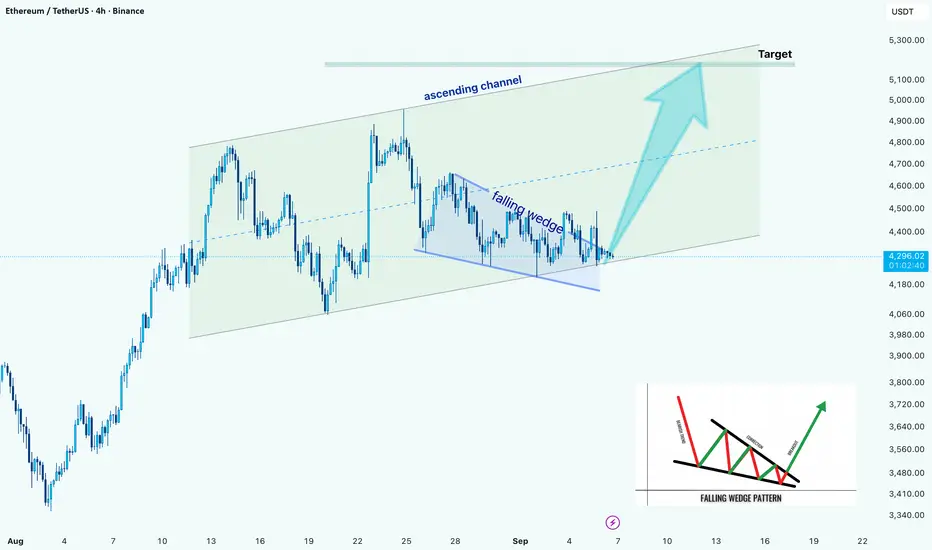
ETH/USD –> Falling Wedge Breakout Within Ascending ChannelHello guys!
Ethereum is showing a strong technical setup on the 4H chart. Price has been respecting an ascending channel since early August, and within this structure, a falling wedge has recently formed.
Right now, ETH is testing the wedge breakout point near the bottom line of the channel. If buyers manage to hold momentum here, we could see price extending toward the channel’s upper boundary, with the next major target sitting around $5,100 – $5,300.
On the downside, failure to sustain above the wedge support may lead to a retest of the lower channel trendline around $4,100 – $4,150, which remains a critical support area for bulls to defend.
ETHUSDT – The “BIG” Wave Is Coming ?Hello everyone, glad to see you again as we dive into BINANCE:ETHUSDT !
Today, Ethereum continues to show strong accumulation as it consolidates tightly around the 4,200 USDT support zone. This area is being strongly defended and also aligns with key retracement levels on higher timeframes, suggesting that the bulls are far from giving up.
At the moment, ETH is in a “compressed spring” state – the longer it moves sideways, the stronger the breakout potential. If the support holds, we could see a powerful bullish wave emerge, with the potential to test resistance and even break higher. Smart traders know: accumulation equals opportunity!
What about you – do you think ETH will break through or bounce back from the 4,800 USDT resistance? Share your thoughts in the comments below!

Volatility Period: Around September 18th (September 17th-19th)
Hello, fellow traders!
Follow us to get the latest information quickly.
Have a great day!
-------------------------------------
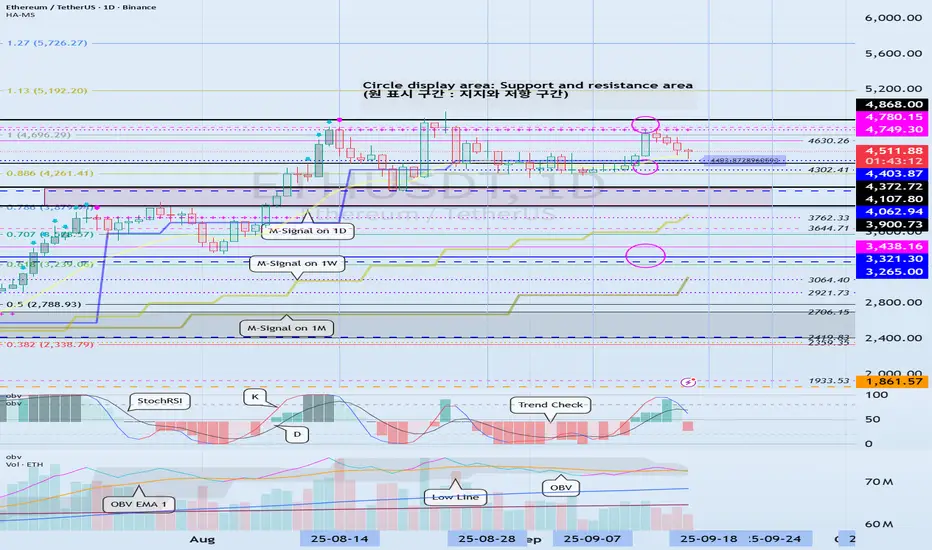
(ETHUSDT 1D Chart)
The 4403.87-4749.30 range, which is the HA-High ~ DOM (60) range, represents a resistance zone.
Therefore, we need to monitor the price movement after the current volatility period, around September 18 (September 17-19).
To sustain the uptrend, the price must remain above the 3900.73-4107.80 range.
From a medium- to long-term perspective, the 3265.0-3321.30 range is a key area.
Considering the above, if it falls below 4403.87,
1st: 4107.80-4372.72
2nd: 3265.0-3321.30
Therefore, it is likely to fall to the first and second levels above.
Therefore, the key question is whether it can find support near 4403.87 after this period of volatility.
-
When trading, it's important to understand the current price level.
I believe there are several ways to determine this.
My basic trading strategy is to determine when to trade.
My basic trading strategy is to buy when support is found in the DOM(-60) ~ HA-Low range and rise, and to sell when it touches the HA-High ~ DOM(60) range.
However, if the price rises in the HA-High ~ DOM(60) range, a step-like upward trend is likely, while if it falls in the DOM(-60) ~ HA-Low range, a step-like downward trend is likely.
Therefore, the basic trading strategy should be a segmented trading strategy.
If you were unable to buy in the DOM(-60) ~ HA-Low range, but the current price is within the DOM(-60) ~ HA-Low range, you should check for support.
Support is determined by checking whether support is found near the HA-Low or DOM(60) indicators.
If you bought when support was found near the HA-Low indicator, the first sell position would be near the DOM(60) indicator.
If you bought when support was found near the DOM(60) indicator, you should execute the trade quickly and effectively.
If the price falls below the purchase price, it would be considered a buy at the high.
To prevent this to some extent, we've utilized several indicators for verification.
First, we utilize the M-Signal indicator on the 1M, 1W, and 1D charts.
That is, if the M-Signal indicator is passing near important support and resistance levels, the presence of support in that area is likely to play a more important role.
Currently, the M-Signal indicator on the 1D chart is passing near 4403.87, so we should consider the area around 4403.87 as a potential important support and resistance level.
Second, we should monitor the movements of auxiliary indicators such as the TC (Trend Check) indicator, the StochRSI indicator, and the On-By-Signal (OBV) indicator.
For the price to continue its upward trend in this important support area,
- the StochRSI indicator must show an upward trend. If possible, it's best to avoid entering the overbought zone.
- The OBV indicator should be showing an upward trend. If possible, it should remain above the High Line.
- The TC (Trend Check) indicator should be showing an upward trend. If possible, it should remain above the 0 level.
By monitoring the movements of the three indicators above, you can determine whether there is support near important support and resistance levels.
However, you should not blindly trust the movements of auxiliary indicators. Even if you have identified the movements of auxiliary indicators, you should always monitor the price movement.
To determine support, you should monitor the price movement for at least 1-3 days.
This is especially important during periods of volatility.
Volatility is a period where you cannot predict the direction of movement, so extra caution is required.
Therefore, if possible, it's better to observe the situation and find a trading opportunity after the volatility period has passed rather than entering a new trade during a volatile period.
-
Thank you for reading to the end. I wish you successful trading.
--------------------------------------------------
- Here's an explanation of the big picture.
(3-year bull market, 1-year bear market pattern)
I'll explain more in detail when the bear market begins.
------------------------------------------------------
Ethereum (ETH): About To Explode | Very BullishGameplan remains the same, we wait for a break of the local high. Buyers keep the momentum, and once that breakout happens, we look for a strong move to the upside. First target sits at $7K, with $9K as the major one.
Swallow Academy

ETHUSDT.PHello friends
Given the good growth we had, the price has made a 14% correction. If the specified support is maintained, the price can see the specified targets. If the support is broken, the price can fall by another step. We have identified important support points for you.
*Trade safely with us*

ETHUSDT → Correction and hunt for liquidity ahead of growth BINANCE:ETHUSD is showing positive dynamics and breaking through the resistance conglomerate (consolidation boundary and downward correction line). The fundamental background is positive, and bulls are generally quite confident...
The cryptocurrency market, Bitcoin, and altcoins are awaiting a batch of positive news. Traders are waiting for interest rates to fall, which could attract additional capital to the cryptocurrency market, especially ETH.
The breakout of the correction resistance and consolidation resistance gives the market hope for growth. The global trend is bullish, and the fundamental background is positive. If the bulls hold their defense above 4488-4450, ETH may strengthen.
Resistance levels: 4661, 4783
Support levels: 4488, 4450
Technically, I expect a false breakdown of support (retest of the liquidity zone). If this maneuver ends with the price closing above 4488 and the formation of a confirming bullish pattern, then in this case, we can consider the continuation of growth.
Sincerely, R. Linda!


ETHEREUM ETHUSDT ,WE are watching the price action for next possible trade direction. The right direction is to allow the weekly time frame form a double top and aim the break of the neckline and sell down.
break above will be open for long position.
trading is probability
RISK MANAGEMENT IS KEY.
#ETHUSDT #ETHEREUM.

ETH/USDTI think wave B is in the form of a completed triangle for wave C, so I will open a short position with this setup.

ETHUSDT Long Trade SetupETHUSDT is showing bullish divergence at LLs, to make sure that divergence is effective we will take long entry at LH breakout, follow the below trade Plan
Trend: Bearish
Divergance: Bullish
Bias: Neutral
Scenario: Make Entry at LH breakout
Trade Plan
Stop Loss :4400
Entry Level: 4562
TP1: 4724

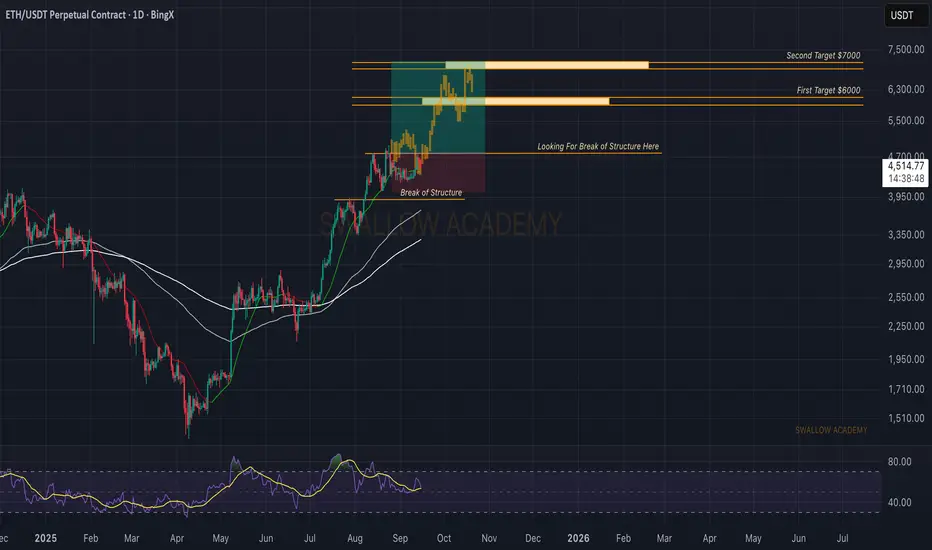
Ethereum (ETH): Looking For That Break of Structure | Bullish AFETH is still waiting for that break of structure, and once it happens we are going to be looking for a push into new ATH levels. Monday came with a bloody move, but for now it looks nothing more than a shakeout before buyers step back in and take control.
Swallow Academy
THIS IS WHAT I DID TODAY WITH ETH Opened a long position in ETH at 4,468 with a 2% stop around 4,378 and a 4% take profit target near 4,648, yielding a 2:1 risk-reward ratio. Entry is based on a bullish divergence pattern at the lower boundary of the range, further supported by a retracement to the 38.2% Fibonacci level of the last bullish impulse.
PD:Monitoring tomorrow’s news.

ETHUSD Long Trade BITSTAMP:ETHUSD Long Trade
Entry: 4270 - 4335
TP-1: 4390
TP-2: 4580
This is good trade.
Don't overload your risk like Greedy gambler!!!
Be Disciplined Trader, risk what you can afford.
Use proper risk management.
Disclaimer: Trading is risky, only idea, not advice.


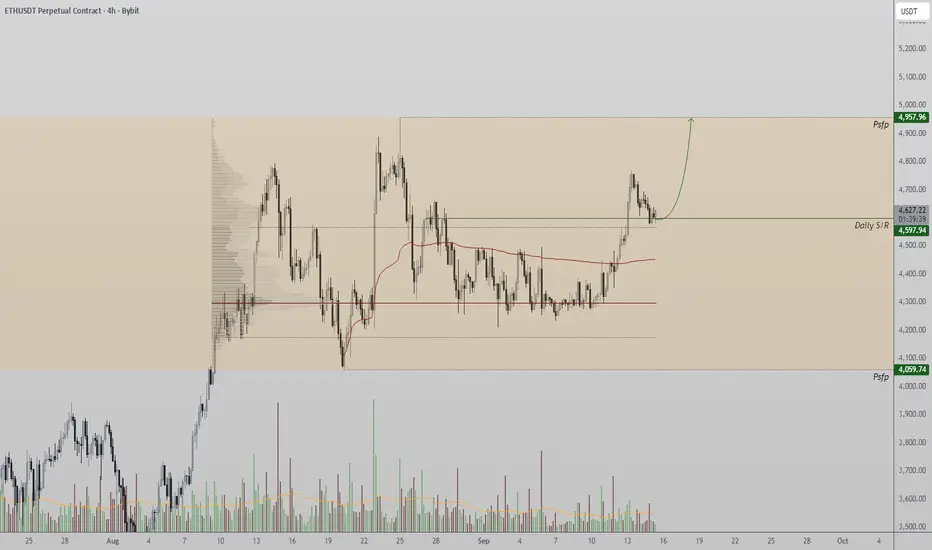
Ethereum Retests Support and Eyes Higher ObjectivesETH price action has recently pivoted from key daily support, maintaining the broader uptrend. With structure intact and value area high reclaimed, buyers continue to show dominance.
Key Technical Points:
- Daily support at $4,600 has held.
- Value area high reclaimed as support.
- Potential upside target sits at $4,950.
The $4,600 level has proven to be a crucial foundation for Ethereum. After multiple tests, this region continues to hold as buyers defend it, creating conditions for a push higher. The bounce coincided with a reclaim of the value area high of the current range, a technical signal that suggests acceptance above prior supply.
Price structure remains bullish, with ETH printing consecutive higher highs and higher lows. This reflects healthy market dynamics and increasing demand. Importantly, each consolidation has been absorbed efficiently, leaving ETH primed for continuation.
If momentum persists, the $4,950 level is the next logical target. This region represents not just a technical objective but also an area where previous sellers might attempt to defend.
What to Expect in the Coming Price Action:
As long as ETH trades above $4,600, buyers retain control. Continuation toward $4,950 remains probable, with invalidation only if $4,600 breaks on strong volume.

#ETHUSDT 4H ChartPrice is still consolidating on lower timeframes showing no major changes. MACD is showing bearish weakness, RSI is neutral and EMAs are slighly bullish. We may expect price to trade deeper into the 4h demand zone at $4,400 before potentially moving up again towards our minor supply at $4,710.

Rise of Emerging Market Economies1. Defining Emerging Market Economies
The term “emerging market” was popularized in the 1980s by Antoine van Agtmael of the International Finance Corporation (IFC). It referred to economies that were transitioning from developing status toward greater industrialization, integration with global markets, and higher living standards.
Key characteristics of emerging market economies include:
Rapid GDP growth compared to developed nations.
Industrialization and urbanization, with a shift from agriculture to manufacturing and services.
Integration into global trade and finance, often as export powerhouses.
Rising middle classes with growing purchasing power.
Institutional reforms such as liberalization, privatization, and market-oriented policies.
Volatility and vulnerability, due to weaker institutions, dependence on foreign capital, or commodity price cycles.
Organizations such as MSCI, IMF, and World Bank classify emerging markets differently, but the major ones usually include China, India, Brazil, Russia, Mexico, Indonesia, South Korea, Turkey, Saudi Arabia, South Africa, and Poland.
2. Historical Background: The Shift from West to East and South
The rise of EMEs must be understood against the backdrop of post-World War II economic history.
1945–1970: Developed World Dominance
The U.S., Western Europe, and Japan led global production.
Developing nations remained primarily commodity exporters.
1970s–1980s: Debt Crisis and Structural Adjustment
Many developing countries borrowed heavily during oil booms.
The 1980s debt crisis (Latin America, Africa) forced IMF-led structural reforms.
1990s: Liberalization and Global Integration
Collapse of the Soviet Union opened up Eastern Europe.
India liberalized its economy in 1991.
China deepened reforms under Deng Xiaoping, creating Special Economic Zones.
Capital markets opened up, allowing global investors to access EMEs.
2000s: The Emerging Market Boom
China’s WTO entry (2001) accelerated global trade.
Commodity supercycle (oil, metals, agricultural products) fueled growth in Brazil, Russia, South Africa, and Middle Eastern economies.
The acronym BRIC (Brazil, Russia, India, China) gained global attention.
2010s–Present: Consolidation and Diversification
China became the world’s second-largest economy.
India emerged as a digital and service hub.
EMEs accounted for two-thirds of global growth post-2008 financial crisis.
New clusters such as MINT (Mexico, Indonesia, Nigeria, Turkey) and Next Eleven gained traction.
3. Drivers Behind the Rise of Emerging Market Economies
3.1 Demographics and Labor Force Advantage
EMEs often have younger populations compared to aging developed nations.
India’s median age (28) contrasts with Europe (43) or Japan (49).
Large, affordable workforces attracted global manufacturing.
3.2 Market Reforms and Liberalization
Privatization of state enterprises.
Reduction in trade barriers and tariffs.
Adoption of free-market policies encouraged FDI.
3.3 Globalization and Technology
Outsourcing, offshoring, and global value chains benefited EMEs.
ICT revolution allowed countries like India to export software services.
Internet penetration spurred innovation in fintech, e-commerce, and mobile banking.
3.4 Commodity and Resource Wealth
Oil exporters (Saudi Arabia, Russia, Nigeria) enjoyed windfalls during price booms.
Brazil and South Africa leveraged agricultural and mineral resources.
3.5 Rising Middle Class and Domestic Consumption
EMEs are not just export hubs; they are huge consumer markets.
China’s middle class (over 400 million people) drives global demand for cars, electronics, and luxury goods.
3.6 Strategic Government Policies
Industrial policies, subsidies, and infrastructure development.
China’s “Made in China 2025” and India’s “Make in India” exemplify targeted growth.
4. Emerging Markets in Global Trade
Emerging markets have transformed global trade patterns.
China is the world’s largest exporter, dominating electronics, machinery, and textiles.
India has become a service export leader in IT, pharmaceuticals, and business outsourcing.
Brazil exports soybeans, iron ore, and beef to global markets.
Vietnam and Bangladesh are leading textile exporters.
Global Supply Chains:
EMEs play a critical role in global value chains. For example, iPhones are designed in the U.S. but assembled in China using parts from multiple EMEs.
Regional Trade Blocs:
ASEAN, MERCOSUR, African Continental Free Trade Area (AfCFTA) are integrating EMEs into powerful trading networks.
5. Emerging Markets in Global Finance
EMEs attract foreign direct investment (FDI) for infrastructure and manufacturing.
Their stock markets, like Shanghai, Mumbai, São Paulo, and Johannesburg, are increasingly important for global investors.
Sovereign wealth funds from EMEs (e.g., Saudi Arabia’s PIF, Singapore’s GIC) are influential global investors.
EMEs have also become sources of outward FDI. Chinese firms, for example, are acquiring companies worldwide.
Challenges:
Vulnerability to capital flight during global crises.
Currency volatility (e.g., Turkish lira, Argentine peso).
Reliance on external financing makes them sensitive to U.S. Federal Reserve interest rate hikes.
6. Challenges Facing Emerging Market Economies
Despite rapid growth, EMEs face structural and cyclical challenges:
Inequality and Poverty
Growth often uneven, creating income gaps.
Dependence on Commodities
Resource-dependent economies suffer during price crashes.
Political and Institutional Weaknesses
Corruption, weak rule of law, and unstable governance reduce investor confidence.
External Vulnerabilities
Dependence on foreign capital and exposure to global shocks (2008 crisis, COVID-19).
Debt Burden
Rising sovereign and corporate debt, especially in Africa and Latin America.
Environmental Pressures
Rapid industrialization leads to pollution, deforestation, and climate risks.
7. Geopolitical Implications
The rise of EMEs has reshaped global geopolitics:
Shift of Power Eastward: China challenges U.S. economic dominance.
New Institutions: BRICS Bank (New Development Bank), Asian Infrastructure Investment Bank (AIIB) provide alternatives to IMF/World Bank.
South–South Cooperation: Trade and investment flows among EMEs (China–Africa, India–ASEAN).
Geopolitical Rivalries: U.S.–China trade war, Russia–West conflicts.
8. Future Outlook
The future of emerging markets will be shaped by several trends:
Digital Transformation: AI, fintech, e-commerce, and Industry 4.0.
Green Growth: Transition to renewables and sustainable models.
Multipolar World Order: EMEs will demand greater voice in institutions like IMF, WTO, UN.
Resilient Supply Chains: Diversification away from China benefits India, Vietnam, and Mexico.
Urbanization: More mega-cities, infrastructure needs, and consumer demand.
If EMEs can overcome inequality, governance, and sustainability challenges, they will be the central drivers of the 21st-century global economy.
Conclusion
The rise of emerging market economies marks one of the most significant shifts in modern economic history. From being marginalized as poor, unstable, or commodity-dependent nations, they have emerged as engines of global growth, innovation, and consumption. Their contribution to global GDP, trade, and finance has redefined economic geography.
Yet, the journey is complex. EMEs remain vulnerable to external shocks, political instability, and environmental challenges. The next phase of their growth will depend on inclusive policies, sustainable development, technological adoption, and institutional strength.
As the world moves toward a multipolar order, emerging markets are no longer just “catching up”; they are shaping the rules, institutions, and direction of the global economy. Their rise is not only an economic story — it is a story of ambition, resilience, and transformation that will define the future of globalization.

ETHUSDTThis looks like a strong buying opportunity since the price has formed a reliable support base. The consistent bounce from this level reflects growing market confidence, making it a favorable entry point with a clear foundation for potential upside momentum.

The Fed Meeting and Its Further Play in EthereumCRYPTOCAP:ETH has returned to the trendline. Even if there another short-term drop, thats just part of the futures game - it can't happen without it.
Ahead of the Fed meeting, the market will likely move upward, so that no one can buy cheap after a positive decision on lowering the key rate.
Looking at the recent candles, enough longs have been closed to allow growth without abuse.
Funding across all exchanges has stabilized.
CRYPTOCAP:ETH outflows are starting to exceed inflows.
There nothing to look for down below - everything points to growth.
If it’s not too much trouble, support the post. Wishing you all the best!
