Rise of Emerging Market Economies1. Defining Emerging Market Economies
The term “emerging market” was popularized in the 1980s by Antoine van Agtmael of the International Finance Corporation (IFC). It referred to economies that were transitioning from developing status toward greater industrialization, integration with global markets, and higher living standards.
Key characteristics of emerging market economies include:
Rapid GDP growth compared to developed nations.
Industrialization and urbanization, with a shift from agriculture to manufacturing and services.
Integration into global trade and finance, often as export powerhouses.
Rising middle classes with growing purchasing power.
Institutional reforms such as liberalization, privatization, and market-oriented policies.
Volatility and vulnerability, due to weaker institutions, dependence on foreign capital, or commodity price cycles.
Organizations such as MSCI, IMF, and World Bank classify emerging markets differently, but the major ones usually include China, India, Brazil, Russia, Mexico, Indonesia, South Korea, Turkey, Saudi Arabia, South Africa, and Poland.
2. Historical Background: The Shift from West to East and South
The rise of EMEs must be understood against the backdrop of post-World War II economic history.
1945–1970: Developed World Dominance
The U.S., Western Europe, and Japan led global production.
Developing nations remained primarily commodity exporters.
1970s–1980s: Debt Crisis and Structural Adjustment
Many developing countries borrowed heavily during oil booms.
The 1980s debt crisis (Latin America, Africa) forced IMF-led structural reforms.
1990s: Liberalization and Global Integration
Collapse of the Soviet Union opened up Eastern Europe.
India liberalized its economy in 1991.
China deepened reforms under Deng Xiaoping, creating Special Economic Zones.
Capital markets opened up, allowing global investors to access EMEs.
2000s: The Emerging Market Boom
China’s WTO entry (2001) accelerated global trade.
Commodity supercycle (oil, metals, agricultural products) fueled growth in Brazil, Russia, South Africa, and Middle Eastern economies.
The acronym BRIC (Brazil, Russia, India, China) gained global attention.
2010s–Present: Consolidation and Diversification
China became the world’s second-largest economy.
India emerged as a digital and service hub.
EMEs accounted for two-thirds of global growth post-2008 financial crisis.
New clusters such as MINT (Mexico, Indonesia, Nigeria, Turkey) and Next Eleven gained traction.
3. Drivers Behind the Rise of Emerging Market Economies
3.1 Demographics and Labor Force Advantage
EMEs often have younger populations compared to aging developed nations.
India’s median age (28) contrasts with Europe (43) or Japan (49).
Large, affordable workforces attracted global manufacturing.
3.2 Market Reforms and Liberalization
Privatization of state enterprises.
Reduction in trade barriers and tariffs.
Adoption of free-market policies encouraged FDI.
3.3 Globalization and Technology
Outsourcing, offshoring, and global value chains benefited EMEs.
ICT revolution allowed countries like India to export software services.
Internet penetration spurred innovation in fintech, e-commerce, and mobile banking.
3.4 Commodity and Resource Wealth
Oil exporters (Saudi Arabia, Russia, Nigeria) enjoyed windfalls during price booms.
Brazil and South Africa leveraged agricultural and mineral resources.
3.5 Rising Middle Class and Domestic Consumption
EMEs are not just export hubs; they are huge consumer markets.
China’s middle class (over 400 million people) drives global demand for cars, electronics, and luxury goods.
3.6 Strategic Government Policies
Industrial policies, subsidies, and infrastructure development.
China’s “Made in China 2025” and India’s “Make in India” exemplify targeted growth.
4. Emerging Markets in Global Trade
Emerging markets have transformed global trade patterns.
China is the world’s largest exporter, dominating electronics, machinery, and textiles.
India has become a service export leader in IT, pharmaceuticals, and business outsourcing.
Brazil exports soybeans, iron ore, and beef to global markets.
Vietnam and Bangladesh are leading textile exporters.
Global Supply Chains:
EMEs play a critical role in global value chains. For example, iPhones are designed in the U.S. but assembled in China using parts from multiple EMEs.
Regional Trade Blocs:
ASEAN, MERCOSUR, African Continental Free Trade Area (AfCFTA) are integrating EMEs into powerful trading networks.
5. Emerging Markets in Global Finance
EMEs attract foreign direct investment (FDI) for infrastructure and manufacturing.
Their stock markets, like Shanghai, Mumbai, São Paulo, and Johannesburg, are increasingly important for global investors.
Sovereign wealth funds from EMEs (e.g., Saudi Arabia’s PIF, Singapore’s GIC) are influential global investors.
EMEs have also become sources of outward FDI. Chinese firms, for example, are acquiring companies worldwide.
Challenges:
Vulnerability to capital flight during global crises.
Currency volatility (e.g., Turkish lira, Argentine peso).
Reliance on external financing makes them sensitive to U.S. Federal Reserve interest rate hikes.
6. Challenges Facing Emerging Market Economies
Despite rapid growth, EMEs face structural and cyclical challenges:
Inequality and Poverty
Growth often uneven, creating income gaps.
Dependence on Commodities
Resource-dependent economies suffer during price crashes.
Political and Institutional Weaknesses
Corruption, weak rule of law, and unstable governance reduce investor confidence.
External Vulnerabilities
Dependence on foreign capital and exposure to global shocks (2008 crisis, COVID-19).
Debt Burden
Rising sovereign and corporate debt, especially in Africa and Latin America.
Environmental Pressures
Rapid industrialization leads to pollution, deforestation, and climate risks.
7. Geopolitical Implications
The rise of EMEs has reshaped global geopolitics:
Shift of Power Eastward: China challenges U.S. economic dominance.
New Institutions: BRICS Bank (New Development Bank), Asian Infrastructure Investment Bank (AIIB) provide alternatives to IMF/World Bank.
South–South Cooperation: Trade and investment flows among EMEs (China–Africa, India–ASEAN).
Geopolitical Rivalries: U.S.–China trade war, Russia–West conflicts.
8. Future Outlook
The future of emerging markets will be shaped by several trends:
Digital Transformation: AI, fintech, e-commerce, and Industry 4.0.
Green Growth: Transition to renewables and sustainable models.
Multipolar World Order: EMEs will demand greater voice in institutions like IMF, WTO, UN.
Resilient Supply Chains: Diversification away from China benefits India, Vietnam, and Mexico.
Urbanization: More mega-cities, infrastructure needs, and consumer demand.
If EMEs can overcome inequality, governance, and sustainability challenges, they will be the central drivers of the 21st-century global economy.
Conclusion
The rise of emerging market economies marks one of the most significant shifts in modern economic history. From being marginalized as poor, unstable, or commodity-dependent nations, they have emerged as engines of global growth, innovation, and consumption. Their contribution to global GDP, trade, and finance has redefined economic geography.
Yet, the journey is complex. EMEs remain vulnerable to external shocks, political instability, and environmental challenges. The next phase of their growth will depend on inclusive policies, sustainable development, technological adoption, and institutional strength.
As the world moves toward a multipolar order, emerging markets are no longer just “catching up”; they are shaping the rules, institutions, and direction of the global economy. Their rise is not only an economic story — it is a story of ambition, resilience, and transformation that will define the future of globalization.
ETHUSDT.3L trade ideas

ETHUSDTThis looks like a strong buying opportunity since the price has formed a reliable support base. The consistent bounce from this level reflects growing market confidence, making it a favorable entry point with a clear foundation for potential upside momentum.

THIS IS WHAT I DID TODAY WITH ETH Opened a long position in ETH at 4,468 with a 2% stop around 4,378 and a 4% take profit target near 4,648, yielding a 2:1 risk-reward ratio. Entry is based on a bullish divergence pattern at the lower boundary of the range, further supported by a retracement to the 38.2% Fibonacci level of the last bullish impulse.
PD:Monitoring tomorrow’s news.

The Fed Meeting and Its Further Play in EthereumCRYPTOCAP:ETH has returned to the trendline. Even if there another short-term drop, thats just part of the futures game - it can't happen without it.
Ahead of the Fed meeting, the market will likely move upward, so that no one can buy cheap after a positive decision on lowering the key rate.
Looking at the recent candles, enough longs have been closed to allow growth without abuse.
Funding across all exchanges has stabilized.
CRYPTOCAP:ETH outflows are starting to exceed inflows.
There nothing to look for down below - everything points to growth.
If it’s not too much trouble, support the post. Wishing you all the best!

Ethereum analysisEthereum’s behavior today was quite unusual — while Bitcoin was bullish, Ethereum was bearish. However, there is still a strong possibility that the price will reach the bottom of the channel, and after that, we’ll need to analyze again whether it will return inside the channel or get rejected. ✅


Ethereum (ETH): Price Back Near Entry | Still Bullish!!ETH pulled back into the EMA zone after the last push, but so far price is holding well. Buyers have defended this area multiple times in the past, so as long as we stay above here momentum can kick back in. Target remains $5,555, we just need continuation from this zone.
Swallow Academy

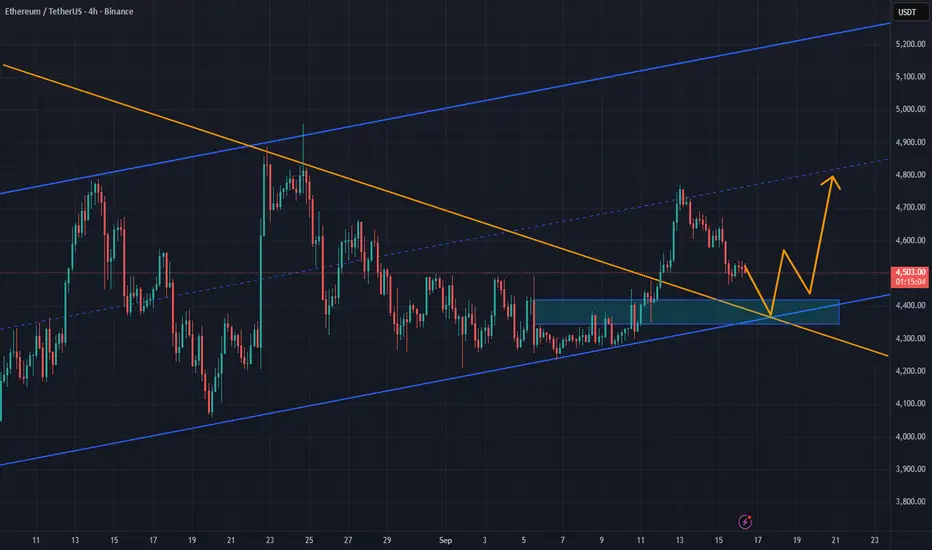
ETH/USDT: Bullish Structure Intact Above Key Support ZoneETH/USDT is trading above the 4,400 support level after rebounding from the upward trendline, showing resilience despite recent pullbacks. The market has broken out of a falling wedge pattern and is forming higher lows, indicating accumulation and potential for further upside.
If buyers defend the 4,390 area, momentum could carry the price toward the 4,750 level, with a possible retest of the broader 5,000 resistance zone. As long as Ethereum stays above trendline support, the bullish outlook remains in play.
#ETHUSDT 4H ChartPrice had tapped into our POI and bounced as predicted however it is currently consolidating. MACD is showing bearish weakness, RSI is sold and EMAs are slightly bullish. Price might trade deeper into the 4h demand zone at $4,400 before potentially continuing its bullish movements.

ETH: The Power of Structure On September 8, I opened a long on the 4-hour chart at $4371, using 10x leverage. The move turned out strong: price reached $4767, and along the way four profit-taking levels were secured. Nearly $400 difference per coin — that was the maximum the trade offered, and the result was fully captured.
The key here was not prediction but a systematic approach. Levels were outlined in advance, and the trade unfolded step by step according to plan. This removed chaos and allowed me to hold the position calmly, without emotional pressure.
When the structure is clear, decisions come easier: where to take partial profit, where to hold, where to keep composure. Even when trading with leverage, risk remains manageable, and actions are driven by logic rather than reaction.
The market will always remain unpredictable. But discipline and structure turn every move into part of a strategy, where results are defined by consistency rather than chance.

ETH Go to the $5050 SOONHello,
Are you ready to ETH $5050
As soon as possible this price.
If price touch $4706 again $5050 is availble.
Thank you

Key support at 4500Ethereum also dropped as the Forex market opened and managed to break out of the range. It has now reached a key support level, and there’s a possibility that it could bounce from this support and return back into the range. ✅

ETH *UPDATE*Hello friends
Given the channel breakdown and the entry of buyers, it now seems that the price is in a pullback. In this case, the price pivots of the channel, which are now becoming supported, are expected to be good support and cause the price to grow and move with it to the specified targets.
*Trade safely with us*

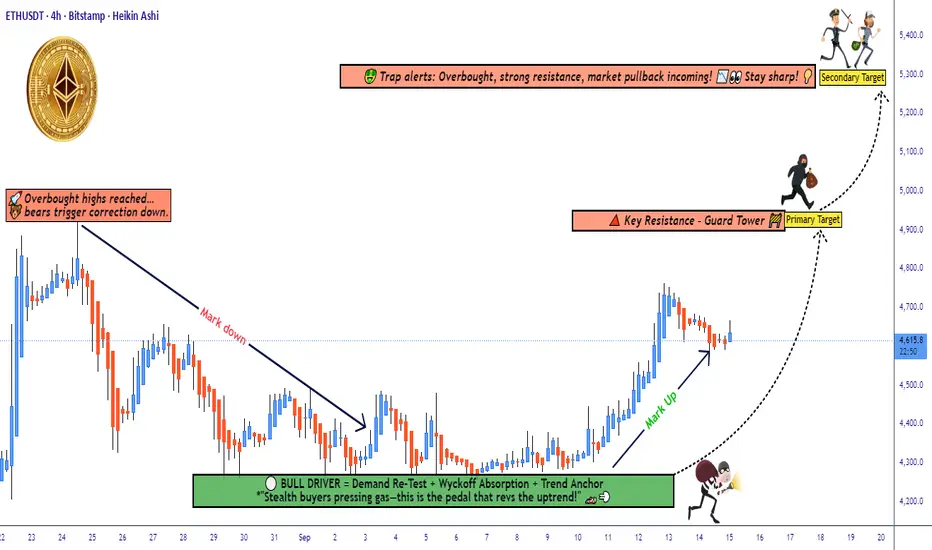
ETH/USDT Technical Outlook: Demand Layer Entries vs Trap Risk🚀 ETH/USDT | Ethereum vs Tether 💎
Crypto Market Money Looting Plan (Swing/Day Trade)
📌 Trade Plan (Bullish Outlook)
Setup: Demand Re-Test ✅ + Wyckoff Absorption 🔑 + Trend Anchor ⚓ (buyers confirmed presence)
Entry Style (Thief Layers 🪙): Using layered limit entries — examples: 4500, 4550, 4600, 4650 (you can add more layers as per your own method).
Stop-Loss (Protect the Vault 🔒): Example zone near 4400 after breakout. Adjust SL to fit your own risk appetite & personal strategy.
Target 🎯:
🎯 Primary: 4900 (local resistance)
🎯 Secondary: 5300 (major resistance / overbought zone)
🧾 Notes for Thief OG’s
This plan is not financial advice, only an idea. Always manage your own entries, SL, and TP.
Think of it as a vault strategy: take money, then protect money.
🔗 Related Pairs to Watch
BINANCE:BTCUSDT → ETH often follows BTC’s momentum. A BTC breakout/false move can affect ETH.
BINANCE:ETHBTC → Good pair to confirm ETH’s relative strength vs BTC.
BINANCE:SOLUSDT & BINANCE:BNBUSDT → Correlated majors; watch for rotation of capital in altcoins.
✨ “If you find value in my analysis, a 👍 and 🚀 boost is much appreciated — it helps me share more setups with the community!”
#ETH #Ethereum #Crypto #USDT #Altcoins #SwingTrade #DayTrading #LayerStrategy #Wyckoff #ThiefPlan #TradingView #CryptoTrading
#ETH is on a mission New ATH#ETH is on a mission to reach its new all-time high (ATH).
First, it may liquidate some long traders, then fill the order blocks of smart buyers before creating a new ATH.
~Namaste~
$ Jai Shree Ram $


ETH/USDTI’m watching for a potential correction into the 4300–4400 zone.
📈 Bullish Scenario (Preferred):
If price corrects into 4300–4400, I’ll look for confirmation signals to enter long.
Upside targets: 5000–5200.
✅ Plan: No longs without confirmation.

Ethereum analysisThere’s no doubt that Ethereum is in an uptrend, and right now the price is moving along a trendline on the higher timeframe. In these conditions — since Ethereum usually has good bullish momentum — my preference is for long positions. If the price continues this uptrend, we can see a triangle pattern forming, which by nature is bullish, and if activated, the price could move higher.
The higher timeframe trendline that the price is currently moving on may get broken with a fakeout, after which the price could return back above the trendline.
This analysis will be invalidated only if the higher timeframe trendline gets broken and the breakout is confirmed. ✅

ETHUSD Long Trade BITSTAMP:ETHUSD Long Trade
Entry: 4270 - 4335
TP-1: 4390
TP-2: 4580
This is good trade.
Don't overload your risk like Greedy gambler!!!
Be Disciplined Trader, risk what you can afford.
Use proper risk management.
Disclaimer: Trading is risky, only idea, not advice.

Ethereum to move to make this cup and handle completePossible next Ethereum move, Ethereum may retrace to 4500 level to complete the Cup and handle formation and then giga send to 5500 and beyond.
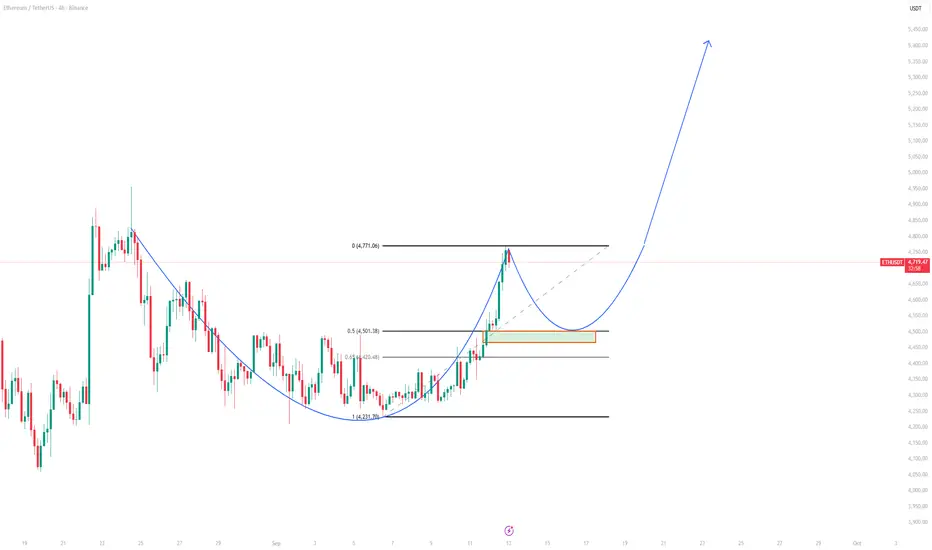
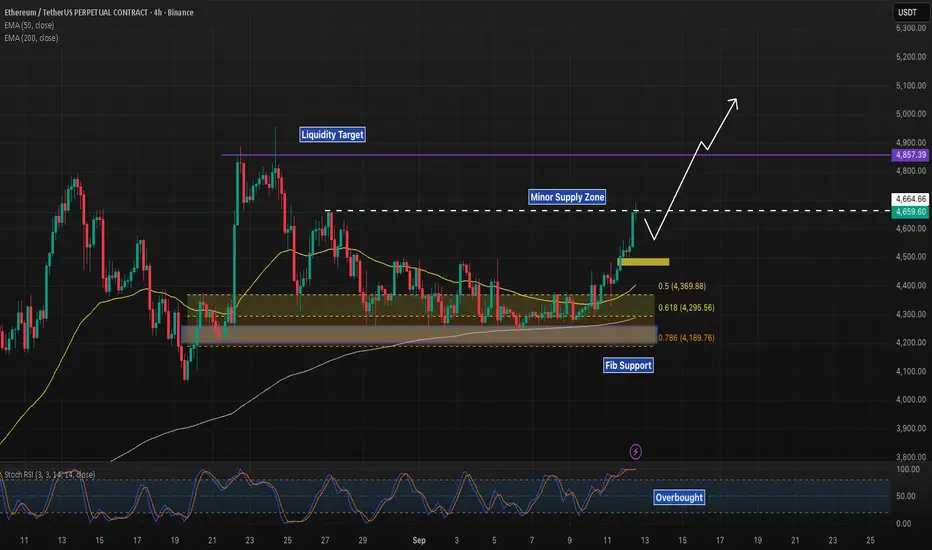
ETH 4H – Breakout Retest, Eyes on $4,857 LiquidityEthereum broke out above $4,500 and is now retesting the breakout zone while holding above both EMAs ($4,288–4,402). The move has built on strength from the Fib cluster, where ETH defended the 0.5 retrace at $4,369 and the golden pocket at $4,295.
Upside:
As long as ETH holds $4,500, the next liquidity target sits at $4,857.
Downside:
Losing $4,500 re-opens the Fib cluster ($4,369–4,189), with $4,189 as the last major support.
Stoch RSI is overbought, hinting at short-term cooling, but structure favors continuation while ETH trades above $4,500.
📊 Key focus: Can ETH turn $4,500 into support for continuation toward $4,857, or does it retest deeper into the Fib base first?
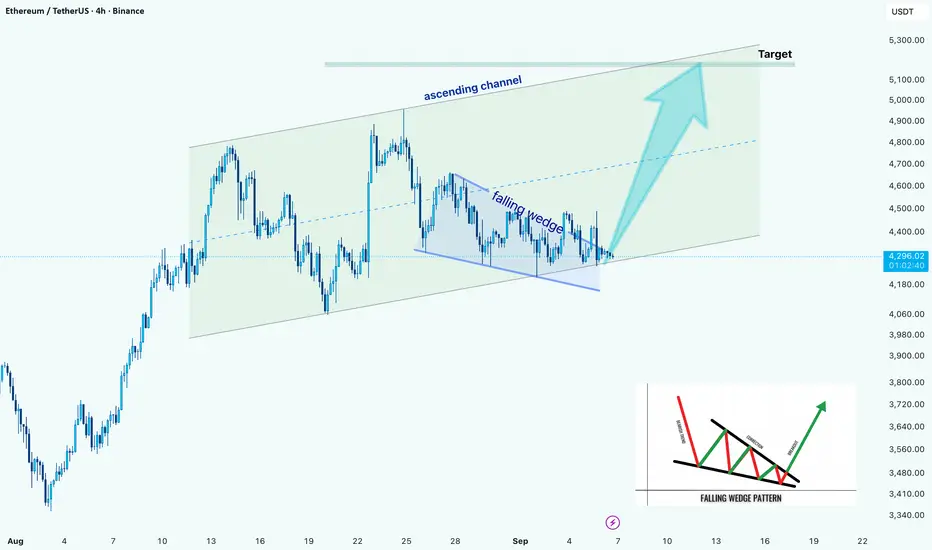
ETH/USD –> Falling Wedge Breakout Within Ascending ChannelHello guys!
Ethereum is showing a strong technical setup on the 4H chart. Price has been respecting an ascending channel since early August, and within this structure, a falling wedge has recently formed.
Right now, ETH is testing the wedge breakout point near the bottom line of the channel. If buyers manage to hold momentum here, we could see price extending toward the channel’s upper boundary, with the next major target sitting around $5,100 – $5,300.
On the downside, failure to sustain above the wedge support may lead to a retest of the lower channel trendline around $4,100 – $4,150, which remains a critical support area for bulls to defend.