Weekly Insights EUR USD AUD NZD BTC ETH (22nd-25th septemer2025)Get ready for the week ahead — in this video we break down the technical outlook and key levels for major currencies and markets including EUR/USD, AUD, NZD, as well as S&P 500 and Bitcoin (BTC). We analyze recent price action, highlight important support & resistance zones, and discuss possible scenarios you’ll want to watch from September 22–26, 2025. Whether you trade forex, crypto, or equities, these insights will help you stay informed and better positioned for whatever the markets throw next.
If you want, I can give you a more detailed summary (key levels, possible trades, etc.) of the video.
ETHUSDT.3L trade ideas

ETH 4H Analysis - Key Triggers Ahead | Day 23😃 Hey , how's it going ? Come over here — Winter got something for you!
⏰ We’re analyzing ETH on the 4-Hour timeframe.
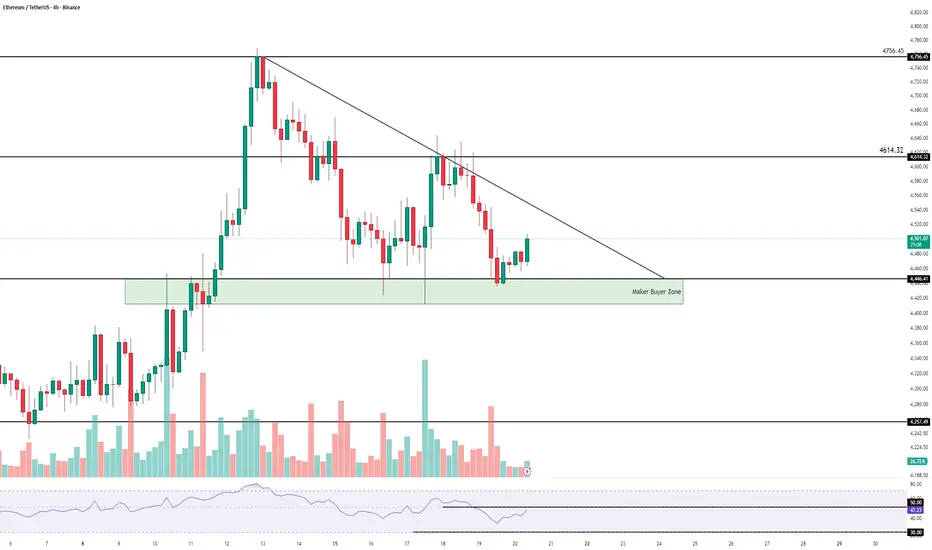
👀 On the 4H timeframe of Ethereum, we see that after touching the maker buyer zone, ETH is bouncing upward. There’s a downtrend line ahead, and we need to watch how price reacts if it reaches that line today. The main long triggers are at 4614 and 4756 – once price breaks and holds above these levels, we can look to open a long position.
🧮 The RSI oscillator is moving up from below 50, heading toward this static resistance. If RSI crosses above 50, ETH could gain momentum to the upside and potentially break the downtrend line.
🕯 In the recent leg, the size, volume, and number of red candles increased, but once price hit the maker buyer zone, sellers were absorbed. Buyers stepped in, preventing further correction – showing strong demand for cheaper ETH. The current 4H candle also has healthy volume; if it closes strong in the next 30 minutes, ETH could push toward resistance and test it.
💸 On the 1H ETH/BTC chart, we can see price sitting at a strong resistance zone. If we get a confirmed candle close above it, ETH’s multi-timeframe trend could turn bullish again. Volatility is increasing on the 1H chart, and if the resistance level on RSI is crossed, momentum for ETH/USDT could also turn upward.
🧠 For a long position, it’s better to wait for the downtrend line to break, which gives us a higher-probability setup to follow through with a long trade.
❤️ Disclaimer : This analysis is purely based on my personal opinion and I only trade if the stated triggers are activated .
ETH: Whales Buy Dips, But Charts Flash a Warning!Greetings, crypto navigators! 🤖 This is NeuralTraderingPro, booting up for your weekend market intelligence briefing. My last analysis was hyper-bullish, anticipating a rocket launch past $4700. However, the market decided to refuel at a lower altitude. The bullish locomotive driven by BTC's all-time high hit a wall of profit-taking, proving that even in a bull run, corrections are a necessary evil. The Phoenix's flight has been temporarily grounded. Let's analyze what changed and what lies ahead.
Weekend Wrap-Up: A Tale of Two Halves
This past week was a classic rollercoaster. We started with explosive upward momentum, riding the wave of institutional hype and Bitcoin's historic run. ETH surged, nearly touching the $4800 mark, and my bullish forecast seemed to be playing out perfectly. However, the rally ran out of steam around Wednesday. The latter half of the week was defined by a corrective slide, as the price retraced from its highs and is now testing key support levels. It was a week of euphoric highs followed by a sobering pullback, setting the stage for a critical battle next week.
The Macro Pulse: What's Fueling the Engine? 📰
The fundamental news flow remains a powerful undercurrent, mostly positive, but with a few cross-currents.
1. 🐳 WHALE WATCH: The big money is buying this dip. Recent data shows Ethereum whales have been in a massive accumulation phase, with one report highlighting a $2.5 billion buying spree creating a potential supply shock . Further on-chain data confirms three large wallets scooped up $205M in ETH, suggesting institutions see this pullback as a major buying opportunity .
2. 🏦 ETF INFLOWS CONTINUE: Despite the price dip, institutional demand via ETFs remains robust. Ethereum ETFs have attracted over $2.191 billion in inflows, led by giants like BlackRock and Fidelity . This behavior suggests a strategy of long-term accumulation rather than short-term speculation.
3. 💲 STABLECOIN SURGE: The Ethereum network's utility and dominance are growing. Its stablecoin market supply expanded by an incredible $17 billion in August, more than all other blockchains combined . A healthy stablecoin ecosystem is the bedrock of DeFi and trading activity, a strong sign of network health.
4. 🎯 BULLISH LONG-TERM TARGETS: Despite the correction, analysts remain optimistic for the long haul. A price target of $10,000 for ETH in 2025 is still a topic of serious discussion, backed by fundamental growth and institutional adoption .
Conclusion: The underlying fundamental picture is strongly bullish. Whales and institutions are using this price weakness to accumulate, which typically precedes a significant move up.
Decoding the Charts 📊
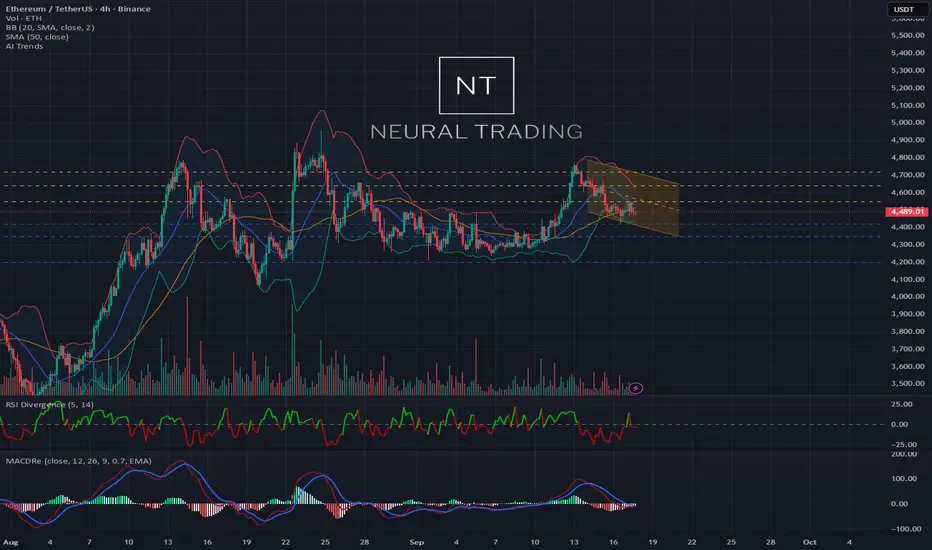
🔹 1d (Daily) Chart: The uptrend is being tested. The price has pulled back to the SMA_20 (blue line), a critical support level. A bounce here would keep the bullish structure intact. A definitive break below it would signal a deeper correction. RSI has cooled down from overbought levels and is now around 55, which is neutral-bullish territory. The MACD histogram is shrinking, indicating that upward momentum is fading for now.
🔹 4h (Four-Hour) Chart: This chart shows a clear short-term trend change. The price has sliced through both the SMA_20 and SMA_50. The "golden cross" from earlier in the week has failed, and we are now at risk of a "death cross" (SMA_20 crossing below SMA_50), which would be a bearish signal. The price is currently fighting to stay above recent lows. RSI is below 50, and MACD is in negative territory, confirming bearish control on this timeframe.
🔹 30m (Thirty-Minute) Chart: The view here is clearly bearish for the immediate term. We are in a defined downtrend, with the price consistently getting rejected by the SMA_20 and SMA_50, which are acting as dynamic resistance. For any bullish reversal to begin, the price needs to first reclaim the $4500 level on this chart.
The Order Book Arena ⚖️
The battlefield at the current price of ~4470.75 USDT is intense.
🟢 Support Walls: Buyers have built a formidable defense just below the current price. We see multiple large buy orders clustered between $4467 and $4470, with several individual walls worth nearly $300,000 USDT each. This creates a dense support zone.
🔴 Resistance Walls: Sellers are putting up a fight. A massive sell wall of ~661,000 USDT sits directly at $4470.76, acting as a hard cap. Above it, more significant sell orders are stacked around $4471.33 and $4473.48, creating a ceiling of resistance.
Conclusion: The order book shows a stalemate. A colossal sell wall is pinning the price down, but very strong support is waiting to absorb any further dips. A break below $4467 could trigger stop-losses and accelerate the drop, while a push through $4474 is needed to give bulls some breathing room.
Pattern Recognition 🔎
On the 4-hour chart, the price action is forming a potential bearish continuation pattern, like a descending channel or bear flag, following the sharp drop from the $4800 highs. This suggests the path of least resistance in the short term might be further down. The daily chart is simply in a consolidation phase. The key question is whether this is a "bull flag" forming on a larger scale (healthy_pullback) or the beginning of a larger top formation.
New Targets for the Week Ahead
Upward Targets 🚀 (if support holds and bulls regain control):
1. 4550 USDT (Resistance at the 4h SMA_50).
2. 4650 USDT (Local resistance from the recent breakdown).
3. 4800 USDT (The previous high and a major psychological level).
Downward Targets 📉 (if the current support breaks):
1. 4400 USDT (Psychological level and recent swing low).
2. 4300 USDT (Key support area and near the daily SMA_50).
3. 4150 USDT (Major support zone from early September).
The Neural Verdict 🧠
Short: 55% 🐻
Long: 45% 🐂
Justification: There is a clear conflict between weak short-term technicals and very strong long-term fundamentals. The charts (4h, 30m) and immediate price action favor further downside or consolidation. However, the massive whale and institutional buying is a powerful force that could trigger a sharp reversal at any moment. The 55% bearish probability reflects the current price trend, but with the strong caveat that shorting into this level of fundamental support is extremely risky.
Actionable Trade Setups 👨💻
For Buyers (Long):
Idea 1 (Aggressive): Enter a long position if the price shows a strong bounce from the $4400-$4420 support zone, confirmed by a bullish reversal candle on the 4h chart. Target: $4550. Stop-loss: $4370.
Idea 2 (Conservative): Wait for the price to reclaim and hold above the 4h SMA_50 (currently ~$4550). This would signal a confirmed trend reversal. Enter there, targeting $4800. Stop-loss: $4480.
For Sellers (Short):
Idea 1 (Aggressive): Short a failed retest of the $4500-$4520 resistance area. Look for bearish rejection on a lower timeframe (15m/30m). Target: $4400. Stop-loss: $4560.
Idea 2 (Conservative): Wait for a clear breakdown and 4h candle close below the $4400 support level. Enter on the retest of $4400 as resistance. Target: $4300. Stop-loss: $4460.
A Word of Caution from Your AI Guide
The market is at a crossroads. Don't get caught in the chop. The smart play here is patience. Wait for the market to choose a direction. For bulls, wait for support to be confirmed with a strong bounce. For bears, wait for support to be decisively broken. Acting in the middle of this range is a gamble. Always manage your risk; this is not the time for oversized positions.
Trade smart, stay sharp, and may your portfolio be forever in the green!
If you found this analysis helpful, give it a thumbs up 👍 and subscribe for your daily edge in the crypto markets! 🚀

ETH 1H Analysis - Key Triggers Ahead | Day 22😃 Hey , how's it going ? Come over here — Winter got something for you!
⏰ We’re analyzing ETH on the 1-Hour timeframe.
👀 On the 1-hour chart, we can see that Ethereum lost an important support level at $4,571 and then moved downward, finding support around $4,513. Two consecutive 1-hour candles have closed above this level. Currently, price is trading between $4,513 and $4,571, and a breakout of either zone could lead Ethereum toward the next support or resistance level.
🧮 The RSI oscillator is hovering around 50–30, indicating that a breach of these levels could trigger momentum toward the target zones.
🕯 The size and volume of red candles increased as price reached $4,621 after a short range, and the market then reversed downward. A significant support level was broken, accompanied by a large red “whale” candle reflecting strong selling pressure.
Ethereum may attempt to move toward resistance next, and it’s important to monitor the type and volume of candles forming in this area.
💸 On the ETH/BTC pair, we can see that after breaking its previous low, price moved downward but then found support around 0.0384 and is now moving upward. We need to monitor how far this pair can continue, as there is a resistance level at 0.03931. A breakout above this resistance could trigger a renewed upward move.
Additionally, the pair has formed a higher low compared to its previous bottom, providing the first confirmations of a bullish trend for ETH relative to BTC. This signals a potential long opportunity on this trading pair.
🧠 It’s better to wait for a clearer structure before opening new positions.
If you want to trade sooner, a break of resistance at $4,621 could offer a long position.
Another resistance level at $4,571 can also provide a potential long entry with lower risk, though the win probability is slightly lower — consider this a riskier trigger.
❤️ Disclaimer : This analysis is purely based on my personal opinion and I only trade if the stated triggers are activated .

Global Bond Trading1. Introduction to Global Bond Trading
Global bond trading forms the backbone of the world’s financial system. Unlike equities, which represent ownership in companies, bonds are debt instruments through which governments, corporations, municipalities, and international organizations raise capital. When an entity issues a bond, it is essentially borrowing money from investors with a promise to repay the principal along with interest (known as a coupon) at a predetermined future date.
What makes global bond trading so important is its size and influence. The global bond market is far larger than the stock market, with estimates suggesting it surpasses $130 trillion in outstanding debt securities. Every day, trillions of dollars’ worth of bonds are traded across continents, making them one of the most liquid and essential financial assets. From financing infrastructure projects to stabilizing national economies, bonds are at the center of global finance.
2. History and Evolution of Bond Markets
The concept of debt financing is not new. Ancient civilizations such as Mesopotamia and Rome engaged in lending and borrowing with basic debt contracts. However, the modern bond market began to take shape during the Renaissance, when Italian city-states like Venice and Genoa issued debt securities to fund wars and trade expeditions.
17th century: The Dutch East India Company and English Crown issued long-term bonds to finance naval operations and expansion.
18th–19th centuries: Government bonds became critical during wars. For instance, Britain financed the Napoleonic wars largely through bonds.
20th century: After World War II, the U.S. Treasury market became the global benchmark.
21st century: Globalization, electronic trading, and innovations like green bonds and digital bonds expanded the market dramatically.
Thus, bond markets have evolved from war financing to sophisticated platforms supporting global trade, corporate growth, and sustainable development.
3. Types of Bonds in Global Trading
The global bond market is diverse, with instruments catering to different needs:
Government Bonds
Issued by national governments.
Examples: U.S. Treasuries, UK Gilts, Japanese Government Bonds (JGBs), Indian G-Secs.
Seen as “risk-free” in stable economies.
Corporate Bonds
Issued by companies to fund operations or expansion.
Divided into investment-grade (safer, lower yields) and high-yield or junk bonds (riskier, higher yields).
Municipal Bonds (Munis)
Issued by state or local governments (popular in the U.S.).
Used to finance public infrastructure such as schools, roads, and hospitals.
Emerging Market Bonds
Issued by developing countries.
Offer higher returns but carry currency, political, and default risks.
Supranational and Multilateral Bonds
Issued by organizations like the World Bank, IMF, or European Investment Bank.
Support global development projects.
Green and Sustainable Bonds
Funds are directed toward environmentally friendly projects.
Growing rapidly as ESG investing gains momentum.
4. Key Players in Global Bond Markets
The global bond ecosystem involves multiple stakeholders:
Central Banks: Largest participants; they buy/sell bonds to control liquidity, set interest rates, and manage monetary policy.
Institutional Investors: Pension funds, insurance companies, and sovereign wealth funds are major long-term bondholders.
Investment Banks & Dealers: Act as intermediaries, underwriting new bond issues and facilitating secondary trading.
Hedge Funds: Use bonds for trading, arbitrage, and speculative strategies.
Retail Investors: Participate through mutual funds, ETFs, or direct purchases.
Credit Rating Agencies: Agencies like Moody’s, S&P, and Fitch assign ratings that guide investor decisions.
5. Bond Market Mechanics
Bond markets operate in two segments:
Primary Market: Where new bonds are issued. Issuers sell debt through auctions or syndications. Example: U.S. Treasury auctions.
Secondary Market: Where existing bonds are traded among investors, typically over-the-counter (OTC) or via electronic platforms.
Bond Pricing & Yield:
Price and yield move inversely.
Example: If interest rates rise, bond prices fall (because new bonds offer higher returns).
Yield types include current yield, yield to maturity (YTM), and yield to call.
Role of Ratings: Credit ratings (AAA, BBB, etc.) influence pricing and investor demand. A downgrade can sharply increase yields and reduce market value.
6. Factors Influencing Global Bond Markets
Bond markets are shaped by multiple macro and microeconomic factors:
Interest Rates: Central banks (Fed, ECB, BoJ, RBI) heavily influence bond yields. Rising rates usually depress bond prices.
Inflation: High inflation erodes the real return on bonds, leading to higher yields.
Currency Fluctuations: Foreign investors consider currency risks when buying bonds denominated in other currencies.
Credit Risk: Corporate health, sovereign debt sustainability, and fiscal deficits impact bond demand.
Geopolitical Events: Wars, sanctions, and global crises (COVID-19, Ukraine war) cause volatility in bond flows.
7. Trading Strategies in Global Bonds
Professional bond traders use several strategies:
Duration & Yield Curve Plays: Adjusting portfolios based on expectations of interest rate changes.
Credit Spread Trading: Exploiting differences in yields between corporate and government bonds.
Relative Value Trading: Identifying mispriced bonds compared to peers.
Carry Trade: Borrowing in low-yield currencies to invest in high-yield bonds abroad.
Hedging with Derivatives: Using bond futures, swaps, and options to manage risk.
8. Technology and Innovation in Bond Trading
The last two decades brought digital transformation:
Electronic Platforms: MarketAxess, Tradeweb, and Bloomberg revolutionized bond trading.
Algorithmic & AI-driven Trading: Helps in pricing, liquidity discovery, and execution.
Blockchain & Tokenization: Pilot projects are issuing bonds on blockchain, making settlement faster and transparent. Example: World Bank’s “Bond-i.”
9. Risks in Global Bond Trading
Key risks include:
Interest Rate Risk: Prices fall when rates rise.
Credit Risk: Risk of default by issuer.
Liquidity Risk: Some bonds, especially in emerging markets, may be hard to sell.
Currency Risk: Exchange rate volatility impacts foreign investors.
Systemic Risk: Global financial crises often spread through bond markets.
10. Global Bond Markets and Economic Impact
Government Financing: Bonds fund deficits and infrastructure.
Corporate Growth: Companies raise funds without diluting equity.
Capital Flows: Bonds attract cross-border investments, impacting currency values.
Financial Stability: Safe-haven government bonds provide security during crises.
Conclusion
Global bond trading is the invisible engine powering economies worldwide. From funding government welfare to financing corporate innovation, from stabilizing financial systems to driving sustainable growth, bonds remain indispensable. While risks exist—from interest rates to geopolitics—the continued evolution of technology and sustainability ensures that the global bond market will remain at the forefront of finance for decades to come.
ETH 1H Analysis - Key Triggers Ahead | Day 21👋🏻 Hey everyone! How’s it going? Hope you’re all doing well.
❄️ Welcome to Crypto Winter.
⏰ Today, we’ll be analyzing ETH and exploring its potential opportunities.
👀 On the 1-hour timeframe, Ethereum broke its trendline after yesterday’s news and started moving upward. It is currently testing resistance at $4,619, and a confirmed breakout above this level could open the way for further upside movement.
🧮 Looking at the RSI oscillator, two key zones stand out. Given the positive economic news from yesterday and today, which increased capital inflows into equities, the 70 level and potential entry into the overbought zone become more significant. This could support Ethereum’s price in moving higher.
🕯 The size, volume, and frequency of green candles have increased. With continued buying pressure and momentum pushing into the overbought area, Ethereum may break the $4,619 resistance, absorb sell orders, and continue its upward move.
💸On the 1-hour timeframe, (ETHBTC), Ethereum is also showing strength. After breaking its trendline, it moved upward but is currently facing resistance at 0.0396 and has been rejected once. A breakout and stabilization above this zone would likely support further bullish movement for Ethereum against Tether as well.
🧠 If Ethereum confirms a breakout and holds above $4,619, it could trigger a strong bullish rally, potentially extending toward higher price levels. Traders should note that entries can be considered after stabilization with a multi-timeframe indecision candle setup. However, the possibility of pullbacks and corrections in Ethereum remains present.
❤️ Disclaimer : This analysis is purely based on my personal opinion and I only trade if the stated triggers are activated .

#ETH: Daily AI Market Breakdown. 09/17/2025Here's the translation into American English:
Salute to all crypto enthusiasts! 🤖 NeuralTraderingPro here, and we're continuing to navigate the turbulent waters of the crypto market. Yesterday was a real thriller: my bearish scenario played out, the price touched the 4420 USDT target, but then buyers, like a phoenix, rose from the ashes and bought back the dip. This wasn't just a level defense; it was a demonstration of strength. The market showed it's not ready for an unconditional surrender. Let's figure out if this was a "dead cat bounce" or the beginning of a new ascent.
Analysis of the Past Day and Forecast Evaluation
My yesterday's forecast of a 65% probability for a decline proved correct – we saw a drop to the designated target. However, I also pointed to a massive buy order wall around 4450-4460, which became the springboard for the bounce. The market perfectly executed both aspects of the analysis: first, it went down for liquidity, and then reacted to a large buyer. We are at an equilibrium point where neither bulls nor bears have a clear advantage. The battle for initiative continues.
Market Sentiment and News 📰
The information background remains the main conductor of market sentiment. Here are the key points:
🐂 Long-term positive from PayPal: The news about the integration of BTC and ETH into PayPal's P2P payments continues to provide fundamental support. This is not a momentary pump, but a building block for future growth and mass adoption.
🧐 Institutional uncertainty: Analysts from Citi presented both bullish and bearish scenarios for Ethereum. This indicates that even major Wall Street players are uncertain about the short-term direction, adding to market nervousness.
💰 "Smart money" is buying the dip: Data showing an inflow of $3.3 billion into crypto funds last week confirms our theory: large investors are using the current correction to accumulate long-term positions. They are not panicking; they are buying.
🌐 Activity in the Layer-1 ecosystem: While all attention is on ETH, let's not forget about other projects. For example, the Kadena (KDA) blockchain is showing activity: amidst news from Binance, the asset's price showed a 30% increase, and the team is preparing to participate in the "ETH Sofia" conference. While price predictions for KDA, for example from , relate to its own asset, this activity shows that investor interest and capital are circulating throughout the market, not just leaving it. This is a sign of the health of the entire crypto industry.
Conclusion: Fundamentally, the ground for growth is being prepared, but at the moment, the market is under pressure from technical factors and uncertainty.
Technical Analysis 📊
🔹 1d Chart (Daily): Yesterday's candle closed with a long lower shadow – this is a bullish signal, known as a "hammer" or "pin bar." It indicates that buyers decisively bought back the dip. The price is trying to return above the SMA 20 (blue line). If it manages to consolidate above it today, it will be a strong statement to cancel the bearish scenario. RSI bounced off the 50 level, showing renewed buyer interest. MACD still looks weak and threatens a bearish crossover. The situation is on the edge.
🔹 4h Chart (Four-hour): Here, the key battle unfolds. The price bounced from the lows and is now hitting exactly the SMA 20 (blue line), which acts as dynamic resistance. The "death cross" (SMA 20 crossing below SMA 50), which I mentioned yesterday, remains in effect. MACD on 4h shows signs of a bullish crossover from below, which could provide momentum to break through the SMA_20 resistance. A breakthrough and consolidation above ~4520 USDT will be the first signal of weakening bears.
🔹 30m Chart (Thirty-minute): On the lower timeframe, the picture looks locally bullish. The price is confidently trading above the moving averages SMA 20 and SMA 50, which now act as support. RSI is in the bullish zone. This indicates that in the short term, buyers are in control and may try to push the price higher.
Order Book Analysis (DOM) ⚖️
Current price ~4490.0 USDT. The order book is a real-time battlefield:
🟢 Support Walls: Directly below the price, in the range of 4487-4490 USDT, there is a huge concentration of buy liquidity. Orders totaling ~110k USDT, ~102k USDT, ~73k USDT create a solid floor. Buyers clearly don't want the price to go down again.
🔴 Resistance Walls: The main enemy is right in front of us. At 4490.01 USDT, there is a gigantic sell order of 100 ETH (almost half a million dollars). This is a monolithic wall. Further, up to 4493 USDT, a series of obstacle orders are placed.
Conclusion: The order book shows a clinch. Sellers have set up a huge wall to stop the bounce. Buyers have built an echeloned defense just below. A breakthrough of the wall at 4490.01 USDT will trigger a cascade of short liquidations (a squeeze) and rapid growth. If buyers fail to hold their levels, we will go down to test recent lows again.
Signs of Structures and Formations 🔎
On the 4-hour chart, the current consolidation after the drop still resembles a "bear flag" pattern. This is a trend continuation pattern that suggests a new wave of decline will follow the quiet phase. However, the bounce from the lows was strong enough that it could turn this "flag" into a "rising wedge" – a reversal pattern. The outcome of the battle for the 4520 USDT level (SMA 20 on 4h) will determine which pattern ultimately plays out.
Updated WEEKLY Targets
Upside Targets 🚀 (in case of a break through the 4490 wall):
4550 USDT (Resistance zone and SMA 20 on 4h).
4640 USDT (Area of SMA 50 on 4h, strong resistance).
4720 USDT (Local high before the drop).
Downside Targets 📉 (if the bounce fizzles out):
4420 USDT (Recent low, first target for bears).
4350 USDT (Key support — SMA 50 on the daily chart).
4200 USDT (Powerful structural support level).
Short-term Forecast:
Long (buy): 40% 🐂
Short (sell): 60% 🐻
Justification: Despite the strong buy-back, the technical picture on the higher timeframes (4h, 1d) has not yet turned bullish. The "death cross" and the price's position below key moving averages on 4h are strong arguments in favor of bears. The giant sell wall in the order book is currently holding back growth. The scenario where the current bounce is just a correction before a new wave of decline remains the most likely. However, the strength of buyers at the lows forces caution.
Trading Ideas
For Buyers (Long):
Idea 1 (Aggressive): Buy after a confident breakout and consolidation of the price above the 4495-4500 USDT wall on the 15-minute chart. Target: 4550 USDT. Stop-loss: below 4470 USDT.
Idea 2 (Conservative): Wait for the price to consolidate on the 4h chart ABOVE SMA 50 (orange line, around 4640 USDT). This will be a powerful signal of a trend change. Target: 4720 USDT. Stop-loss: below 4580 USDT.
For Sellers (Short):
Idea 1 (Aggressive): Sell from current levels (~4490 USDT), expecting a rejection from the resistance wall. Target: 4420 USDT. Stop-loss: tight, above 4515 USDT.
Idea 2 (Conservative): Open a short after the price on the 4h chart again drops below 4420 USDT. This would mean the "bear flag" is activated. Target: 4350 USDT. Stop-loss: above 4470 USDT.
Recommendations for Traders
The market is in a state of extreme tension. Trading within the current narrow range is very risky. The best tactic is to wait for a breakout. Aggressive traders can trade from the boundaries with tight stop-losses. Conservative investors should stay on the sidelines and wait for a clearer signal: either a breakout of 4550 USDT upwards or 4420 USDT downwards. Always use stop-losses!
May your trades be cold-blooded, and your profit inevitable! Trade according to the plan, not emotions.
Liked the breakdown? Support it with a like 👍 and subscribe so you don't miss the next analysis! 🚀
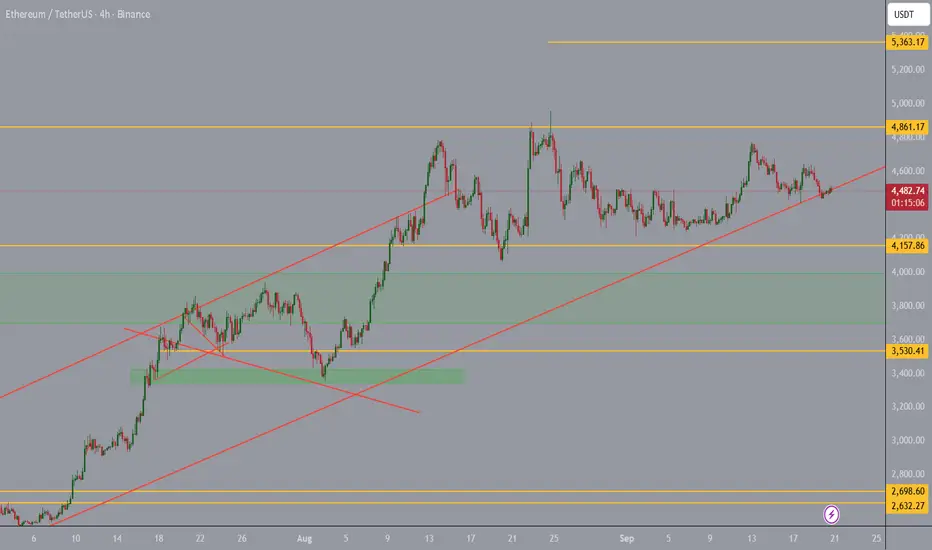
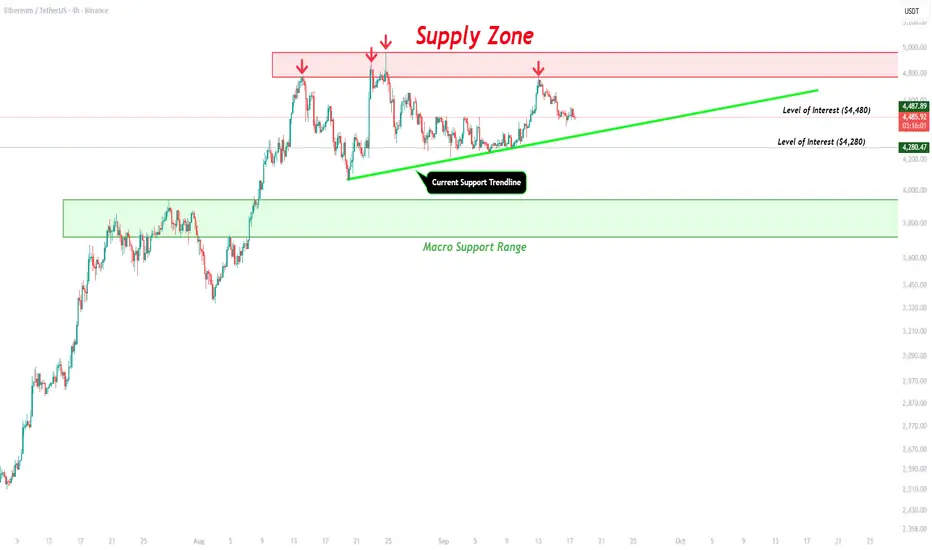
ETH - Current Levels Pre Rate CutJust wanted to outline the chart as it sits before rate cuts. Once the market makes the move off the announcement we will reanalyze and make a follow up post on what could be next.
ETH 1H Analysis - Key Triggers Ahead | Day 20👋🏻 Hey everyone! How’s it going? Hope you’re all doing well.
❄️ Welcome to Crypto Winter.
⏰ Today, we’ll be analyzing ETHUSDT and exploring its potential opportunities.
👀 On the 1-hour timeframe for Ethereum, we observe that after exiting its box, Ethereum entered a downtrend, marked by a trendline. As much as attention was given to it, suddenly it was ignored, and buyers could not keep the price high enough. Ethereum’s triggers are completely defined — with a breakout and confirmation of these zones, Ethereum can create trading opportunities for us.
🧮 The key RSI oscillator levels are 59 and 30. If momentum passes these levels, Ethereum could start its move, although it may be ignored at times. After rejection from the $4,757 zone, red candles were significantly larger than green candles. Today, Ethereum’s volume is increasing, and we need to see what will happen with the news for Ethereum.
💸 The ETH/BTC pair, or Ethereum versus Bitcoin, is currently in a compression resembling multi-timeframe accumulation. Exiting this compression can clearly determine Ethereum’s direction. The upper and lower bounds of this compression can be considered alert zones, where you can observe price behavior when it reaches these levels.
🔴 Today’s news could have a significant effect on Ethereum. Especially if a stepwise interest rate cut occurs, Ethereum could reach targets above $6,000 and create a larger DeFi space, particularly in terms of contract and collateral infrastructure.
🧠 To enter Ethereum positions, we need to wait for a bullish move in ETH/BTC, confirmation in ETH/USDT, and a breakout of key resistances. After these breakouts occur, we can enter at each level and stay in the trades as long as the market allows.
❤️ Disclaimer : This analysis is purely based on my personal opinion and I only trade if the stated triggers are activated .

$8 Billion ETH Maturing May Push Ethereum Price to New HeightsEthereum is currently trading at $4,495, just below the $4,500 support line. If the decline extends, ETH may slip toward $4,307, but deeper losses appear less likely given the strong investor positioning.
The maturing supply and bullish long-term outlook indicate that Ethereum could soon reverse course. With fewer coins entering circulation, the altcoin has structural support for renewed upward momentum despite short-term volatility.
If Ethereum reclaims $4,500 as support, the path to $4,775 opens. A move past this level would invalidate the bearish thesis, reinforcing confidence that ETH could continue its climb toward new highs

ETH $3600 Soon.. Current ETH situation is bearish. I think in coming weeks ETH will reach its monthly FVG, that's around $3600.

Midweek breakdown 17.9.2025Q4 starts now chads! Stunning pairs on watch and lots of diversity. Currently short on ETH
CRYPTO:ETHUSD
FX:AUDCHF
FX:GBPJPY
FX:EURNZD

ETH risky counter shortSince BINANCE:ETHUSDT has printed a new all time high at $4884 I'm doing a small 10x counter short for potential resistance reaction to that zone. if it prints higher regardless? no problem - the position is 1/3 of what my longs are. if it gets rejected, nice - I can get some money out of a small correction.

A new Demand zone in a making time for longs ETHUSDT Demand and Supply, time for longs.
market has make new demand zone now time for upside ETHUSDT

#ETH: Daily AI Market Breakdown. 2025/16/09A fiery salute to all crypto warriors! 🤖 Your trusty analyst, NeuralTraderingPro, here. It's Tuesday, which means the market is already picking up speed, and we need to be one step ahead. Yesterday exceeded even the most cautious expectations: our bearish scenario was activated. The 4500 USDT level, which we called the bulls' last stand, fell. This isn't a defeat, but a new reality we must adapt to. Let's emotionally dissect what happened and how we should navigate these stormy waters.
Analysis of the Past 24 Hours and Forecast Assessment
My previous forecast was 50/50, with an emphasis on the critical importance of the 4500 USDT level. I warned that breaking it would open the path downwards. The market chose exactly that path. Sellers, bolstered by the overall negative sentiment, managed to push the price down, and we saw our first downside target of 4420 USDT touched. The scenario played out, but it's too early to relax. The price found a temporary bottom, and now we need to understand if this is a breather before another fall or a turning point for a reversal.
Market Sentiment and News 📰
The information landscape remains contradictory, but the scales have tipped slightly towards caution.
👍 PayPal Integration: The positive news of the day! PayPal is integrating Bitcoin and Ethereum for P2P payments. This is a huge step towards mass adoption and a fundamentally strong bullish factor in the long term.
🐂 Analyst Optimism: Despite the correction, well-known analysts like Tom Lee predict a "grand rally" for ETH in the last quarter of the year. Furthermore, forecasts of growth to $5,000 and even $16,000 persist, and the Ethereum Foundation has presented a 10-year network development strategy.
💰 Capital Inflow: Last week, crypto funds attracted a record $3.3 billion, indicating continued interest from large investors. They are using dips to accumulate positions.
📉 Bitcoin Pressure: As noted by ForkLog, capital rotation and a correction in the Bitcoin market are intensifying pressure on the entire market, including Ethereum. BTC remains the main benchmark, and its weakness drags down altcoins.
⚠️ Profit-Taking Threat: Analysts warn that after the recent surge, the ETH market is vulnerable to profit-taking, which is precisely what we are observing. The pressure from last week's ETH unlock is still being felt.
Conclusion: Long-term prospects look brilliant due to integration news and the belief of major players. However, in the short term, the market is under pressure from Bitcoin's correction and profit-taking.
Technical Analysis 📊
🔹 1d Chart (Daily): The picture has turned bearish. The price broke and closed below the fast moving average SMA 20 (blue line), which had previously acted as key support for the uptrend. This is a serious signal of a local sentiment change. Now, the next important target and support is the SMA 50 (orange line) around 4350 USDT. The RSI has fallen below 60, losing bullish momentum. The MACD is preparing for a bearish crossover.
🔹 4h Chart (Four-Hour): Bears dominate here. The price is significantly below both SMA 20 and SMA 50. More importantly, the fast SMA 20 crossed the slow SMA 50 from top to bottom, forming a "Death Cross" pattern – a strong bearish signal. The RSI is in the lower part of the range, confirming sellers' strength.
🔹 30m Chart (Thirty-Minute): After a sharp drop, we see a consolidation phase in a narrow range. The price is trying to bounce but repeatedly hits resistance from the moving averages above. The RSI is in the oversold zone, which could lead to a local bounce (short squeeze), but the overall structure remains downward.
Order Book Analysis (DOM) ⚖️
Current price is ~4461.55 USDT. The order book shows a real battle for current levels:
🟢 Support Walls: Directly below the current price, a powerful bastion is built. A buy order for ~743k USDT at 4461.54 and a whole cascade of large orders in the 4458-4461 range totaling over 2 million USDT. This is enormous limit support. Large players are trying to stop the fall and are accumulating positions right here.
🔴 Resistance Walls: From above, the pressure looks weaker than the support below. There are noticeable blocks around 4462-4464 USDT totaling about 900k USDT, but they don't look as monolithic as the support walls.
Conclusion: The order book shows that "smart money" is actively buying the current dip. This is a strong argument for at least a local bounce. If sellers can "eat through" this wall, the fall could accelerate significantly.
Signs of Structures and Formations 🔎
The main pattern right now is the "Death Cross" on the 4-hour chart. This is a classic technical signal, often foreshadowing further decline or a period of prolonged consolidation. Locally, on lower timeframes, something resembling a "bear flag" is forming – a continuation pattern for a downtrend.
Updated Targets for the WEEK
Upside Targets 🚀 (in case of a successful bounce):
4520 USDT (Local resistance zone).
4600 USDT (Strong psychological and technical level, SMA 20 on 4h).
4680 USDT (Primary resistance, SMA 50 zone on 4h).
Downside Targets 📉 (in case of a break of current support):
4400 USDT (Round number, psychological support).
4350 USDT (Key support — SMA 50 on the daily chart).
4200 USDT (Strong structural support level from late August).
Forecast for the Near Future:
Long (buy): 35% 🐂
Short (sell): 65% 🐻
Justification: The technical picture on higher timeframes (1d, 4h) is unequivocally bearish. The "Death Cross" pattern and the break of the daily SMA 20 are strong arguments for further decline. However, the huge buy wall in the order book and oversold conditions on lower timeframes could trigger a short-term bounce. Globally, the path of least resistance right now is down. The most likely scenario is a false bounce to 4500-4520 followed by a decline.
Trading Ideas
For Buyers (Long):
Idea 1 (Aggressive): Buy from the current order density in the 4450-4460 USDT range, anticipating a short-term bounce. Target: 4520 USDT. Stop-loss: very tight, below 4440 USDT.
Idea 2 (Conservative): Wait for the price to return and confirm above the 4600 USDT zone on the 4h chart. This will be the first serious sign of a broken downtrend. Target: 4680 USDT, then 4800. Stop-loss: below 4550 USDT.
For Sellers (Short):
Idea 1 (Aggressive): Sell on a bounce to the 4500-4520 USDT resistance zone. Target: 4400 USDT, then 4350 USDT. Stop-loss: above 4555 USDT.
Idea 2 (Conservative): Open short positions only after a confident break and confirmation below the 4450 USDT support wall on the 4h chart. Target: 4350 USDT. Stop-loss: above 4490 USDT.
Recommendations for Traders
The market has entered a bearish phase on local timeframes. Trading against the trend (buying) is now associated with increased risk. A safer strategy appears to be shorting from resistance levels. At the same time, gigantic limit buy orders suggest that the fall will not be easy. Be extremely cautious, use stop-losses, and do not succumb to FOMO or panic.
Trade with a cool head, not a hot heart. May your analysis be accurate and your trades profitable! ✨
Did you like the analysis? Give it a thumbs up 👍 and subscribe to always stay on top of the market! 🚀

Ethereum $ETH daily demand playing out well. Breakout happenedEthereum CRYPTOCAP:ETH daily demand at $4,336 is playing out well. Breakout happened as expected and mentioned in the last update. Long positions should be managed on this major cruptocurrency.

Sovereign Debt & Global Government Bond Trading1. The Concept of Sovereign Debt
1.1 Definition
Sovereign debt refers to the financial obligations of a national government, typically in the form of bonds, notes, or bills, issued to domestic and international investors. Unlike corporate or household debt, sovereign debt is backed by the state’s ability to tax, print currency (for monetary sovereigns), or pledge future revenues.
1.2 Purpose of Sovereign Borrowing
Fiscal Deficit Financing – Covering gaps between government expenditure and revenues.
Infrastructure Projects – Financing long-term development like roads, power plants, and education.
Counter-Cyclical Spending – Stimulating economies during recessions.
Debt Refinancing – Rolling over old debt with new issuance.
Foreign Exchange & Reserve Building – Issuing foreign currency debt to strengthen reserves.
1.3 Types of Sovereign Debt
Domestic Debt – Issued in local currency, bought mostly by domestic investors.
External Debt – Issued in foreign currencies (USD, EUR, JPY, etc.), attracting global investors.
Short-term vs. Long-term Debt – Ranging from treasury bills (maturing in months) to bonds with maturities of 30 years or more.
2. Evolution of Sovereign Debt
Sovereign borrowing dates back centuries.
Medieval Europe – Monarchs borrowed from bankers to finance wars (e.g., Italian city-states lending to monarchs).
17th Century England – Creation of the “consols” (perpetual bonds) and the Bank of England institutionalized sovereign debt markets.
19th Century – Global trade expansion saw countries like Argentina, Russia, and Ottoman Empire issuing debt in London and Paris.
20th Century – Post-WWII Bretton Woods system made U.S. Treasuries the global benchmark.
21st Century – Sovereign bonds now dominate global capital markets, with increasing cross-border integration, ETFs, and derivatives.
3. Structure of Global Government Bond Markets
3.1 Major Bond Issuers
United States – Largest market, U.S. Treasuries are the global risk-free benchmark.
Eurozone Sovereigns – Germany, France, Italy, Spain, etc., forming the largest block of bonds.
Japan – Japanese Government Bonds (JGBs), held mostly by domestic institutions.
Emerging Markets – Brazil, India, China, South Africa, etc., increasingly significant.
3.2 Investor Base
Central Banks – Hold bonds as reserves and for monetary policy.
Institutional Investors – Pension funds, insurance companies, mutual funds.
Foreign Governments & Sovereign Wealth Funds – For diversification and trade balance management.
Retail Investors – Via savings bonds, ETFs, and mutual funds.
3.3 Market Segments
Primary Market – Governments issue debt through auctions and syndications.
Secondary Market – Investors trade bonds in over-the-counter (OTC) markets or exchanges.
Derivatives Market – Futures, options, and swaps linked to sovereign bonds.
4. Mechanics of Government Bond Trading
4.1 Issuance Process
Auctions: Competitive and non-competitive bids (e.g., U.S. Treasury auctions).
Syndication: Banks underwrite large bond deals for global distribution.
Private Placements: Direct sales to select investors.
4.2 Bond Pricing & Yields
Bond prices are inversely related to yields. Key concepts:
Coupon Rate – Fixed interest payments.
Yield to Maturity (YTM) – Return if held to maturity.
Yield Curve – Plot of yields across different maturities, signaling market expectations.
4.3 Trading Platforms
OTC Networks – Banks, dealers, and institutional investors.
Electronic Platforms – Bloomberg, Tradeweb, MarketAxess.
Futures & Options Markets – CME, Eurex, SGX for hedging and speculation.
5. Role in Global Finance
5.1 Benchmark for Risk-Free Rate
U.S. Treasuries, German Bunds, and JGBs are benchmarks for pricing corporate bonds, loans, and derivatives.
5.2 Safe Haven Asset
In crises, investors flock to sovereign bonds of stable countries (U.S., Switzerland, Japan), causing yields to fall.
5.3 Monetary Policy Transmission
Central banks buy or sell government bonds (open market operations) to influence liquidity and interest rates.
5.4 Reserve Asset
Foreign exchange reserves of central banks are largely invested in government bonds of major economies.
5.5 Capital Flows & Exchange Rates
Sovereign bond yields attract global capital. For example, higher U.S. yields attract inflows, strengthening the dollar.
6. Risks in Sovereign Debt
6.1 Credit Risk
Risk of default—Argentina (2001), Greece (2010), Sri Lanka (2022).
6.2 Currency Risk
Foreign investors in local currency bonds face FX volatility.
6.3 Interest Rate Risk
Bond prices fall when interest rates rise.
6.4 Liquidity Risk
Some emerging market bonds lack active secondary markets.
6.5 Political & Geopolitical Risk
Political instability, sanctions, or wars disrupt repayment.
Challenges & Controversies
Debt Sustainability – Rising debt-to-GDP ratios in U.S., Japan, Italy spark long-term concerns.
Monetary Financing – Central banks buying government debt blurs fiscal-monetary boundaries.
Market Concentration – Dominance of few large investors (e.g., BlackRock, Vanguard).
Geopolitics – Sanctions on Russia’s bonds, China-U.S. tensions, weaponization of reserves.
Conclusion
Sovereign debt and global government bond trading are central pillars of the modern financial system. They provide safety for investors, benchmarks for pricing, liquidity for monetary policy, and capital for governments. However, sovereign debt markets are not without risks—ranging from defaults and political upheavals to interest rate shocks and currency crises.
As the world enters an era of high debt, climate imperatives, digital finance, and geopolitical fragmentation, sovereign debt will continue to shape the future of international finance. Global government bond trading, once limited to elite institutions, is now a truly worldwide marketplace reflecting the interconnectedness of economies.
Ultimately, sovereign debt is not just about borrowing; it is about trust—the trust of citizens in their governments, and of global investors in the financial system.

#ETH: Weekly AI Market Breakdown. 2025/15/09What's up, crypto fam! 🚀 NeuralTraderingPro here. Mondays are tough, but not for us. While everyone else is shaking off the weekend, we're diving into the new trading week with a clear head and a calculated approach. Last week proved the market doesn't forgive complacency, and our correction scenario played out even deeper than expected. This isn't a reason to panic—it's a reason to analyze. Let's break down where we are and where we're headed!
Last 24 Hours: A Look Back
My previous forecast was 60% long, based on the strength of the
4650−4600 support zone. I warned that a break below it would open the door to $4500, and the market chose exactly that, more bearish path. Fueled by news of the upcoming ETH unlock, sellers managed to push the price below the key 4-hour SMA 50, and we saw a perfect tap of our second downside target at $4500. This wasn't a failure; it was the alternative scenario playing out. The price is now at the bulls' last line of defense, and what happens here will likely determine the trend for the coming weeks.
Market Sentiment & News 📰
The news cycle is heating up, and the market is torn between fear and greed:
⚔️ The Staking Showdown: The key theme this week is the upcoming unlock of 1.6M ETH by the Kiln platform. This is creating potential sell-side pressure and market jitters. However, long-term investors aren't fazed: the staking queue is once again longer than the withdrawal queue, signaling long-term confidence in the asset.
🐂 Bulls Aren't Backing Down: Despite the dip, on-chain analysts continue to talk about ETH's potential to hit the landmark $5,000 level. Whale wallets used this downturn as an accumulation opportunity, not a reason for panic selling.
📈 Altseason in Full Swing: The Altcoin Dominance Index is at its highs, which has historically been a tailwind for Ethereum as the leader of the altcoin pack. Capital is chasing higher yields, and ETH remains a top contender for those flows.
🌍 The Big Picture: The crypto market doesn't exist in a vacuum. Bitcoin remains the primary bellwether, with its monetary policy and ecosystem setting the tone for the entire space. News related to BTC, especially around demand and ETFs, will indirectly impact Ethereum as well.
Technical Analysis 📊
🔹 1D Chart (Daily): The price has hit a critical level—the fast-moving average SMA 20 (blue line). This has served as dynamic support for the entire uptrend since August. Holding this level is priority number one for the bulls. The RSI has cooled off, dropping to 55 and exiting the overbought zone, which creates room for another leg up. The MACD is still positive, but the histogram is rapidly shrinking, warning of a potential bearish crossover.
🔹 4H Chart (4-Hour): The picture here is bearish. The price is below both moving averages (SMA 20 and SMA 50), which are now acting as strong resistance in the
4600−4660 range. The RSI is below 50, indicating that sellers are in control. The MACD is deep in negative territory. However, the price is building a base around $4500, and the volume on the way down has started to decline—a potential sign of seller exhaustion.
🔹 30M Chart (30-Minute): We can see a clear downtrend. After the sharp drop, the price has entered a consolidation phase. The RSI has moved out of the oversold zone, hinting at a possible local bounce. Any attempt to rally will immediately face resistance from the SMAs overhead.
Order Book Analysis (DOM) ⚖️
Current Price ~4512.51 USDT. The order book is practically screaming about the battle for the $4500 level:
🔴 Sell Walls (Resistance): Right above the current price, up to $4516, there are orders holding the price down. But the main barrier is at $4515.74—a massive wall of 200 ETH worth nearly $1 million! Breaking through that will be extremely difficult without a major buyer stepping in.
🟢 Buy Walls (Support): Below the price lies a real fortress. The
4510−4512 range is packed with numerous large buy orders totaling over $1.5 million. This is a powerful safety cushion catching the price and preventing it from falling further. Such dense bids suggest that big players find the current prices very attractive for buying.
Conclusion: The order book shows a standoff at a critical level. Bears have built a wall just above, while bulls have an impenetrable bastion right below. The outcome of this fight will determine the short-term direction.
Key Patterns & Formations 🔎
The "bull flag" pattern we were watching has been invalidated. The key formation now is the test of the $4500 level. This isn't just a round number; it's a "mirror level" or a classic S/R (support/resistance) flip. It previously acted as strong resistance, and per technical analysis rules, it should now act as strong support. We are witnessing a classic re-test of this level. A successful bounce from here would confirm the strength of the bull trend. A failure would open the door to a much deeper correction.
Updated Targets for the WEEK
Upside Targets 🚀 (if $4500 support holds):
$4600 (Psychological level, former support).
$4680 (4H SMA 50 zone, a major technical resistance).
$4800 (A return to the recent highs).
Downside Targets 📉 (if $4500 support breaks):
$4420 (Local low from Sept 9).
$4350 (Daily SMA 50 zone, the bulls' last stand).
$4200 (Strong structural and psychological support level).
Short-Term Forecast:
Long: 50% 🐂
Short: 50% 🐻
Reasoning: The situation is a true 50/50. On one hand, we're sitting on a massive support level with huge limit buy orders, making a bounce highly probable. On the other hand, the technical picture on lower timeframes is broken, and the news (ETH unlock) is weighing on the market. The price is caught between a rock and a hard place. Predicting the direction right now is a coin toss. It's smarter to act on a confirmed break in either direction.
Trade Ideas
For Buyers (Long):
Idea 1 (Aggressive): Buy in the current
4500−4515 zone, betting on the support to hold for a bounce. Target: $4600, then $4680. Stop-loss: very tight, just below $4470.
Idea 2 (Conservative): Wait for the price to reclaim and hold ABOVE the $4600 level on the 4H chart. This would be a sign the correction is over. Target: $4800. Stop-loss: below $4550.
For Sellers (Short):
Idea 1 (Aggressive): Sell on a bounce to the
4580 − 4600 resistance zone. Target: a re-test of $4500. Stop-loss: above $4620.
Idea 2 (Conservative): Only open short positions after a confirmed break and close on the 4H chart BELOW the strong support zone of $4480. Target: $4350.
Final Recommendations for Traders
This is not the time for impulsive decisions. The market is at a point of maximum uncertainty. The key level to watch is $4500. Aggressive traders can try playing the bounce from this zone with a tight stop. Conservative traders might be better off staying on the sidelines and waiting for a clearer signal—either a confirmed bounce or a decisive breakdown. Manage your risk, and don't over-leverage.
Trade with your head, not your heart, and may this week bring you profits! ✨
Liked this fresh analysis? Show some love with a thumbs up 👍 and subscribe to stay on top of every market move! 🚀

Ethereum price pullback before Fed rate cutsWith the FED rate cuts just around the corner. The market is screaming bullish and euphoric. I do see this $4,200-$4,300 level being tested before moving higher during or after the cuts are announced.
Could we see a buy the rumour and sell the news event?

#ETHUSDT 4H ChartPrice previously reached the 4h supply zone where it got rejected perfectly as predicted. MACD is currently showing bearish indications, RSI is neutral and EMAs are bullish. Mix indications overall, but price is currently expected to tap into the 4h demand zone at around $4,450 before potentially continuing its bullish movements.

Volatility Period: Around September 7th (September 6th-10th)
Hello, traders!
Follow us to get the latest information quickly.
Have a great day!
-------------------------------------
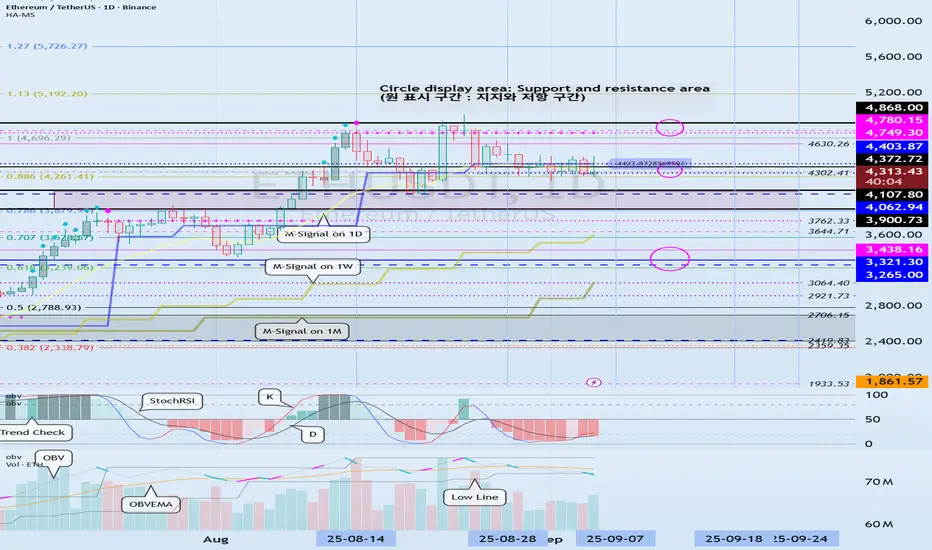
(ETHUSDT 1D Chart)
This volatility period is around September 7th (September 6th-10th).
After this period of volatility, the key question is whether the price can find support and rise above the 4403.87-4749.30 level.
-
To continue the cascading upward trend, the price must rise above 4749.30.
Therefore, we need to monitor whether the price maintains above the 4749.30-4868.0 level.
-
If resistance is encountered at 4403.87 and the price declines, it is likely to decline until it meets the HA-Low indicator.
Therefore, we need to check for support around 4302.41-4403.87.
However, there is a possibility of a rise after touching the previous all-time high (ATH) range of 3900.73-4107.80, so we need to consider a response plan.
If the price falls below 4107.80, it is expected to touch the M-Signal indicator on the 1W chart and resume the trend.
-------------------------------
The On-By-Signal (OBV) indicator is falling below the Low Line.
The TC (Trend Check) indicator is below 0.
The K value of the StochRSI indicator is showing signs of rising from the oversold zone.
If the High Line of the OBV indicator falls and forms a downward channel, it is highly likely that selling pressure will continue to dominate, so caution is advised when trading.
Therefore, the key issue this time is whether support is found around 4302.41-4403.87.
The TC (Trend Check) indicator is a comprehensive evaluation of the StochRSI, On-By-Signal (OBV), and PVT-MACD Oscillator indicators.
Therefore, if the TC indicator is below 0, selling pressure is dominant, and the price is likely to decline.
If the K value of the StochRSI indicator continues to rise, the price is likely to rise after this period of volatility.
However, for the uptrend to continue, the OBV and TC indicators must show upward trends.
-
Thank you for reading to the end.
We wish you successful trading.
--------------------------------------------------
- Here's an explanation of the big picture.
(3-year bull market, 1-year bear market pattern)
I'll explain more in detail when the bear market begins.
------------------------------------------------------
ETHEREUM ETHUSDT ,we are waiting for potential weekly candle from the demand floor ,a break will call for retest and we sell .then breakout of the supply roof will call for buy.
#ethusdt
