ETH short trade Eth is very downtrend. Price is approaching to supply area with rsi indicating overbought level. We have a clean break of Structure which shows selling pressure is still active.
Moreover, with the multi time frame analysis, the price is below 200 ema which correlates with the 4hr, 1hr, 30m, and 15m, signaling a bearish bias.
ETHUSDT.3S trade ideas

Ethereum ShortAs U.S. Treasury yields and the U.S. dollar continue to strengthen, The crypto market continues its selloff. I have outlined some key areas where bulls will start to nibble on longs. Shorts are still open for at least another 2% down.

$ETH Bearish Short-Term (September 24, 2025)BINANCE:ETHUSDT
Summary of Price Action:
Recent Movement: In the last 24 hours, ETH has dropped by about 1.12%, reaching around $4,133 - $4,175 this morning (UTC). This follows a slight recovery from lows near $4,092 on September 22, but it's now retesting support at $4,100 amid strong institutional redemptions. In your 2H chart, we see a series of red candles (bearish) indicating selling pressure, with trading volume increasing during the decline, confirming seller interest.
Key Levels:
Support: $4,100 (immediate level, tested today) and $4,000 - $4,092 as a stronger lower zone. If $4,100 breaks, we could see a drop toward $3,900.
Resistance: $4,180 - $4,200 (strong level with recent rejections). A break above $4,200 would signal recovery toward $4,300.
Volume and Liquidity: 24-hour volume is around $34.8 billion, with large liquidations tied to $141 million in spot ETF outflows over the past day, mostly from institutional longs. This shows smaller traders suffering from bearish pressure.
MACD Indicator Analysis :In the chart you sent, the MACD line (blue) is crossing below the signal line (orange), with the histogram turning more negative (red bars growing). This indicates a bearish divergence – the price is weakening while momentum is losing strength. MACD is below the zero line, confirming a weak short-term trend. RSI (at similar levels) is around 40-50, signaling lightly oversold, but still without strong buy signals.
Overall Trend:
Bearish Short-Term, Bullish Long-TermShort-Term (Today/Next Day): Bearish.
The price is consolidating in a bearish channel, with predictions for further downside toward $4,000 - $4,092 today or tomorrow, due to fear sentiment and pressure from ETF outflows. This matches your chart, where we see a potential descending triangle pattern (but still uncertain). Avoid immediate buys – wait for confirmation below $4,100 for shorts or above $4,180 for longs.

Critical Moment for ETH – Support or Breakdown?Ethereum is sitting on the key $4,000 level with strong downward momentum. The big question: will this support hold or break? I’ve been saying for a while that $3,500 is still on the table.

Ethereum $ETH similar price action to late JuneIt's not perfect look to see CRYPTOCAP:ETH losing the daily range
However, the current PA oddly reminds me of one from late June
RSI and AO are similar as well
The next few days will be interesting to see if they are trying to scare the paper hands before the generation run, or the generational run is getting postponed for now

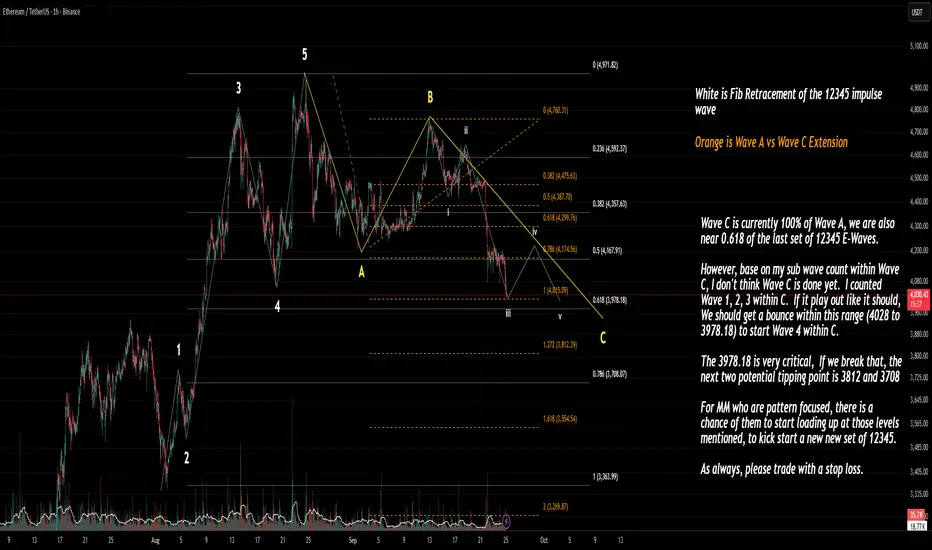
Elliott Wave Ethereum / Fibonacci LevelWave C Progress:
Wave C has already reached 100% of Wave A.
Price is sitting near the 0.618 retracement of the previous 12345 impulse wave.
Subwave Count Inside Wave C:
I have counted Waves 1, 2, 3 inside C.
If this sub-count is correct, a Wave 4 bounce is expected soon in the 4028 – 3978 zone.
Critical Levels
4028 – 3978.18: Expected bounce range (Wave 4 inside C).
3978.18: Key level — breaking it opens the door to deeper downside.
If broken, the next supports are:
3812 (1.272 extension)
3708 (0.786 retracement of entire impulse)
Implications
If 3978 holds, ETH may stage a corrective bounce (Wave 4) before a possible Wave 5 inside C.
If 3978 fails, 3812 and 3708 are the next tipping points where market makers/pattern traders might start accumulating for a new 12345 impulse set.
Watch for a bounce between 4028–3978.
Lose 3978, and 3812/3708 become the big decision zones for the next move.
ETHUSDT 1D chart Review1. Trendline (orange) - was clearly pierced down → it is a signal of weakening the growth moment.
2. Horizers of support / resistance:
• Resistance: $ 4,604 (strong), above $ 4,960.
• Support: $ 4 150 (currently tested), next $ 3,958 and $ 3,696.
3. Price - currently ~ 4 169 $, i.e. right with the support of $ 4 150.
4. Candles - a strong inheritance candle after piercing the trend → weakness signal.
5. STOCHASTIC RSI - in the sales zone (<20), which may suggest the possibility of short -term reflection.
⸻
🔹 Application:
• Short date: possible reflection from $ 4 150 thanks to the sale (technical bounce).
• average date: If level $ 4 150 breaks and the candle closes below → the road opens to $ 3,958 and even $ 3,696.
• Only a return above $ 4 272 and a retest trendline from below would give a signal of buyers.
⸻
👉 To sum up: The market is in the critical zone - support $ 4 150 decides.
• Bull: keeping the defense of this level + reflection from the sale.
• Bear: loss $ 4 150 = greater correction in the direction of $ 3 950–3 700.

ETHDCA zone 4100-4000 , Targeting 4384. Losing the 4150 area could potentially lead us down to the lower range where steeper liquidity is. considering BTC will be bouncing from 110k to 114k.

#ETHUSDT 4H ChartPrice is still consolidating with no major changes. MACS is neutral, RSI is sold and EMAs are turning bearish. Price needs to break and close above the resistance at $4,275 in order to expect further bullish movements. Waiting for confirmation.

ETH is Sinking Deep: Strong Downtrend and Big SELL Opportunity!Currently, ETH/USDT is under strong selling pressure due to both fundamental and technical factors . According to the latest news, over 2.6 million ETH (equivalent to about $11.7 billion ) is waiting to be withdrawn from the Ethereum network. When these ETH are released, it will create significant selling pressure, greatly affecting ETH's price in the short term. This could lead to investor anxiety and a potential sell-off, diminishing confidence in the market.
From a technical perspective , the chart shows a descending wedge, with lower highs and the current bottom becoming weak. It is highly likely that ETH will drop to the support level at $4,110 before making any new moves.
Given these factors, the appropriate trading strategy is to open a SELL order if the price cannot break through the resistance at $4,410 and falls below the support at $4,110. The Stop Loss should be placed at $4,450, just above the resistance, and Take Profit at $4,110.
In conclusion, ETH is facing a strong downtrend in the short term. Investors should keep an eye on the market and open a SELL order as the price continues to drop.

ETH Accumulation TrapdoorTrade Type: Controlled Bounce Long
Smart-money accumulation schematic, not trend breakout
3x Leverage (Max)
Valid potential 3–7 day tactical window
Pre-October macro bull run move
🔸 Entry Zone 1: $3,999 – $4,010
Must see all:
Only if 5m/15m BOS + FVG tap
LTF volume spike into structure
Bullish engulfing over previous 3 candles
Low skew in funding (<0.1%)
No macro weakness on BTC/ES
🔸 Entry Zone 2: $3,880 – $3,900
Must see all:
4H order block/FVG fill
LTF CHoCH + BOS
Wicking below $3,888 followed by fast recovery
No 4H close below $3,850
Entry 1 fills first, Entry 2 follows only if pullback comes.
Hard Stop: $3,800
Stop details: 1H/4H close + follow-through. Total exit. No re-entry without full reanalysis.
Soft Exit Protocols
At $3,850 sweep + spike: reduce 50%
$3,820 close without reversal: scale out 75%
HTF bearish engulfing near $3,800: full exit
TP Protocol
TP1: $4,130
Auto-sell 60% of position
TP2: $4,250
Close remainder or trail to $4,320
Optional TP3: $4,320 – $4,350
For breakout runners only
Trail SL under 1H swing low every $15 move
For Emergency Re-Entry
Scenario: ETH dumps to $2,950 – $3,050
Do not long immediately
Wait for:
Long lower wick rejection
New bullish FVG on 15m/1H
BOS back above $3,150
Then: Long with original TP plan, new SL = $2,850
Risk
Risk per Trade: 1.5% max account equity
Entry 1: 40% allocation
Entry 2: 60% allocation
NO compounding or pyramiding
Leverage Rules
Max 3x isolated
Must have 4H stop loss placed in system
Immediate invalidation:
If BTC breaks below $110.6K: close all ETH longs
If funding spikes above 0.18%: scale down or exit
Not financial advice.

Ethereum analysisIt’s been nearly 44 days that the price has been moving inside a range, and now it has reached the bottom of the range channel.
On the higher cycles, Ethereum’s trend is bullish, and as long as the 3700 support zone is not broken, we should continue to look for long positions.
There’s also a high probability that the price will move toward the decision-making zone. ✅
ETH ANALYSISETH has broken above the long-term trendline, a major structural shift on the weekly chart.
From here, I think price may pull back to retest the trendline along with the bull market support band.
If that retest holds and momentum stays constructive, ETH could bounce strongly and eventually push toward making a new all-time high.
🎯 Conclusion: My view is bullish in the bigger picture — I expect ETH to retest the trendline and bull market support band before attempting a major breakout to new highs.

Eth max pain on this Friday is 3600This Friday :
Btc option max pain 110k
Eth option max pain 3600
We are noticed that 3966 is the 0.382 fibo support for the past 3 weeks uptrend wave. But,
Please don't long at 3966 in this week.
This week trading strategy should be short at 4400. Eth need to test STR (support turn resistance) area before drop. and short it all the way to 3600.
If u like mine trading idea. Please hit me a like, rocket and leave a comment for me.

ETH/USDTCurrently trading in a local consolidation, moving within its range expansion.
After a deviation below the range low, long setups can be considered — but only if confirmation conditions are met.
Potential short opportunities may appear in the 4400–4500 zone, again only with proper confirmations.

Ethereum 3 month candle 1 week left for the 3 month candle to close if it closes about the 3700 resistance then chances are it will continue the up trend hopefully it holds. To much interest from institutions buying eth no way it falls back down again

ETH/USD: Correction Continues, Key Support at 4062.50ETH/USD trades within a long-term bullish trend, but after the Fed’s recent rate cut the pair moved into a correction. Price is testing the lower boundary of the short-term range 4687.50–4062.50 (Murray – , Fibo 23.6%).
• A breakout below 4062.50 could extend the decline toward 3540.00 (Fibo 38.2%) and 3125.00 (Murray , Fibo 50.0%).
• A breakout above 4687.50 would confirm bullish continuation to 5000.00, 5312.50, and 5625.00.
⸻
🔎 Indicators
• Bollinger Bands: flat, range-bound trading.
• MACD: preparing to cross into negative.
• Stochastic: oversold, possible upward reversal.
• Weekly trend remains bullish, but correction toward 3540.00 is possible.
⸻
🏷️ Key Levels
• Resistance: 4687.50, 5000.00, 5312.50, 5625.00
• Support: 4062.50, 3540.00, 3125.00
⸻
📈 Trading Plan
Scenario 1 – SELL STOP
• Entry: 4062.45
• TP: 3540.00, 3125.00
• SL: 4500.00
• Timeframe: 1W
Scenario 2 – BUY STOP
• Entry: 4687.55
• TP: 5000.00, 5312.50, 5625.00
• SL: 4490.00

#ETHUSDT 4H ChartPrice is consolidating on lower timeframes showing no major movements. MACD is showing bearish weakness, RSI is oversold and EMAs are turning bearish. Price is expected to move up and retest the S/R Flip at $4,260 as a short-term target.

Ethereum (ETH): EMAs Have Been Broken | RSI Oversold | Bullish!ETH has broken the lines of EMAs, which have been long-time trend holders, yet this has to be done one way or another to sweep the liquidity from the markets.
Now that is past us,. We are seeing some signs of recovery, where candles are forming some kind of market structure break and taking into consideration that RSI is oversold, EMAs had a sharp breakdown without any retest, and the fact that we are in a bull market overall is a strong sign of potential recovery to happen so that's what we are looking for—the game plan remains the same!
Swallow Academy

ETH 1H Wave Check📊 Current Setup
ETH’s movin’ like BTC’s lil’ bro rn — same structure on the lower TFs. Price is cruisin’ inside that 4125–4200 zone consolidation box.
🚦 Scenarios
👉 If price pops out the top of that box, first wave could send us ridin’ toward $4400 🏄💸.
👉 But without a clean breakout, it’s just sideways chop — patience is still the play.
🧭 My Take
This is classic “wait for the set” surf energy 🌊. No breakout, no ride. Rules of the gang 😏.
❓ What’s Your Vibe?
You think ETH’s ready to catch that next wave, or will it stall out under 4200? Drop your read below 👇

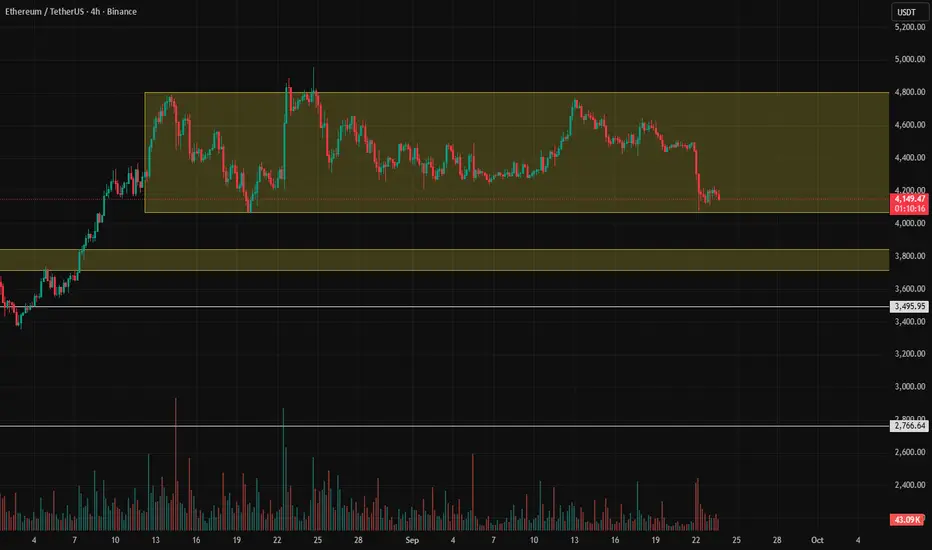
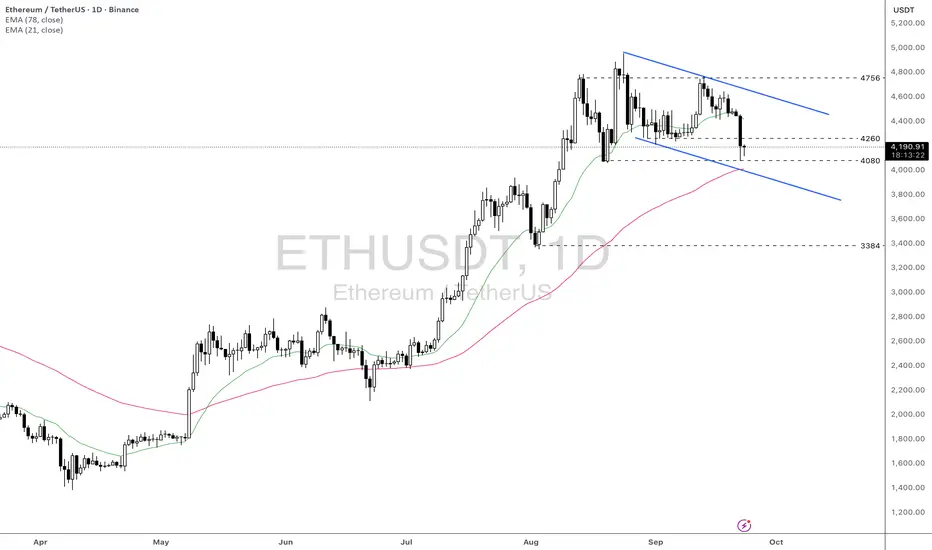
ETH this week: stabilization after liquidations and ETF flows inFundamental approach
- ETH prices slipped this week amid a broad crypto pullback following a weekend wave of leveraged liquidations and profit-taking, even as prior spot ETF inflows and easing Fed policy supported risk appetite earlier in the week. Sentiment was volatile as traders digested mixed ETF flow signals and macro easing after the Fed's rate cut.
- The main impacting factors included a reported $1.5B in crypto long liquidations, which are pressuring majors. ETH prices posted their weakest two-day stretch since late Aug as risk unwound into Monday's session. Offsetting factors were mid-Sep net inflows into US spot ETH ETFs, led by BlackRock's product, and growing anticipation for Dec's Fusaka upgrade aimed at scaling Layer 2 data capacity.
- In the near term, ETH could stabilize if ETF flows remain favorable and macro conditions stay supportive; however, further deleveraging and data-sensitive risk sentiment could keep swings elevated. Upcoming catalysts include continued daily ETF flow prints, developer communications around the Fusaka timeline, and features that may influence medium-term adoption.
Technical approach:
- ETHUSD is forming a lower high and lower low pattern within the defined range of 4080-4756. The price is awaiting a clear breakout to determine the upcoming trend.
- If ETHUSD breaks below the support at 4080, EMA78, and the descending channel's lower bound, the price may retest the following support at 3384.
- On the contrary, closing above 4260 may help ETH prices gain momentum to retest the descending channel's upper bound.
Analysis by: Dat Tong, Senior Financial Markets Strategist at Exness
AI Trading Future in Global TradeChapter 1: Evolution of Trading in the Global Economy
To understand the role of AI in global trade, it’s important to trace the evolution of trading systems:
Manual Trade Era (Pre-20th Century):
Trade was conducted through physical exchanges, manual record-keeping, and human negotiation. Market knowledge was limited, and trading was highly localized.
Industrial Trade Era (19th–20th Century):
The rise of banks, stock exchanges, and global shipping allowed trade to scale. Telegraphs and later telephones enabled faster communication, but human decision-making still dominated.
Digital Trade Era (Late 20th Century):
Computers, internet, and digital platforms enabled electronic trading. Global trade volumes multiplied, and finance became increasingly algorithm-driven.
AI-Driven Trade Era (21st Century Onwards):
AI introduced self-learning systems capable of analyzing global data, predicting risks, and automating trades at lightning speed. AI isn’t just helping human traders—it is becoming a trader in its own right.
Chapter 2: AI in Global Trade – Key Dimensions
AI’s role in global trade is multi-dimensional. Let’s break it down into areas where it is most impactful:
2.1 AI in Financial Trading
Algorithmic Trading: AI algorithms execute stock, currency, and commodity trades within milliseconds, capturing opportunities humans would miss.
Risk Management: AI models analyze geopolitical risks, currency fluctuations, and commodity price swings to protect investments.
Prediction Models: Machine learning tools predict demand and price trends based on historical patterns, news, and even social media sentiment.
2.2 AI in Supply Chain & Logistics
Predicting demand and inventory needs across borders.
Optimizing shipping routes using AI-powered logistics systems.
Detecting disruptions such as port delays, natural disasters, or conflicts.
Automating customs and compliance checks with AI-driven platforms.
2.3 AI in Trade Finance
Credit Assessment: AI evaluates the financial health of buyers/sellers faster than banks traditionally do.
Fraud Detection: Machine learning spots suspicious trade transactions to reduce global trade fraud.
Smart Contracts: Blockchain combined with AI automates payments once shipment conditions are met.
2.4 AI in Policy and Regulation
Governments and international organizations are adopting AI to:
Monitor illegal trade and smuggling.
Predict economic impact of tariffs and sanctions.
Strengthen cybersecurity in financial systems.
Chapter 3: Opportunities Created by AI Trading in Global Trade
The fusion of AI and trade opens up massive opportunities:
Efficiency Gains
Faster decision-making in trading.
Reduced human error and biases.
Optimized global logistics saving billions in costs.
Wider Market Access
Small businesses in developing nations can use AI platforms to connect with global buyers.
AI-powered marketplaces lower barriers to entry.
Risk Reduction
AI predicts financial and political risks, reducing trade shocks.
Helps governments stabilize currency and commodity markets.
Personalization in Trade
AI allows companies to customize global offerings based on regional consumer preferences.
Green & Sustainable Trade
AI helps optimize energy-efficient shipping and sustainable sourcing.
Chapter 4: Risks and Challenges
No revolution comes without challenges. AI in global trade has its share of risks:
4.1 Economic Risks
Market Manipulation: Powerful AI trading systems could manipulate markets for unfair advantage.
Job Displacement: Traditional roles in trade, logistics, and banking may be automated.
4.2 Ethical Risks
Bias in AI Models: Trade finance models may disadvantage certain countries or small players.
Transparency Issues: Black-box AI models make it hard to explain why certain trade decisions were made.
4.3 Geopolitical Risks
AI Arms Race: Nations may compete in developing the most powerful AI for trade dominance.
Cybersecurity: AI-driven trade platforms may become targets for hackers.
4.4 Regulatory Challenges
Lack of global standards for AI in trade.
Difficulty in monitoring cross-border AI trading platforms.
Chapter 5: Case Studies of AI in Global Trade
Alibaba’s AI-Powered Logistics (China):
Alibaba uses AI to predict demand and optimize shipping routes for global e-commerce.
IBM Watson in Trade Finance:
IBM Watson is helping banks automate trade finance document verification, reducing fraud.
AI in Shipping (Maersk):
Maersk deploys AI to optimize container routes and predict shipping delays.
Stock Market AI (Wall Street & NSE):
High-frequency trading firms deploy AI to trade currencies, equities, and commodities at scale.
Chapter 6: The Regulatory Landscape
The future of AI in global trade also depends heavily on how it is regulated.
World Trade Organization (WTO): exploring frameworks for AI-driven trade.
National Governments: building AI ethics laws and data protection rules.
Global Cooperation: need for cross-border agreements to regulate AI-driven trading.
Chapter 7: The Future of AI Trading in Global Trade
Looking ahead, AI trading will evolve along these lines:
Hyper-Automation of Global Markets
AI will handle most cross-border transactions with minimal human intervention.
Decentralized AI Trading Platforms
Blockchain + AI will power decentralized global trade, reducing dependence on intermediaries.
Digital Currencies & CBDCs
Central Bank Digital Currencies (CBDCs) combined with AI will redefine cross-border payments.
AI as a Trade Negotiator
Future AI systems may simulate global economic outcomes to guide tariff and trade negotiations.
Sustainable Global Trade
AI will optimize carbon-neutral logistics and eco-friendly sourcing.
Inclusive Trade
AI will help SMEs from developing nations gain global visibility, narrowing inequality gaps.
Chapter 8: Balancing Innovation and Responsibility
The key challenge lies in balancing AI-driven innovation with responsibility. Stakeholders must:
Build transparent AI systems.
Create fair trade algorithms.
Ensure inclusivity in access.
Develop strong cyber-defense systems.
Foster international cooperation.
Conclusion
AI trading is not just a technological shift—it is an economic revolution that will reshape the foundations of global trade. From stock exchanges in New York to shipping ports in Singapore, from small e-commerce sellers in Africa to regulators in Geneva, every actor in global trade will feel the impact.
The future is promising: faster, more efficient, and more inclusive trade powered by AI. But it also demands vigilance, regulation, and global collaboration to prevent misuse. If harnessed wisely, AI could become the great equalizer in global trade, bridging gaps, reducing risks, and creating a sustainable, interconnected world economy.

Ethereum to NEW ALL TIME HIGHBecause Ethereum holds above the critical 4000 support level, the bullish divergence on the daily RSI could drive it to break the 4800 resistance.
