ETHEREUM LAST STAND..Ethereum is above the daily EMA100 and long-term support line, with bullish RSI divergence, making me very bullish on Ethereum from here.
ETHUSDT.3S trade ideas

ETHUSDT - Faces Downtrend👋Hello everyone, glad to see you again. Let’s take a look at BINANCE:ETHUSDT !
Currently, Ethereum is moving in a clear downtrend. After breaking through the support zone, the decline has intensified. The current resistance levels are around 4,300 USD and 4,450 USD. If the support at 4,100 USD is not held, ETH may continue to experience further correction.
With the Fed's rate cuts and geopolitical issues like the Russia-Ukraine conflict increasing market instability, capital is flowing out of riskier assets like cryptocurrencies. This will continue to put downward pressure on ETH.
Unless there's a reversal from this zone, the strategy and scenario mentioned above seem likely. My target is a short-term price decline. What about you?
Feel free to leave your thoughts in the comments below.
Good luck!

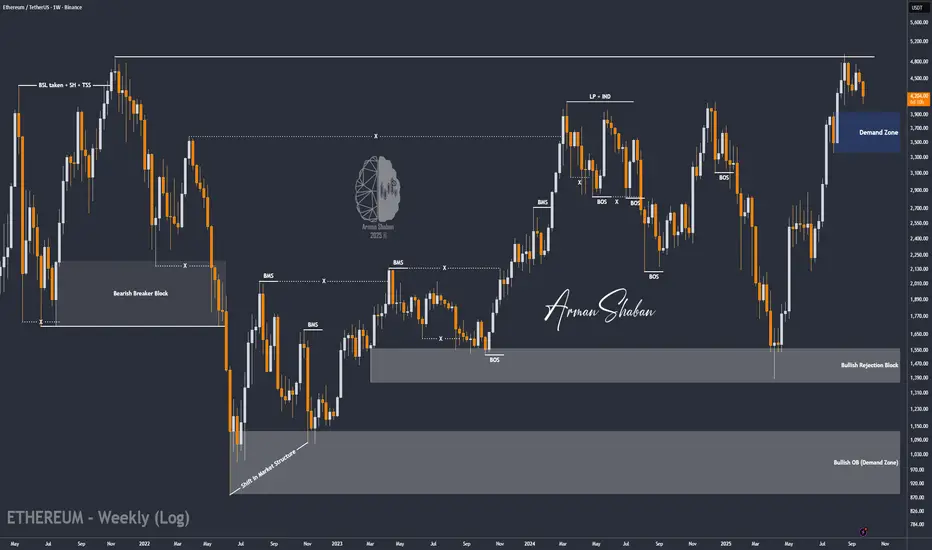
ETH/USDT | Correction Over? Big Rally Loading After Demand ZoneBy analyzing the Ethereum chart on the weekly timeframe, we can see that after Bitcoin’s heavy dump , ETH also corrected and is now trading around $4,200 .
Based on the previous analysis, the $3,300–$3,900 zone is still a key demand area. If the price enters this zone, I expect Ethereum to start its next bullish wave.
The possible upside targets for this rally are $5,100, $5,500, and $6,000.
Please support me with your likes and comments to motivate me to share more analysis with you and share your opinion about the possible trend of this chart with me !
Best Regards , Arman Shaban
Ethereum Update📊 Current Setup
ETH is retesting a key resistance zone after that bounce, sitting around $4,050–4,100. This pocket’s acting like a supply zone — unless bulls come in stacked with momentum, we’re likely lookin’ at rejection.
🚦 Scenarios
👉 If rejection confirms, ETH could ride down toward the $3,750–3,800 support. That zone’s critical — not just short-term demand, but a big piece of ETH’s long-term trend structure.
👉 If bulls defend hard and flip the zone, we could be lookin’ at the base for a bigger recovery move.
👉 But if that support cracks, the midterm bearish tide deepens 🐻.
🧭 My Take
Right now it’s patience mode. Resistance looks heavy, and a short-term dip from here could be in play — but only with minimum exposure. Protect the bag first, ride the wave second 🌊.
💬 What do you think about this scenario? Only share your idea if you’ve got another opinion — otherwise just hit that button 👍

Ethereum Recovery: Watching 4,229 for Bullish ConfirmationAt the moment, Ethereum is also showing recovery, but at a slower pace compared to Bitcoin. This week’s pivot point is at 4,137 , and the price is currently trading above it.
A local correction would be reasonable, with support expected in the 4,050 – 4,000 range. There’s also an ascending trendline acting as support. The risk level is 3,966 — if it breaks and the price fails to reclaim it, the likelihood of continued downside increases.
A breakout above 4,229 and consolidation would bring back a bullish outlook.

ETH - Near ATH… Price Discovery Reload?BINANCE:ETHUSDT ETH has marched back to its cycle ceiling on the weekly after a long range. We’re now pressing the final resistance band around $4,880–$5,000—where a clean breakout would shift ETH into price discovery again.
Confluence is strong here: prior ATH supply + round-number magnet + momentum structure. If buyers clear $5K with a weekly close, I’ll look for the next leg toward $6.5K–$7.25K, then a stretch path into five digits as discovery unfolds. If rejected, a healthy retest toward $4,100–$3,550 would keep the uptrend intact while the range persists.
What’s your plan => buy the weekly breakout above $5K, or wait for a dip into $4.1K for better risk–reward? 🤔
⚠️ Disclaimer: This is not financial advice. Always do your own research and manage risk properly.
📚 Stick to your trading plan regarding entries, risk, and management.
Good luck! 🍀
All Strategies Are Good; If Managed Properly!
~Richard Nasr

ETH 4H trade Idea Here is an idea to trade Ethereum on 4 hour TF. Entry and Exit points are given. NFA DYOR

ETH | 6 Hrs | Long | Target +10%This technical analysis is for informational and educational purposes only. It does not constitute financial advice. Remember to always research and consult with a professional before making investment decisions. Good luck! 📈💼🚀

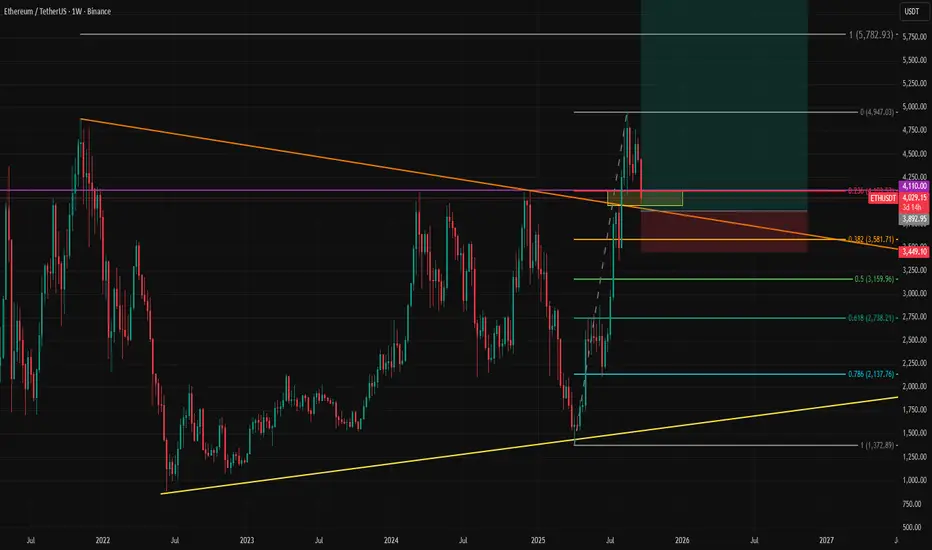
ETHUSD Retests Broken Trend on Weekly TimeframeEthereum is retesting the broken trendline and is likely setting up for another leg higher. Unless there is persistent pricing below $4,000, this selloff is likely to become a buying opportunity for those who missed the earlier rally.
Our year-end (or end of the first quarter of 2026) target above $7,000 still stands. The main risk is a potential selloff in the US stock market, which could drag crypto lower if the correlation remains intact.
Liquidity Shift Suggests Extended Bearish CycleThe market is showing a progressive decline after losing upward strength. Recent swings indicate a decisive bearish control, with successive shifts in structure confirming the downward pressure. Attempts to recover higher levels have been shallow, reflecting exhaustion on the buy side and stronger liquidity flow toward sellers.
Market behavior suggests that rallies are being used as opportunities to exit or reposition short rather than initiate sustained bullish momentum. This is consistent with the overall weakening tone across the chart, where volatility spikes have favored downward extensions.
Looking ahead, if the current pace of distribution continues, the market is likely to maintain a bearish trajectory with potential for deeper declines as liquidity seeks out lower price ranges.

ETH : Accumulation Before Next Big Rally??Ethereum continues to show strength on the weekly timeframe.
Weekly structure remains firmly bullish, IMO. Pullbacks are natural, but the weekly structure favors continuation.
Weekly closing about 4.2-4.3K could trigger massive rally on weekly TF.
Chart is self explanatory. This is purely my interpretation of the chart and it could go wrong.
Note: This post reflects my personal views for educational purposes. It is not financial advice. Always DYOR before making any and every decision.

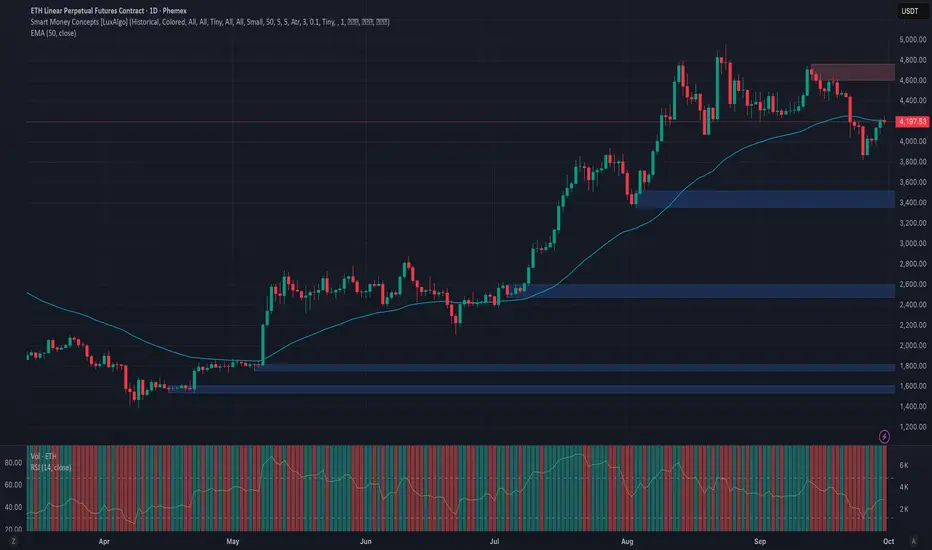
Phemex Analysis #107: Pro Tips for Trading Ethereum (ETH)Ethereum (ETH) has pushed back into the spotlight after shaking off early‑summer weakness and reclaiming the psychological $4,000 handle. With price now hovering near $4,200, buyers have stepped back in and the daily chart shows a clean sequence of higher lows—story beats that often precede a decisive move. The question on every trader’s mind: does ETH press higher from here, or does it need one more reset before the next leg?
Possible Scenarios
1) Bullish Breakout — momentum carries above nearby supply
If ETH can extend above the immediate supply zone (watch the $4,300–$4,350 band) on rising volume, a trend continuation opens toward $4,500 and a stretch into $4,800.
Pro Tips:
Entry: Look for a strong daily close through $4,350 or a break‑and‑retest that holds as support.
Risk: Initial stop below the breakout zone (~$4,000), then trail under higher lows.
Profit‑taking: Scale out into $4,500 and $4,800 while leaving a runner if momentum expands.
2) Range & Accumulation — base building above $4,000
ETH may continue to coil between $4,000 support and $4,350 resistance while the market digests macro cues and liquidity rotates across majors.
Pro Tips:
Plan the box: Accumulate near $4,000, lighten up into $4,300–$4,350.
Avoid the middle: Wait for edges; don’t chase mid‑range noise.
Watch volume: Expansion at range edges often telegraphs the break direction.
3) Bearish Pullback — liquidity sweep into deeper supports
Failure to hold $4,000 on heavy sell volume invites a deeper flush toward $3,750 and, in a heavier risk‑off tape, $3,500.
Pro Tips:
Defense first: Cut risk on a decisive daily close below $4,000.
DCA with discipline: Long‑term bulls can consider staggered bids only after stabilization (shrinking candles, waning sell volume, higher‑low attempts) near $3,750 / $3,500.
Re‑entry tells: Look for momentum divergences or a strong reclaim of $4,000 to re‑engage.
Conclusion
ETH sits at a pivotal zone with a clear if/then map:
If $4,350 breaks and holds → ride the trend toward $4,500–$4,800.
If the range persists → harvest the $4,000–$4,350 box with tight risk.
If $4,000 fails → wait for stabilization at $3,750 / $3,500 before redeploying.
Anchored by deep liquidity, relentless builder activity, and a maturing staking and L2 ecosystem, Ethereum remains the market’s bellwether. Trade the levels, respect the tape, and let structure—not emotion—drive your decisions.
🔥 Tips:
Armed Your Trading Arsenal with advanced tools like multiple watchlists, basket orders, and real-time strategy adjustments at Phemex. Our USDT-based scaled orders give you precise control over your risk, while iceberg orders provide stealthy execution.
Disclaimer: This is NOT financial or investment advice. Please conduct your own research (DYOR). Phemex is not responsible, directly or indirectly, for any damage or loss incurred or claimed to be caused by or in association with the use of or reliance on any content, goods, or services mentioned in this article.
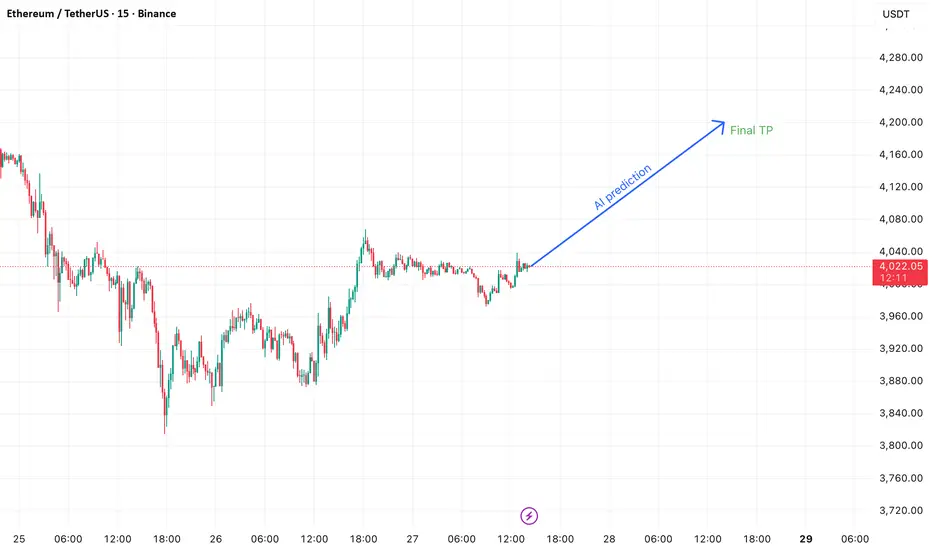
Deep Learning Model for 24-Hour ETH Price PredictionHi everyone,
I’ve developed a deep learning AI model designed to predict ETH’s price movement over the next 24 hours on the 15-minute timeframe.
It’s important to note that this model does not directly provide exact entry points for trades. Instead, it indicates the likely direction of the market, meaning you’ll still need basic trading knowledge to apply it effectively.
After testing it over the course of one month, I achieved a success rate of around 90% in my trades when using the model as part of my strategy.
The model was trained using the following features:
Time-related: Hour, DayOfWeek
Price & volume lags: Close_lag_1, Close_lag_2, Close_lag_4, Close_lag_8, Close_lag_12, Volume_lag_1, Volume_lag_2, Volume_lag_4, Volume_lag_8, Volume_lag_12
Moving averages & statistics: MA_4, Std_4, Dist_MA_4, MA_16, Std_16, Dist_MA_16, MA_48, Std_48, Dist_MA_48, MA_96, Std_96, Dist_MA_96
Technical indicators: Return_log, MACD, RSI
Hourly Forecast for the Next 24 Hours
2025-09-27 13:00:00+00:00 4026.482613
2025-09-27 14:00:00+00:00 4028.550190
2025-09-27 15:00:00+00:00 4036.481202
2025-09-27 16:00:00+00:00 4044.217143
2025-09-27 17:00:00+00:00 4051.725418
2025-09-27 18:00:00+00:00 4059.018598
2025-09-27 19:00:00+00:00 4066.029393
2025-09-27 20:00:00+00:00 4072.871648
2025-09-27 21:00:00+00:00 4079.563074
2025-09-27 22:00:00+00:00 4086.117364
2025-09-27 23:00:00+00:00 4092.561460
2025-09-28 00:00:00+00:00 4098.897422
2025-09-28 01:00:00+00:00 4107.330284
2025-09-28 02:00:00+00:00 4116.884113
2025-09-28 03:00:00+00:00 4126.399899
2025-09-28 04:00:00+00:00 4135.863390
2025-09-28 05:00:00+00:00 4145.268831
2025-09-28 06:00:00+00:00 4154.576873
2025-09-28 07:00:00+00:00 4163.768272
2025-09-28 08:00:00+00:00 4172.835229
2025-09-28 09:00:00+00:00 4181.770921
2025-09-28 10:00:00+00:00 4190.570690
2025-09-28 11:00:00+00:00 4199.232384
2025-09-28 12:00:00+00:00 4207.754681
2025-09-28 13:00:00+00:00 4216.138168
ETHUSDT Daily Analysis – Key Downtrend & Swing SetupEthereum is currently in a downtrend after the sharp surge toward $5,000. This move lower was expected following the extended bullish rally.
Looking ahead, I see a high probability of ETH reaching the $3,730 daily support. This level is a key swing trade setup and could serve as the foundation for the next big leg upward, potentially supporting a push toward a new all-time high in the longer term.
🔑 Technical Levels – Support & Stop Loss
📍 $3,730 | SL: $3,536 (Daily support – key swing setup)
📍 $2,680 | SL: $2,481 (Weekly support – deeper retracement zone)
Bias: Bearish in the short term while ETH remains under $4,400, but turning strongly bullish long term if $3,730 holds as support.
📊 Fundamental Insight
Regulatory uncertainty continues to weigh on crypto sentiment in the short term.
On-chain activity shows resilience, with active addresses and DeFi usage stabilizing.
Institutional demand remains present, with ETH staking and ETF developments reinforcing long-term value.
Overall, ETH is consolidating after an extended run. A retest of support zones could present high-probability swing opportunities for patient traders.
👉 If you find this content helpful, don’t forget to like & follow for more daily analysis.

Eth/usdt Technical Outlook📊 ETH/USDT Technical Outlook
Current Price: $4,157
Resistance Zones:
• $4,400 – first major test, aligned with short-term supply and 20/50-day MAs
• $4,550 – $4,600 – stronger resistance, breakout level for bullish continuation
Support Zones:
• $4,000 – psychological level & local structure support
• $3,900 – critical floor; a break here could accelerate downside to $3,600
Trend & Moving Averages: ETH is trading below its 20- and 50-day moving averages, showing short-term selling pressure. Trend remains bullish on higher timeframes but under consolidation.
Momentum (RSI): Neutral-to-slightly bearish, not oversold, meaning ETH has room to either break down further or rebound.
Scenarios:
🔻 Bearish: If ETH loses $4,000–$3,900 support, expect selling pressure toward $3,600.
🔺 Bullish: A strong daily close above $4,400 would shift momentum, with the next target at $4,550–$4,600. Sustained breakout could open path toward $4,800.

ETH/USDT Buy-Stop on 1H, Bullish Trend + Bullish DivergenceEther is showing a Bullish Trend on 1H Timeframe. Recently, it also showed a Bullish Divergence on same timeframe. However, there is a slight resistance ahead as well.
So, we can take the risk of taking a 1:1 risk-to-reward "Buy" trade here. Let's see how it goes.
29-09-25
Monday

ETHUSDT BUY AND HOLD ITI think it is a good time to buy Ethereum and hold it until higher targets. Ethereum has entered the weekly demand zone and has started its uptrend on the 1-hour and 4-hour time frames.

ETH target 7100 areaIn my view after a rebound ETH will dump to 3600 area before resuming bullish trend, my target is 7100 area

ETHEREUM → False breakout of 4100. Panic?BINANCE:ETHUSDT is forming a false breakout of resistance on the daily chart, formed by the ATH of the previous bullish cycle - 4100. Closing below this level could cause panic in the market...
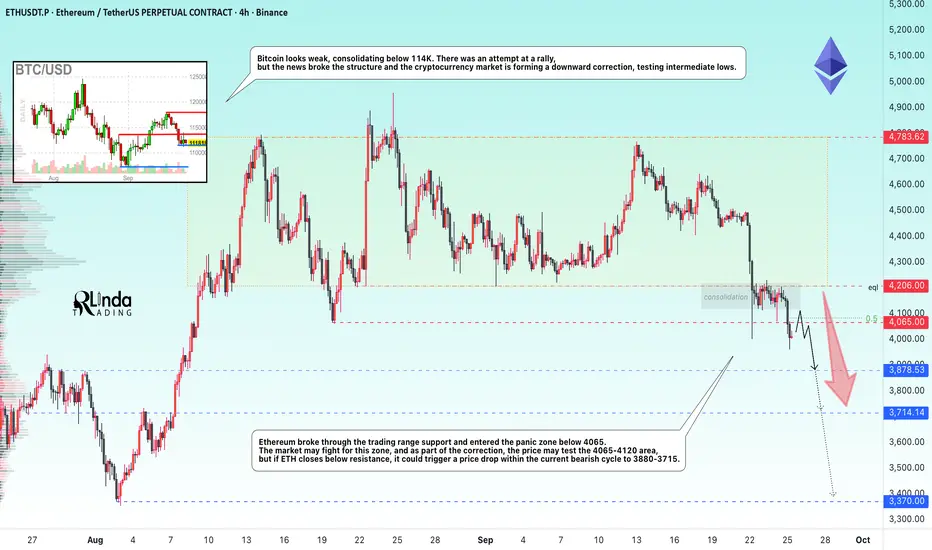
Bitcoin looks weak, consolidating below 114K. There was an attempt at a rally, but the news broke the structure and the cryptocurrency market is forming a downward correction, testing intermediate lows.
Ethereum broke the support of the trading range and entered the panic zone - below 4065. The market may fight for this zone, and as part of the correction, the price may test the 4065-4120 area, but if ETH closes below resistance, it could trigger a price drop within the current bearish cycle to 3880-3715.
Resistance levels: 4065, 4120, 4206
Support levels: 3880: 3715, 3370
On D1, the structure is weak, the price breaks through 4100-4090 and consolidates in the sales zone. Everyone who bought above 4100 can now start active sales due to the activation of stop orders, panic, fear, and the reversal of their positions. If the market does not receive support (bullish driver), the correction may continue. The nearest target is 3878 - 3715 7 3400
Sincerely, R. Linda!
Ethereum (ETH): Reclaim of Re-Test and 100EMA | Bullish Monday ETH started the week with a bullish tone after bouncing from the 100EMA and reclaiming the breakout zone.
Yesterday’s candle showed clear buyer strength, and today’s continuation keeps the pressure on the upside. As long as this level holds, we are watching for a break of structure on the upper zones — that’s the next step, and after that only a new ATH!
Swallow Academy

#ETHUSDT (4H Chart)#ETHUSDT
(4H Chart)
🔹️ Ethereum Analysis 🔹️
For Ethereum, we have two important resistance levels that could lead to a significant correction:
🔴 Resistances (marked with red boxes):
🎯 First range: 4260 to 4352 USD
🎯 Second range: 4550 to 4635 USD
Supports:
🟡 Yellow box (short-term support): 3525 to 3445 USD — likely to be touched if Bitcoin reaches 100,000 USD
🟢 Green box (main support): 2800 to 2700 USD
💡 Summary:
We expect a small initial rise, then a correction down to the yellow box, and after the yellow box is touched, this analysis will be updated.
🚀 If you enjoyed this analysis, please give it a boost 💙
And to not miss any new analyses or setups, make sure to follow me 📊
🆔️ @Rasoolahmadi

#ETHUSDT 4H ChartPrice is currently ranging inside the 6h supply zone after getting rejected from the 100MA. MACD is showing bullish weakness, RSI is bought and EMAs are neutral. Price needs to break and close above this supply zone in order to expect further bullish movements towards the 6h supply at $4,450.

ETHUSDT.PThe setup has been marked. Personally waiting for the retesting with strong volume before getting in the trade.
Keep supporting guys keep following please.
