ETHUSDT: Short-Term Pullback Toward Trendline Before PotentialHi guys!
On the current 1h chart, Ethereum shows a clear structure of recovery following a liquidity sweep marked as “Hunting happened.” This move indicates that liquidity below the previous lows has already been collected, creating a potential base for a short-term bullish correction.
Price is currently consolidating above a minor support zone (highlighted in pink), showing a possible accumulation phase. The projected path suggests a potential bullish move toward the major supply zone around $4,080–$4,180, which aligns with the descending trendline acting as dynamic resistance.
However, given the overall bearish market structure and the dominance of the descending trendline, the area around $4,100 could serve as a strong reaction zone. A rejection from this level would likely confirm continuation of the broader downtrend, with a possible retracement toward the $3,700–$3,750 area.
Trade ideas

Ethereum (ETH/USDT): Possible Short OpportunityHi guys!
ETH is currently testing the ascending trendline support after forming a potential lower high near the $4,165 zone. The structure shows early signs of weakness as buyers failed to maintain momentum above the last swing top.
A clean break below the trendline could confirm a short-term bearish shift, targeting the $4,030–$4,000 support zone, which aligns with the previous breakout level. The invalidation of this setup would occur if the price breaks and holds above $4,165, signaling renewed bullish momentum.
important levels:
Resistance: $4,165
Support: $4,030 – $4,000
Bias: Bearish below $4,165

Ethereum Faces Bearish Pressure After 0.618 Fibonacci RejectionEthereum price action is displaying clear local weakness, with signs pointing toward a potential rotation back to high-timeframe support at $3,385. The recent rally failed to break above the prior swing high, instead forming a lower high — a signal of fading bullish momentum.
The rejection at the 0.618 Fibonacci retracement was accompanied by increased bearish volume, confirming that sellers have regained control in the short term. Price is now testing local support around $3,900, a crucial level that must hold to avoid triggering a deeper corrective phase.
Key Points:
- Rejection Zone: Ethereum was rejected at the 0.618 Fibonacci, confirming local weakness.
- Lower High Formation: Indicates loss of bullish structure and potential trend reversal.
- Critical Supports: $3,900 (local) and $3,385 (high timeframe) are the key downside levels to
watch.
From a structural perspective, Ethereum’s inability to sustain momentum signals growing bearish pressure across lower timeframes.
What to Expect:
If $3,900 fails to hold, expect ETH to rotate toward $3,385 support. However, reclaiming and closing above the 0.618 Fibonacci could invalidate the short-term bearish setup and reintroduce upside potential.

ETH/USDT: Price Decline Warning, Caution for Buy Opportunities!The ETH/USDT pair is currently facing clear downward pressure after failing to break through the strong resistance at 4,150.00. The 4-hour chart shows that Ethereum is moving in a short-term downtrend, with prices heading towards the important support level of 3,780.00. The strong rejection from this area indicates that the current market sentiment is leaning towards selling.
The market's cash flow also reflects short-term distribution, and the RSI indicator shows that ETH has previously entered overbought territory, and may continue to correct downward. These factors suggest that Ethereum could continue to face selling pressure, especially if the support levels are not strong enough to hold the price.
Impact of Recent News:
1. Australia's Core Inflation Data Rises Sharply: Australia's core inflation index increased by 1.0% in Q3, exceeding the forecast of 0.8%. This reduces expectations of a near-term rate cut and could affect ETH/USDT if the USD strengthens.
2. Expectations on U.S. Federal Reserve's Monetary Policy: The market expects the Fed to maintain high interest rates, which could strengthen the USD and put downward pressure on ETH/USDT.
Conclusion: Given the current downtrend and pressure from technical indicators, ETH/USDT is likely to continue decreasing over the next 48 hours. However, traders need to be cautious and closely monitor the support level at 3,780.00. If the price shows strong signs of recovery from here, it could present a good opportunity to enter the market.

Ethereum at a Crossroads: Accumulation vs. Profit-Taking DynamicHello everyone,
ETH is currently in an intriguing trading phase as technical factors and market capital flows are creating a clear conflict. Recent on-chain data shows that large wallets (whales) holding between 10,000 and 100,000 ETH are accumulating again – a sign that “smart money” is positioning ahead of a medium-term uptrend. However, in contrast, traditional institutional investors are reducing exposure or taking short-term profits, leaving the market without consensus and susceptible to strong liquidity sweeps in both directions.
On the macro front, the primary support for ETH comes from expectations that the US Federal Reserve (Fed) may cut interest rates by around 25 basis points at the next meeting. This would ease liquidity and drive capital back into risk assets like crypto. Simultaneously, ETH is no longer viewed merely as an altcoin – it is increasingly being positioned as a store of value and a core platform for tokenized assets, drawing serious attention from long-term investment funds.
On the 4H chart, ETH is trading around $4,214 after a strong rebound from the $3,900–$4,000 support zone. While the recovery is solid, price is approaching the technical resistance range of $4,220–$4,400, where unfilled liquidity gaps (FVGs) exist. This implies that profit-taking pressure is real, and rejection risks at this level are high without sufficiently strong news catalysts.
Personally, I lean towards the scenario where ETH may reach ~$4,270–$4,300 to test the upper resistance/liquidity zone, before potentially retracing to ~$4,000–$4,050 to retest buying strength. If support holds amid positive news (rate cuts, capital inflows), I believe ETH could pave the way for a more robust rally towards ~$4,500 or higher.
Which scenario do you favour – ETH preparing to “gather momentum” or merely a technical rebound before stronger selling pressure?

ETH Buy/Long Setup (1H)Considering the ranging movement and lower time frame confirmations, it seems that with the specified stop, Ethereum can yield profit based on the given setup.
The entry zone, targets, and stop are marked on the chart.
For risk management, please don't forget stop loss and capital management
When we reach the first target, save some profit and then change the stop to entry
Comment if you have any questions
Thank You

ETH soon will get the ticket of moonThe market structure for Ethereum has turned decidedly bullish following its decisive breakout above the key $4,400 level, which coincided with a major descending trendline resistance. A confirmed and sustained move above this level typically validates the strength of the breakout. This technical development suggests a high probability of a significant upward impulse, with initial projected targets residing in the $5,000 to $7,000 range.
DISCLAIMER: ((trade based on your own decision))
<<press like👍 if you enjoy💚

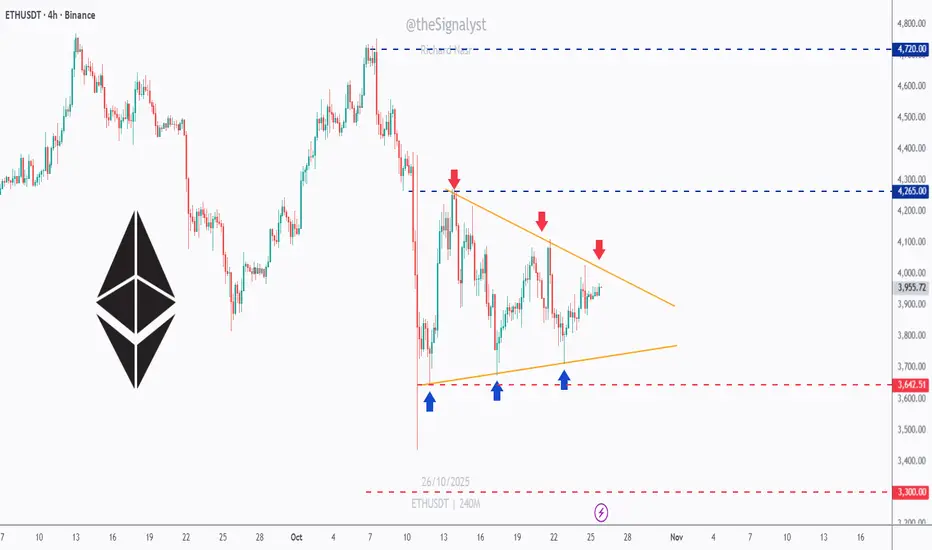
ETH - The Symmetrical Triangle of the Month!Ethereum has spent most of October coiling inside what can only be called the symmetrical triangle of the month => a textbook compression of volatility where both bulls and bears are building pressure for the next decisive move.
📦Price is trapped between the $4,265 resistance and $3,640 support, with multiple clear reactions from both boundaries. Each time ETH bounces off the lower orange trendline, buyers step in aggressively… but every push higher has been capped by lower highs, a perfect battle of strength versus patience.
The breakout from this formation will likely dictate ETH’s next major swing.
- A break above $4,265 could ignite a rally toward $4,720 and beyond.
- A break below $3,640, however, would expose $3,300, a strong historical demand zone.
⚔️ Until one side wins , it’s all about staying patient, waiting for confirmation, and letting the structure do the talking. The tighter this triangle gets — the bigger the breakout tends to be.
⚠️ Disclaimer: This is not financial advice. Always do your own research and manage risk properly.
📚All Strategies Are Good; If Managed Properly!
~Richard Nasr
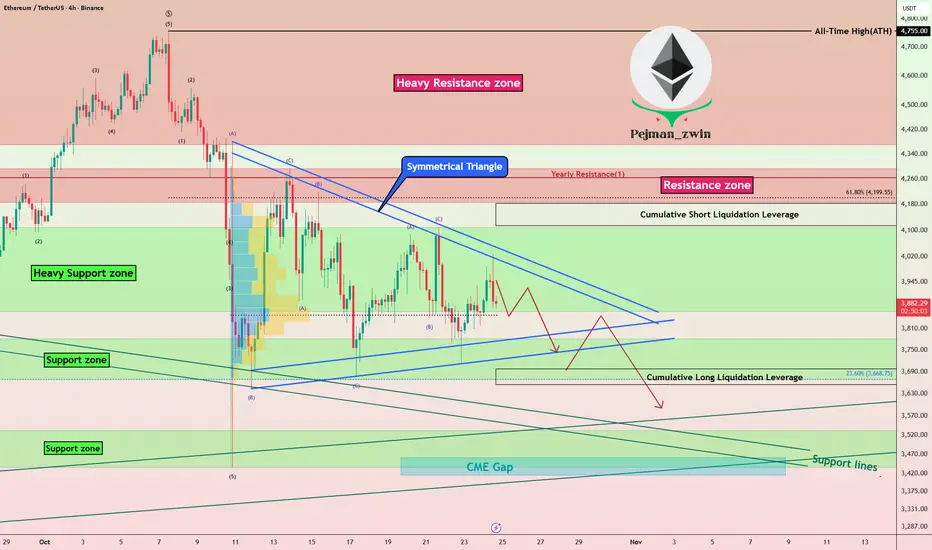
Ethereum in Symmetrical Triangle – Next Big Move Coming?Let’s take a look at Ethereum ( BINANCE:ETHUSDT ) on the 4-hour timeframe . Recently, Ethereum dropped by over -20% during the latest crypto market sell-off but has since started to recover. Right now, it appears to be in a corrective pattern, moving inside a Symmetrical Triangle Pattern .
Currently, Ethereum is testing a Heavy Support zone($4,107-$3,860) , and a break below that zone, confirmed by breaking the lower lines of the symmetrical triangle , could signal further downside.
Note: In general, a Symmetrical Triangle is a continuation pattern, and since the prior trend was downward, we might expect more downside if the broader crypto market continues to decline.
Before concluding, let’s also glance at the ETHBTC ( BINANCE:ETHBTC ) pair on the daily timeframe . It looks like ETHBTC has been in a downtrend and might revisit its support zone once more. That suggests if Bitcoin declines, Ethereum could see even more pressure .
In conclusion, I expect Ethereum to drop at least to its Support lines and Support zone($3,532-$3,436) after breaking the lower lines of the symmetrical triangle. There's also a CME Gap($3,461-$3,417) that might get filled.
Note: Keep in mind that weekend trading volumes are often lower, so the breakdown might not happen immediately. However, if tensions between the US and Venezuela escalate, we could see a sharper reaction even over the weekend.
First Target: $3,764
Second Target: $3,597
Stop Loss(SL): $4,044
Cumulative Short Liquidation Leverage: $4,182-$4,114
Cumulative Long Liquidation Leverage: $3,697-$3,3654
Please respect each other's ideas and express them politely if you agree or disagree.
Ethereum Analyze (ETHUSDT), 4-hour time frame.
Be sure to follow the updated ideas.
Do not forget to put a Stop loss for your positions (For every position you want to open).
Please follow your strategy and updates; this is just my Idea, and I will gladly see your ideas in this post.
Please do not forget the ✅' like '✅ button 🙏😊 & Share it with your friends; thanks, and Trade safe.
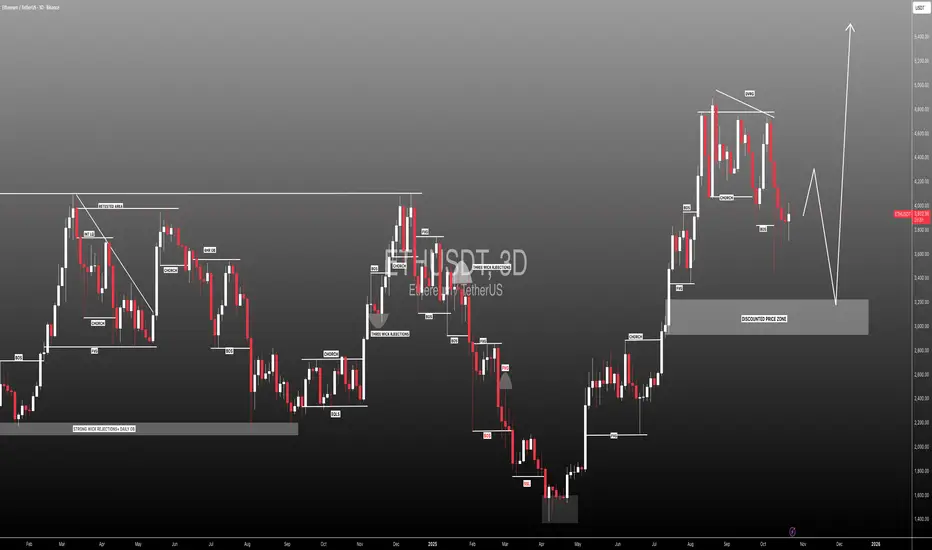
#ETHUSDT: First Drop And Then Launch To $5500! ETHUSDT we believe the price will initially decline before launching from the $3000 price region. This area appears more promising and could function as a discounted price zone. Three target levels are suggested below:
* **First target:** $4000. This area presents a minor resistance level, and closing 25% of positions is ideal.
* **Second target:** $4500. This is the second major resistance level, and closing another 25% of positions is recommended.
* **Final target:** $5500. This is our swing target. If the price reaches this level, it could be a suitable area to initiate a swing sell and the commencement of a major bearish move.
Please share your thoughts.
Team Setupsfx_
ETH/USDT | Ethereum Rebounds Strongly – Eyes on $5K Next!By analyzing the #Ethereum chart on the weekly timeframe, we can see that after our previous analysis, price continued to rise and reached as high as $4,200. It is currently trading around $3,800, and if it can hold above this level, we could expect further upside movement.
The next potential bullish targets are $4,300, $4,500, $5,000, and $5,500.
Please support me with your likes and comments to motivate me to share more analysis with you and share your opinion about the possible trend of this chart with me !
Best Regards , Arman Shaban

ETH....hanging by a threadIf ETH closes below the support box, we can expect to go down to the below rectangle.
It also has a tight (close) resistance above...

ETHUSD — Ichimoku & Fibonacci Time Analysis (4H)Ichimoku + RSI + Fibonacci used to identify key confluence.
Support zone: 3965–3896 (50–61.8% fib).
Bull confirmation above 4253. Next targets: 4409, 4491.
Strategy focus: time/price balance (Ichimoku-based).

Ethereum (ETHUSDT) – Elliott Wave & Fibonacci Technical OutlookETH has completed a clear 5-wave impulsive structure followed by an ongoing ABC corrective pattern on the daily timeframe.
Currently, price is testing the 78.6–100% Fibonacci retracement zone ($3,400–$3,700) — a key area that often marks the end of wave C and the start of a potential new impulsive wave.
Bullish Scenario:
If ETH confirms support above $3,400 with a strong bullish reversal candle and increasing volume, it may trigger a recovery toward $3,800 → $4,200 → $4,700.
Breaking above $4,200 would further validate the bullish continuation setup.
Bearish Scenario:
A daily close below $3,400 would invalidate the bullish wave count and could extend the correction toward lower structural supports.
Key Levels
Support: $3,400 – $3,700
Resistance: $3,800 / $4,200 / $4,700
Stop-loss (for long setups): Below $3,350
Overall, ETH is approaching a critical decision zone — watch for confirmation signals before positioning for the next leg.
#ETH #Ethereum #Crypto #TechnicalAnalysis #ElliottWave #Fibonacci #TradingView #CryptoTrading #BTC #ETHUSDT

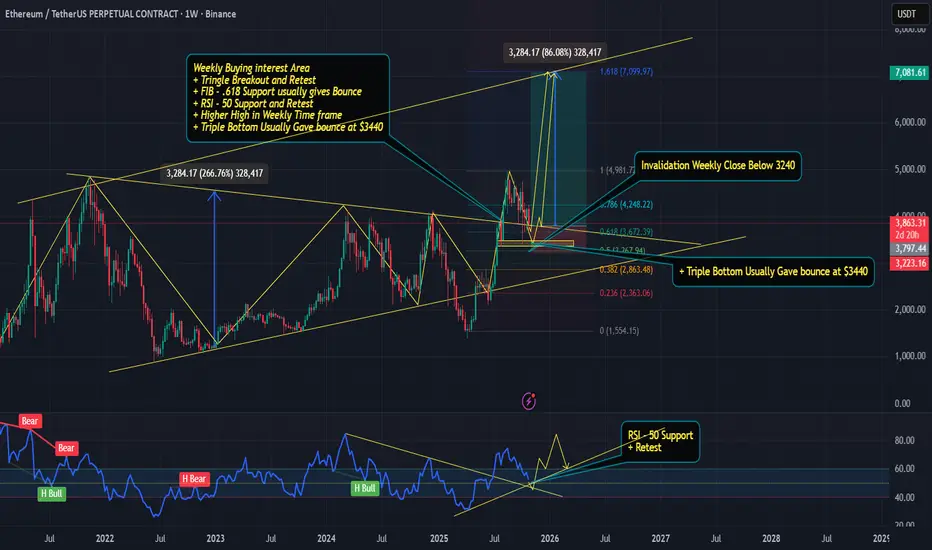
ETH Weekly Setup: Confluent Support Zone - $3440–Bounce Incoming📈 ETH/USDT – Weekly Timeframe Bullish Confluence
Multiple technical factors aligning for a potential bounce in Ethereum:
✅ Triangle Breakout + Retest – Price retesting the upper trendline of a multi-month
symmetrical triangle after a clean breakout. Classic continuation setup.
✅ Fibonacci .618 Support – The golden ratio level (~$3400–$3500 zone) has historically acted as strong dynamic support. Bounces from .618 are high-probability in trending markets.
✅ RSI at 50 Support & Retest – Weekly RSI holding the midline (50) as support. This level often marks the transition from correction to resumption of uptrend.
✅ Higher High Structure Intact – Weekly timeframe still printing higher highs. As long as $3240 holds on close, macro uptrend remains valid.
✅ Triple Bottom Formation – Price has tested ~$3440 three times in recent weeks. Triple bottoms at key levels often precede strong reversals.
🎯 Expected Move: Bounce toward prior swing high (~$4000–$4200) if support holds.
⚠️ Invalidation: Weekly close below $3240 – would break triple bottom neckline and shift bias to bearish.
Not financial advice. Trade at your own risk.
#ETH #Ethereum #Crypto #TechnicalAnalysis #TradingView
ETH/USDTETH bounced from monthly value area low so it has potentially go upwards to 4000$ mark. Once we reach there then next line of action will be evaluated.
I am bullish on ETH

ETH Outlook – Mid & Short TermHello Traders 🐺
In this idea, I want to talk about the next target for ETH and explore its potential mid- and short-term movements, so make sure to stay with me until the very end.
Let’s start with the weekly chart, then move down to the daily for a more detailed analysis:
As you can see on the weekly, with the current close above the blue resistance line, we can still have some hopium for ETH — meaning we’re still bullish for now, and everything looks fine so far.
But what am I expecting from ETH right now?
Let me be honest with you guys — if the price can recover from the current dip and break above the orange resistance line (which is also the daily supply zone), I expect at least another leg up toward $5,900, where price will face the 0.5 Fibonacci retracement level.
But what about the immediate short term?
As you can see on the daily chart, as long as ETH can hold above the purple support trendline, we can expect higher price targets ahead.
I think this is a crucial level for ETH to watch closely — we need to stay above it to keep the bullish structure alive.
I hope you enjoyed this idea, and as always remember:
🐺 Discipline is rarely enjoyable, but almost always profitable. 🐺
🐺 KIU_COIN 🐺

ETH - Ping-Pong Between The Rails!📦Ethereum keeps respecting a neat descending channel on 4H📦: repeated rejections from the upper rail (red arrows) and clean bounces from the lower rail (blue arrows). After the latest tap of the lower boundary, ETH is attempting a rebound within the range.
🏹 As long as the lower rail holds, I’ll look for continuation toward the mid-channel first, then the upper boundary. If momentum accelerates, the structure high near 4,265 becomes the key level to reclaim for a larger push.
⚔️A 4H close back below 3,642 would weaken the setup and open the door for a deeper retest toward 3,300, where the broader defense sits.
In short: trend-following longs from the lower rail, manage partials into the mid-range, and keep eyes on the upper rail for the next decision point.
⚠️ Disclaimer: This is not financial advice. Always do your own research and manage risk properly.
📚All Strategies Are Good; If Managed Properly!
~Richard Nasr

ETHUSDT incoming BULLSThe market has maintained a strong sideways trend after a crash crisis and now has the potential for bulls after the SELLE'S exit.
1.Maintained support while the resistance marked had been crossed 2 times
2.Buying pressure is greater expressing strong bulls.
3.Exit is required to go for a bullish trend.

ETH Analysis (4H)After the heavy dump on altcoins, the market is still quite volatile. However, after several days and weeks of ranging, it’s gradually returning to normal and becoming more predictable for analysis.
Ethereum has formed a reversal pattern at the bottom and has made three higher lows. It’s expected to move toward the red zone while holding the green area, and then get rejected toward lower levels.
The best area for a long buy is the green box, and the best area for a short sell is the red box.
Let’s wait and see what happens next.
For risk management, please don't forget stop loss and capital management
When we reach the first target, save some profit and then change the stop to entry
Comment if you have any questions
Thank You

My November and December expectations.According to my possible wave counts the first week of November may be a sell-off, then the direction may be upwards, and declines may occur after the Christmas holiday.
* The purpose of my graphic drawings is purely educational.
* What i write here is not an investment advice. Please do your own research before investing in any asset.
* Never take my personal opinions as investment advice, you may lose your money.

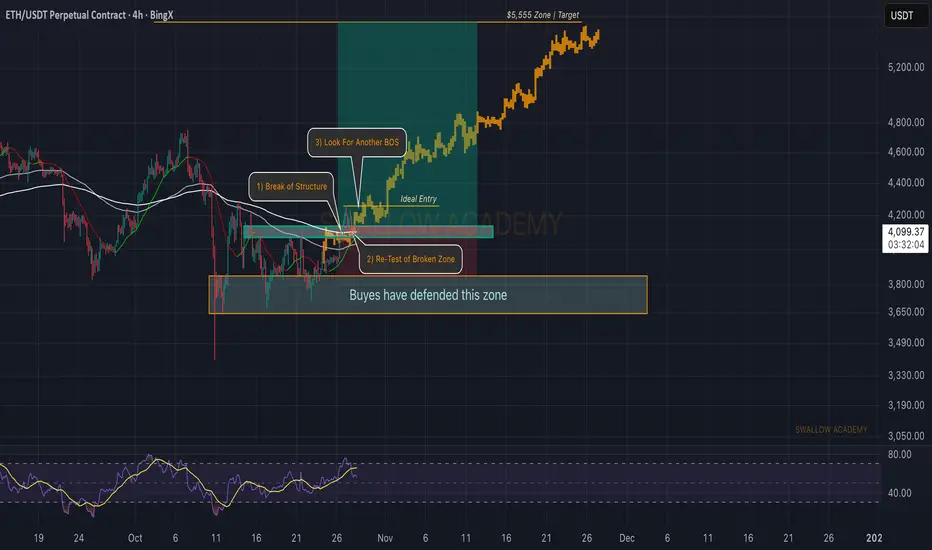
Ethereum (ETH): Last Step For Perfect Entry | Wait For Last BOSOne of the best setups that has been working for us is BOS/Re-Test/BOS, where ETH is at the last stage to potentially give us an ideal entry for a long position.
The game plan is simple: we wait for BOS to form; once we get that, we are going to target the current ATH area near $4900 and then a new ATH, which we have been aiming for, of $5555.
Swallow Academy
ETH/USDT — Comprehensive EW & Fib RoadmapETH/USDT — Comprehensive EW & Fib Roadmap
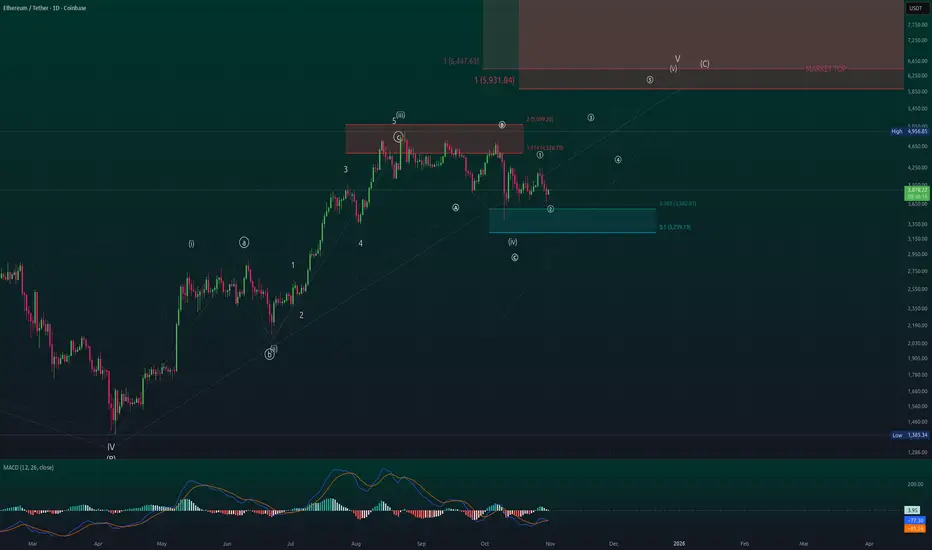
**Structure:** From the **Jun ’22 bear-market low → Mar ’24** forms **A/3**; **Apr ’25** prints **B/4**. Since April we’re advancing in **daily Wave C**, now focusing on **(iv)–(v)** completion toward terminal levels. This continues my earlier public idea/thread on ETH’s multi-degree terminal advance.
---
1) Multi-timeframe context
* **Primary count:** Weekly corrective **A–B–C** from ATH with the current leg = **Wave C**. Within it, daily is progressing to finish **Wave (v) of C** (terminal risk once complete). Core EW rules/guidelines (no W2 > 100% of W1; W3 not the shortest; W4 typically avoids W1 territory; alternation) frame the count and invalidations. ( )
* **Fibonacci basis:** Using standard retracement/extension clusters (0.382/0.5 retraces; 1.618/2.0 extensions) for targets and pullback zones.
---
2) 2025 zoom-in (from the Apr ’25 **B/4** low)
* We have a completed **(i)–(iii)** push into the **Aug ’25 high ≈ $4,956** (marked **Wave 3** on the chart).
* **Wave (iv)** most likely **bottomed 10 Oct ’25 ≈ $3,429**, landing in the blue retrace box (**0.382 ≈ $3,575**; **0.5 ≈ $3,233**).
* From that low, price carved a fresh **1–2** to the upside → launching pad for **③ of (v)** toward terminal targets (bearish reversal risk once (v) completes).
*(All levels and labels are taken from the provided chart screenshots.)*
---
3) Confluence zones & path to completion
* **Resistance pivots from prior swings:** **1.618 ≈ $4,528.7** then **2.0 ≈ $5,099**.
* **Terminal target cluster for (v) of C:**
* **$5,900** (first box edge),
* **$6,447** (upper confluence),
* **$8,731** (stretch/throw-over if momentum overshoots).
These align with typical EW/Fib projections for a terminal wave; diagonals often end with throw-overs and sharp reversals thereafter.
---
4) Risk management & invalidation
* **Structure invalidation of the immediate 1–2→3:** sustained break **below $3,200–$3,180** (beneath 0.5 box & October spike-low context) = defer (v) and expect a deeper/complex (iv).
* **Momentum tell:** A push into the $5.9k–$6.45k band with fading momentum/divergence would fit terminal behavior; diagonals frequently reverse hard after completion.
---
5) Alternate (lower-probability)
* If price closes **below $3,429** and holds, treat the current advance as incomplete corrective work; wait for a **new 1–2** before re-engaging on the long side. (Rule-based posture per EW hard rules/guidelines.)
---
## Trade Idea (non-advice; execution-ready)
**Bias:** Long the **1–2** base for a run into the terminal cluster, then de-risk into strength.
**Entry (Option A — pullback ladder):**
* **$3,575 → $3,233** (0.382–0.5 “blue box”). Scale in 3–4 tranches.
**Entry (Option B — confirmation add):**
* Add on decisive **daily close > $4,529** (1.618 pivot) targeting the $5.1k box next.
**Stop / Invalidation:**
* Hard stop **$3,180** (beneath the 0.5 box & Oct spike low). Re-assess if hit.
**Targets / Scale-out plan:**
* **T1:** **$5,100** (2.0 ext / prior resistance).
* **T2:** **$5,900** (terminal box edge).
* **T3:** **$6,447** (upper confluence).
* **Stretch:** **$8,731** only if momentum remains strong (take partials aggressively; diagonals can “throw-over” then snap back). ( )
**Position sizing & management:**
* Risk **≤1–2%** of equity per idea; trail under higher lows once price converts **$4,529** to support; aggressively reduce above **$5.9k** if momentum divergences appear. ( )
---
Reference / Continuation
This analysis continues my prior ETH terminal-advance roadmap on TradingView; review for the higher-timeframe diagonal context and publishing notes. ( )
---
Disclosure
Educational analysis only; **not financial advice**. Risk per trade **≤ 1–2%**.