Will Ethereum’s Market Flow Signal a New Bullish Phase?🎯 ETH/USD: The "Thief Strategy" Blueprint | Layer Your Way to Victory! 💰
📊 Market Overview
Asset: ETH/USD (Ethereum vs US Dollar)
Market: Crypto
Trade Type: Swing Trade
Bias: Bullish (Post-Breakout Setup)
🎭 The Thief's Master Plan
Ladies and gentlemen, gather 'round! 🎩 We're not just trading here—we're executing the legendary "Thief Strategy" where we sneak into multiple price levels like a professional heist crew. No single entry point for us, oh no. We layer up, diversify risk, and wait for the vault to open! 💎
🚀 Entry Strategy: The Layering Technique
Primary Entry Zone: Any price level AFTER a confirmed breakout above $4,200 ✅
The Thief's Layering Method (Multiple Limit Orders):
🥇 Layer 1: $3,900
🥈 Layer 2: $4,000
🥉 Layer 3: $4,100
🏆 Layer 4: $4,200
Pro Tip: Feel free to add more layers based on your capital allocation and risk appetite. The more layers, the smoother your average entry price! Think of it as building a ladder to success.
🛑 Stop Loss: Protect Your Treasure
Thief's Stop Loss: $3,700 🚨
⚠️ Important Disclaimer:
Dear Ladies & Gentlemen (Thief OG's), I'm NOT recommending you blindly follow my stop loss. This is MY risk tolerance. You need to assess YOUR own risk management strategy. Set your stop loss according to your capital size, risk appetite, and sleep-at-night comfort level. Remember: Your money, your rules! 💼
🎯 Take Profit Target: Know When to Exit the Heist
Primary Target: $4,600 🎰
Why This Level?
📈 Moving Average acting as a strong resistance zone (think of it as the police barricade!)
🔴 Overbought conditions on technical indicators
⚠️ Bull trap zone — smart money might be waiting to distribute here
Exit Strategy:
When you see the moving average resistance + overbought signals flashing, it's time to take your profits and vanish into the night! 🌙
⚠️ Important Disclaimer:
Dear Ladies & Gentlemen (Thief OG's), I'm NOT recommending you blindly follow my take profit level. This is MY analysis. Scale out profits at levels that make sense for YOUR trading plan. Partial profits, trailing stops, whatever works for YOU. Make money, then TAKE money—at your own discretion! 💵
🔗 Related Pairs to Watch
Keep an eye on these correlated assets to confirm the broader market direction:
BITSTAMP: BITSTAMP:BTCUSD — The king of crypto. When Bitcoin moves, ETH usually follows. Watch for BTC breakouts above resistance.
BINANCE: BINANCE:ETHBTC — Shows ETH's relative strength against Bitcoin. Rising = ETH outperformance.
TVC: TVC:DXY (US Dollar Index) — Inverse correlation. Weaker dollar = stronger crypto typically.
Total Crypto Market Cap — Confirms if capital is flowing INTO or OUT OF the crypto space.
COINBASE: COINBASE:SOLUSD , COINBASE: COINBASE:ADAUSD — Other major altcoins. If they're pumping too, it confirms alt season momentum.
Key Correlation Point: If Bitcoin is breaking resistance zones and the Dollar Index (DXY) is weakening, our ETH setup gets significantly stronger! 📊✨
🧠 Technical Analysis Breakdown
What We're Watching:
✅ Breakout Confirmation: Price must close above $4,200 with volume
✅ Support Levels: $3,900-$4,100 range acts as accumulation zone
✅ Resistance Zone: $4,600 where moving averages + overbought conditions converge
✅ Risk-Reward Ratio: Solid setup with layered entries minimizing average cost basis
The Thief Strategy Philosophy:
Instead of gambling on ONE entry point, we spread our risk across multiple price levels. This way, we're dollar-cost-averaging into the position BEFORE the breakout confirmation, positioning ourselves ahead of the crowd! 🎯
🎬 Final Words from the Thief
Remember, OG's: The best trades are the ones where you're positioned BEFORE the crowd rushes in. Layer your entries, manage your risk like a professional, and know when to take your profits and disappear! 👻
Stay disciplined, stay profitable, and let's make this heist a success! 🏆
✨ If you find value in my analysis, a 👍 and 🚀 boost is much appreciated — it helps me share more setups with the community!
#ETHUSD #Ethereum #CryptoTrading #SwingTrade #ThiefStrategy #LayeringStrategy #CryptoAnalysis #TechnicalAnalysis #TradingView #CryptoSetup #AltcoinSeason #ETHBreakout #RiskManagement #TradingStrategy #CryptoIdeas
Trade ideas

Ethereum weakened or holding structure? | ETH 1H Analysis👋🏻 Hey everyone! Hope you’re doing great! Welcome to SatoshiFrame channel.
✨ Today we’re diving into the 1-Hour Ethereum analysis. Stay tuned and follow along.
👀 We observe Ethereum on the 1-hour timeframe. After breaking and stabilizing at the $3,889 zone, Ethereum formed a higher low on this area and is now moving along a trendline (dynamic support), with an important static resistance at $3,982.50. Price has reacted to this level once but has not succeeded in breaking it!!!
🧮 Using the RSI oscillator is a reasonable approach in this situation. Since Ethereum is currently in a box/trading range, a breakout requires entering overbuy territory and surpassing the 70 level. Note that there is a significant oscillation support below the average, at the 44.5 zone, which holds strong validity and represents our swing low.
🐷 Pay attention to Ethereum’s volume. To break the specified zone, Ethereum needs to show a strong reaction, fill sell orders, and liquidate futures contracts. Therefore, we need buyer market makers to support the breakout, causing volume to increase through a price jump.
✍️ The scenario forming for Ethereum may require some patience and could play out differently, because we are now facing the second touch of this level, so the win rate of this scenario may be slightly lower.
🟢 Long Position Scenario
Breaking Ethereum’s resistance at $3,982.50 along with surpassing the 70 RSI level and seeing a significant increase in buying volume and price squeeze can form a good long position scenario on Ethereum.
❤️ Disclaimer : This analysis is purely based on my personal opinion and I only trade if the stated triggers are activated .

eth bearish set upas you see there will be a new bearish trend !! i show you an ABC pattern (major trend) and inside than we are completing an triangle as (B) so i predict a bearish trend as (c) in near future.

ETH$9k target for CRYPTOCAP:ETH is becoming more realistic than ever as price structure continues to strengthen. Momentum is building fast, and both targets are aligning perfectly on the chart. I believe these setups will play out in the very near future, with potential for even higher levels ahead.

ETHUSDTHi friends.
in eth charts, we can see the price succesfully fixed upside of 3900. when you check entire candles, you will see the price is in good situation for a good long position.
i think nowadays this is very low risk that we enter a long position from here.
good luck

ETH bullish flag pattern ETH bullish flag pattern aligns with a third-wave structure suggesting upside if support holds healthy consolidation
ETH has formed a bullish flag pattern, and the movement is parallel to the third Elliott wave of the wave analysis. The news background is neutral
Current price: $4,137
According to the pattern, the upward movement could soon reach $4,200 , $4,250 , and highter...
If the price declines and reaches $4,070 , the movement will continue in a downward corridor, and the pattern will not form anytime soon

ETH-----Sell around 4035, target 3960 areaETH Contract Technical Analysis (October 29th):
On the daily chart, yesterday's close was a small bearish candle, indicating a consecutive decline. The price is still within a range, and the accompanying indicators show a golden cross with decreasing volume. The overall trend remains bullish, but the price is currently in a range-bound movement. However, attention should be paid to data releases and news-driven stimuli. On the hourly chart, the price faced downward pressure during the US session, but rebounded from early support this morning. The current candlestick pattern shows a consecutive bullish reversal, while the accompanying indicators show a bearish cross with decreasing volume. However, the four-hour chart shows significant price suppression, with resistance around the 4035 area.
Today's ETH Short-Term Contract Trading Strategy:
Sell at the 4035 area, stop loss at the 4070 area, target 3960 area;

Long biasAll indications Say that ETH/USDT is going up , at least to 5000 USDT ,
we have VOLUME and a PULLBACK to a récent key level plus the general BULLISH TREND .

DeGRAM | ETHUSD is above the support area📊 Technical Analysis
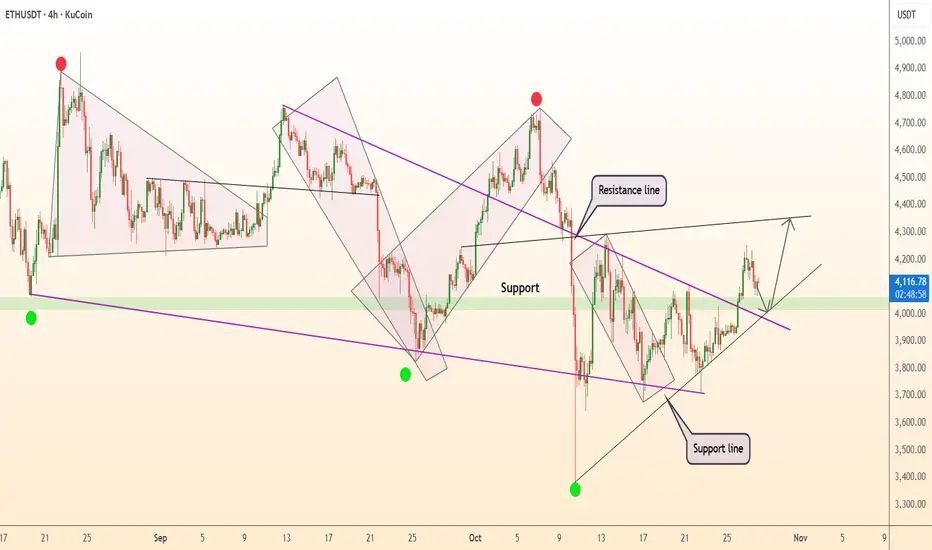
● ETH/USD broke above its descending resistance line and retested the 4,000 support zone, confirming a breakout from a medium-term accumulation structure.
● The price now targets 4,300 as the next resistance, with ascending channel dynamics supporting continued bullish momentum.
💡 Fundamental Analysis
● Ethereum gains traction amid rising DeFi activity and institutional accumulation, while stable macro sentiment boosts broader crypto risk appetite.
✨ Summary
● Long bias above 4,000; targets 4,300. Breakout confirmation and improving fundamentals support medium-term upside.
-------------------
Share your opinion in the comments and support the idea with a like. Thanks for your support!
ETH Consolidating Before the Next Move$ETH/USDT has been trading sideways for the past 74 days, holding strong at the confluence of the rising trendline and key support zone. This prolonged consolidation suggests that both buyers and sellers are in a state of equilibrium, waiting for a decisive move.
A breakout on either side could set the tone for the next major trend. If ETH manages to hold this support and gain momentum, we might see a strong recovery toward the upper resistance levels.
However, if it loses this zone, a deeper correction could follow before any significant upside move.
DYOR, NFA
PEACE

My November and December expectations.According to my possible wave counts the first week of November may be a sell-off, then the direction may be upwards, and declines may occur after the Christmas holiday.
* The purpose of my graphic drawings is purely educational.
* What i write here is not an investment advice. Please do your own research before investing in any asset.
* Never take my personal opinions as investment advice, you may lose your money.

Ethereum Game Plan - TDLRKZ MODELEthereum Game Plan - TDLRKZ MODEL
📊 Market Sentiment
On 29/10, the FED lowered rates by 25BPS, as expected. However, Powell’s comments introduced uncertainty regarding another cut in December, stating that further policy moves depend on incoming data.
Interestingly, one FED member dissented, preferring no cut this cycle — a shift from September when all members supported easing.
Following the statement, rate-cut expectations dropped from 95% to 68%, prompting traders to take profits and hedge, creating a short-term bearish sentiment across markets.
Despite this, the mid-to-long term outlook remains bullish, given the broader liquidity cycle and easing policy bias.
📈 Technical Analysis
Ethereum is currently accumulating inside a well-defined range.
Price failed to sustain above the $4950 range high and has started retracing toward the HTF bullish trendline, a potential reaction zone aligning with prior liquidity pools and confluences.
If price holds around this zone, ETH could seek the range high again once momentum returns.
📘 Model in Use – Trendline Deviation with HTF LR into Key Zone (TDLRKZ Model)
This model identifies setups where price deviates from HTF trendlines while interacting with liquidity zones and key structural levels.
The goal is to align HTF context with LTF confirmation for high-probability trend continuation setups.
Model Steps:
1️⃣ Identify the HTF trend direction and only trade in that direction.
2️⃣ Mark the HTF bullish trendline supporting price.
3️⃣ Spot HTF Key Zones likely to act as reaction areas.
4️⃣ Locate nearby liquidity pools or order concentrations.
5️⃣ Wait for confluence: when all align, confirm with a 4H market structure break for entry.
📌 Game Plan
Looking for ETH to retrace into $3350 and reject from that level.
If a 4H break of structure occurs and daily candle closes above $3350, this will trigger a long-biased setup.
🎯 Setup Trigger
→ 4H structure break after tagging $3350
→ Daily close above $3350
📋 Trade Management
→ Entry: After confirmation above $3350
→ Stop Loss: Below swing low that caused 4H break of structure
→ Targets:
TP1: $4150 (EQ)
TP2: $4550
TP3: $4950 (Range high)
→ Move SL to breakeven after TP1 is reached.
💬 Check my Substack for deeper macro and sentimental breakdowns — free subscriptions are open.
⚠️ Disclaimer: This content is for educational purposes only and does not constitute financial advice. Always DYOR before trading.

ETH/USDT — Comprehensive EW & Fib RoadmapETH/USDT — Comprehensive EW & Fib Roadmap
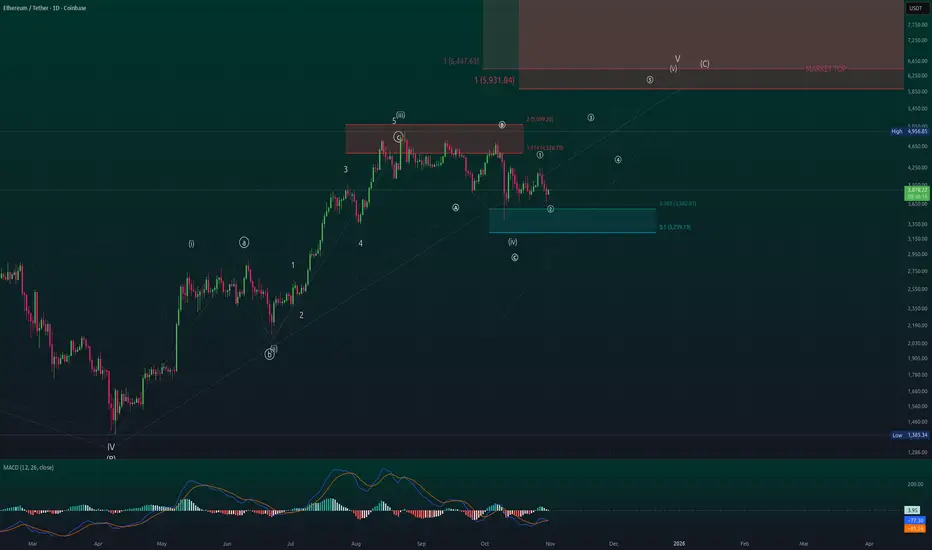
**Structure:** From the **Jun ’22 bear-market low → Mar ’24** forms **A/3**; **Apr ’25** prints **B/4**. Since April we’re advancing in **daily Wave C**, now focusing on **(iv)–(v)** completion toward terminal levels. This continues my earlier public idea/thread on ETH’s multi-degree terminal advance.
---
1) Multi-timeframe context
* **Primary count:** Weekly corrective **A–B–C** from ATH with the current leg = **Wave C**. Within it, daily is progressing to finish **Wave (v) of C** (terminal risk once complete). Core EW rules/guidelines (no W2 > 100% of W1; W3 not the shortest; W4 typically avoids W1 territory; alternation) frame the count and invalidations. ( )
* **Fibonacci basis:** Using standard retracement/extension clusters (0.382/0.5 retraces; 1.618/2.0 extensions) for targets and pullback zones.
---
2) 2025 zoom-in (from the Apr ’25 **B/4** low)
* We have a completed **(i)–(iii)** push into the **Aug ’25 high ≈ $4,956** (marked **Wave 3** on the chart).
* **Wave (iv)** most likely **bottomed 10 Oct ’25 ≈ $3,429**, landing in the blue retrace box (**0.382 ≈ $3,575**; **0.5 ≈ $3,233**).
* From that low, price carved a fresh **1–2** to the upside → launching pad for **③ of (v)** toward terminal targets (bearish reversal risk once (v) completes).
*(All levels and labels are taken from the provided chart screenshots.)*
---
3) Confluence zones & path to completion
* **Resistance pivots from prior swings:** **1.618 ≈ $4,528.7** then **2.0 ≈ $5,099**.
* **Terminal target cluster for (v) of C:**
* **$5,900** (first box edge),
* **$6,447** (upper confluence),
* **$8,731** (stretch/throw-over if momentum overshoots).
These align with typical EW/Fib projections for a terminal wave; diagonals often end with throw-overs and sharp reversals thereafter.
---
4) Risk management & invalidation
* **Structure invalidation of the immediate 1–2→3:** sustained break **below $3,200–$3,180** (beneath 0.5 box & October spike-low context) = defer (v) and expect a deeper/complex (iv).
* **Momentum tell:** A push into the $5.9k–$6.45k band with fading momentum/divergence would fit terminal behavior; diagonals frequently reverse hard after completion.
---
5) Alternate (lower-probability)
* If price closes **below $3,429** and holds, treat the current advance as incomplete corrective work; wait for a **new 1–2** before re-engaging on the long side. (Rule-based posture per EW hard rules/guidelines.)
---
## Trade Idea (non-advice; execution-ready)
**Bias:** Long the **1–2** base for a run into the terminal cluster, then de-risk into strength.
**Entry (Option A — pullback ladder):**
* **$3,575 → $3,233** (0.382–0.5 “blue box”). Scale in 3–4 tranches.
**Entry (Option B — confirmation add):**
* Add on decisive **daily close > $4,529** (1.618 pivot) targeting the $5.1k box next.
**Stop / Invalidation:**
* Hard stop **$3,180** (beneath the 0.5 box & Oct spike low). Re-assess if hit.
**Targets / Scale-out plan:**
* **T1:** **$5,100** (2.0 ext / prior resistance).
* **T2:** **$5,900** (terminal box edge).
* **T3:** **$6,447** (upper confluence).
* **Stretch:** **$8,731** only if momentum remains strong (take partials aggressively; diagonals can “throw-over” then snap back). ( )
**Position sizing & management:**
* Risk **≤1–2%** of equity per idea; trail under higher lows once price converts **$4,529** to support; aggressively reduce above **$5.9k** if momentum divergences appear. ( )
---
Reference / Continuation
This analysis continues my prior ETH terminal-advance roadmap on TradingView; review for the higher-timeframe diagonal context and publishing notes. ( )
---
Disclosure
Educational analysis only; **not financial advice**. Risk per trade **≤ 1–2%**.
Ethereum $ETH still has weekly demand in control. Will it rally?Ethereum CRYPTOCAP:ETH still has weekly demand in control. Will it rally higher? Waiting for some more bullish price action or a pullback to the weekly demand lower at $2,600.

ETH movement according to planOn October 26, Ethereum showed a clear upward movement on the 4-hour chart from the 4043.78 level. I entered on the next candle after confirmation and gradually closed positions at three profit-taking levels. I distributed the deposit across these zones and collected around 5 percent profit with 1.5x leverage.
The key is not greed but structure. Thanks to a secret proprietary strategy, it was possible to clearly see the levels and avoid emotional reactions. Many traders at that moment tried to chase the market, entering too late, but precise calculations and visualized levels allowed me to act calmly and without haste.
I often notice that even experienced traders make mistakes by ignoring their plan and technical references. But discipline is what separates chaotic trading from a system. Each level was predetermined, and the price moved exactly according to the calculations.

$ETHUSDT: Update - Long term signal triggeredThe long term bull cycle signal I was waiting for triggered, after turning initially bullish in the mid term 2 months ago, we now have a valid reason to add further exposure to Ethereum and consider staking and participating in other ways of increasing your returns with DeFi.
(I leave this up to you, DYOR, this is beyond the scope of this forecast and involves other risks and complexity that you need to understand well yourself before participating in it).
As far as technicals go, we have a clear invalidation signal if price fails to follow through after this quarter ends, or if it breaks under the level where most of the accumulation took place near 1700-1800.
Upside targets are between 9400 and 54000, with the highest probability target range being between 9400 and 17500 by late 2025. The upper target range is more of a black swan scenario for Bitcoin and would involve some degree of flippening which seems unlikely.
Best of luck!
Cheers,
Ivan Labrie.

ETHEREUM ETHUSDTETHEREUM TECHNICAL INFORMATION.
THE WEEKLY TIME FRAME SHOWS THAT BUYERS REJECTED THE 4998-5000 ZONE AND IT BECOMES OUR NEW BUY LIMUS TEST IN THE FUTURE.THE BREAK AND COSE OF A WEEKLY CANDLE WILL CALL FOR 15MIN SCALP IN SEARCH OF POINT OF ENTRY TO AIM 6000-7000$ IN PROFIT.
THE CURRENT REALITY WITH ETHEREUM SHOWS LACK OF BIUY MOMENTUM AND ITS EVIDENT FROM THE BREAK AND RETEST OF 4200 LEVEL ON WEEKLY TIME FRAME ON THE CHART ,THIS REACTION IS DETAILED ON THE CHART FOR REFERENCE.
THE SELL CONFIRMATION WILL COME FROM THE WEEKLY BREAK AND CLOSE 3780 AND MY SELL TARGET WILL BE 3116$ DEMAND FLOOR AND ALSO 50% FIB LEVEL
TARGET 2 WILL BE 2727.8 DEMAND FLOOR
AND PRICE COULD GO LOWER BEYOUND THIS ZONE ON BEARISH SENTIMENT AND PROLONGED TAKE PROFIT,
ETHEREUM IN CONTEXT
Ethereum remains the second-largest cryptocurrency by market capitalization and continues to be a foundational platform for decentralized finance (DeFi), smart contracts, and tokenized assets.
Ethereum 2025 Overview and Outlook
Ecosystem Growth: Ethereum’s ecosystem is expanding with over 127 million active wallets and total value locked (TVL) in DeFi protocols reaching about $96.86 billion, a 50% increase since mid-2025.
Technology Upgrades: Recent upgrades like Pectra and Fusaka, along with Layer 2 solutions such as Arbitrum, improve scalability, reduce fees, and enhance user experience.
Macro and Regulatory: Institutional inflows via Ethereum ETFs total nearly $24.7 billion, supported by gradual regulatory clarity.
Price Forecast: Despite short-term volatility, Ethereum shows strong fundamental on structure and rally.
Summary
Ethereum remains a dominant blockchain platform with robust adoption and technical advancements, supporting a positive price outlook .currently, with potential to rally toward $5000-6000k if they break and close weekly resistance at 4200
the ecosystem growth, institutional participation, and network upgrades will be its bullish catalyst
.
#ethusd #ethereum

Growth ahead of the Trump-Xi Jinping meeting in South Korea.CRYPTOCAP:ETH / #Ethereum 🔹 Donald Trump and Xi Jinping (October 19, 2025)
A positive outlook is shaping up for Ethereum, and it sure looks like a classic W reversal is in the works.
There's a ton of negativity swirling right now, with a lot of folks expecting prices to dip even lower (I was bracing for that final flush-out myself, but it looks like they scooped up the dip and are busy forming this reversal setup).
During that Ethereum drop on October 10-11, BitMine Immersion Technologies beefed up its reserves with 104,336 ETH worth $417 million.
As of this writing, the company's sitting on 3.03 million ETH valued at $12.18 billion, making it the biggest corporate whale holding Ethereum.
Whales and public companies are aggressively snapping up Ethereum and stacking their bags.
All that's left is to speculate where Ethereum's gonna top out and where they'll start dumping all this volume 8k? 10k?
I've pulled together some screenshots that back up the bullish signal:
1️⃣ Liquidations on the Hyperliquid exchange: As you can see on the chart above, once we break $5,000, a massive wave of short traders are gonna get wrecked that could spark another leg up in price momentum.
2️⃣ Coinbase order book: Check it out—above $5,000, there are limit orders lined up for profit-taking, so Ethereum might follow a similar path straight up to $8,000.
3️⃣ Current big orders on Binance and Coinbase exchanges.
4️⃣ OKX ETH/USDC liquidation heatmap.
Wrapping it up: On the daily chart, we're seeing a reversal pattern forming as a W (I call it the "pirate reversal" myself), and keep in mind that after the chaos on October 10-11, more than 1.6 million traders got absolutely rekt.
I doubt everyone's gonna pile back in buying or flipping to long positions anytime soon that plays right into the hands of the big market puppeteers and market makers.
They'll pump the price higher, whip up the hype, and offload their Ethereum stacks at the top.
Snapshot:

Second Leg Incoming? Ethereum Needs Volume.👋🏻 Hey everyone! Hope you’re doing great! Welcome to SatoshiFrame channel.
✨ Today we’re diving into the 4-Hour Ethereum analysis. Stay tuned and follow along.
👀 Looking at Ethereum on the 4-hour timeframe, we can see that just like Bitcoin, Ethereum began a strong bullish leg yesterday, breaking several of its multi-timeframe resistances. With this price jump, it has now reached its resistance area at $4,252. Keep in mind that the market may take a short rest at this level, and price may experience a brief pullback to the downside.
🧮 The RSI oscillator is currently exiting the OverBuy zone, which is a sign that a multi-timeframe correction may begin for Ethereum.
🕯 During this bullish leg, Ethereum’s volume has increased slightly. However, since sell orders have been lower than before, this volume increase does not appear very strong on the 4-hour chart. Therefore, if Ethereum intends to form its second bullish leg upward, we will likely need to see a more noticeable increase in buying volume.
✍️ The scenario ahead for Ethereum, like Bitcoin, is independent of any trade or position, and it simply helps us better understand Ethereum’s corrective price behavior.
🛡 Ethereum, similar to Bitcoin, is entering a price resting phase. This rest can extend down toward support levels, and if a stronger bullish continuation wants to form, we may see a reversal reaction near these zones. If such a move occurs, the analysis and scenarios will be updated for you.
❤️ Disclaimer : This analysis is purely based on my personal opinion and I only trade if the stated triggers are activated .

ETH-USDTHit a major resistance intersection at $3900
which is the intersection of the trend line and the static level 🚨
This resistance must be broken upwards for Ethereum and altcoins to rise

ETH-USDTSee the dot in Ethereum
Exactly 4050 as I said stopped the decline 💰👀
If it manages to break 4300, Ethereum and altcoins will enter a new bullish phase✔️🚀

ETHUSDT 2-Hour Chart Analysis. ETHUSDT 2-Hour Chart Analysis.
ETH is consolidating above key support levels ($3,700–$3,800) and exhibiting a lateral range, but a clear breakout has yet to occur.
The chart path indicates a bullish scenario: if ETH holds above this base, the next major resistance lies near $4,280—a move above this could lead to a target of $4,400+.
Bullish traders will want to see a strong candle above $3,900 to maintain momentum; failure to hold $3,700 raises the risk of a move towards the $3,390 support level.
DYOR | NFA

Ethereum Sees Major Sell-Off as Price Fails to Break $4,000Ethereum’s price sits at $3,950 at the time of writing, stuck below the critical $4,000 resistance. The altcoin has been oscillating near $3,872, showing no clear directional bias.
The current indicators suggest that this consolidation phase above $3,742 support is likely to persist. However, if market conditions worsen and ETH slips below $3,742, a further decline toward $3,489 could follow. Such a move would confirm a bearish continuation pattern.
Conversely, if buying activity strengthens and overall sentiment improves, Ethereum could breach the $4,000 resistance level. A successful breakout would open the path toward $4,221, invalidating the bearish outlook and signaling renewed investor confidence.
