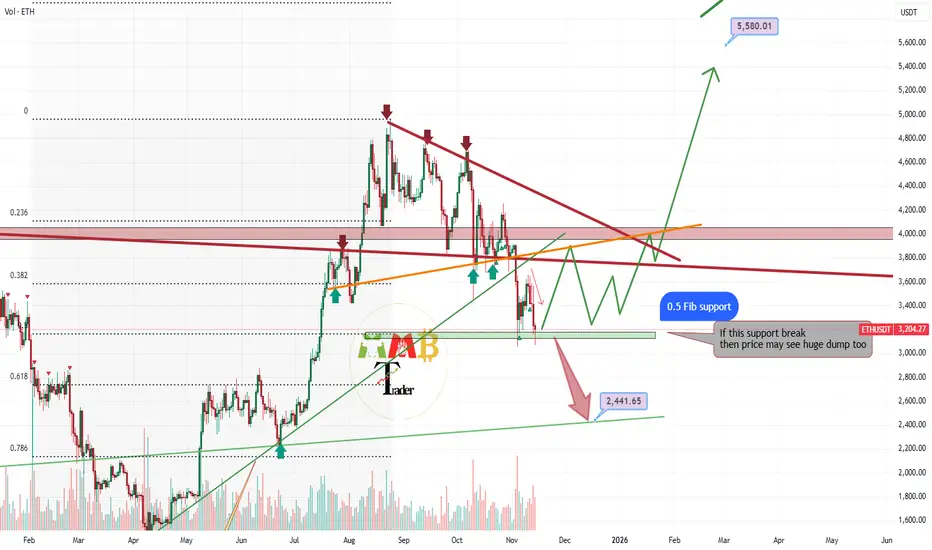
ETH 50% Fibonacci support level hold strong ---> PUMPAs observed on the chart, the descending trendline has exerted significant downward pressure on Ethereum's price. The asset is now testing the critical 0.5 Fibonacci retracement level, which is demonstrating notable support characteristics. Should this technical foundation hold, we anticipate potential strength accumulation sufficient to challenge and potentially break above the key trendline resistance. A confirmed breakout would signal renewed bullish momentum, establishing conditions favorable for a potential ascent toward higher price levels, possibly testing previous significant highs.
DISCLAIMER: ((trade based on your own decision))
<<press like👍 if you enjoy💚
Trade ideas
ETH: Fade the FearTrade Setup
Position: Long (2–3x leverage max)
Entry Zone: 3,741–3,591
Stop Loss: 3,325
Targets:
TP1: 5,190
TP2: 5,561
TP3: 5,836
This setup enters on the completion of Wave 4 and the beginning of a final impulsive Wave 5, with ETH reclaiming prior ATH resistance near 4,868 into a final euphoric Q4.
Macro Context
1. Rate Cuts and End of QT:
The Fed continues to signal a move toward easier policy. As rate cuts proceed and quantitative tightening winds down, risk assets tend to rally. Crypto often lags equities by a few weeks, meaning ETH could soon benefit from these liquidity shifts.
3. Liquidity Flow from Gold:
Crypto will steal liquidity from gold sellers as liquidity rotates.
3. Volatility Positioning:
DVOL data shows implied volatility hovering around 43–44, indicating that institutional players are not aggressively hedging downside. Such volatility compression often precedes a major directional move, typically upward during liquidity expansions
Technical Confluences
1. Wave Structure:
ETH appears to be finalizing Wave 4, setting up for a higher-low structure that leads into Wave 5. The MACD on the 3D timeframe is reversing, supporting bullish continuation.
2. Golden Pocket Retrace:
The current pullback perfectly aligns with the 0.618 Fibonacci retracement zone between 3,741 and 3,591.
4. Bull Market Support Band:
The 20W SMA and 21W EMA continue to hold as dynamic support.
5. Funding Rate Sentiment:
Funding rates across major exchanges remain neutral to slightly negative. This shows that short positions are piling in near support, which is typical during the final stages of a corrective phase before a squeeze higher.
DO NOT BE COMPLACENT.

Don’t Miss the Wave: Navigating the Markup & Acceleration PhasesEvery strong rally begins with a period of quiet buildup. The price moves sideways, creating a base, while smart money quietly accumulates. Then, at a certain point, something shifts. The Markup Phase begins, and soon after, the market enters the Acceleration Phase — a fast-paced, FOMO-driven surge that catches everyone’s attention. Understanding these phases is key to riding the wave before it crashes.
How to Trade the Markup and Acceleration Phases?
During the Markup Phase, many traders look for opportunities to enter positions gradually, avoiding the temptation to chase after the rapid price movement. A more strategic approach is to scale in on retests of breakout zones or key support levels, which can provide better entry points with lower risk.
As the market moves into the Acceleration Phase, the price tends to surge rapidly, often with little to no pullback. At this stage, it's crucial to protect profits and manage risk. Traders often trail stop-loss orders to lock in gains or take partial profits as the price continues to climb. Parabolic moves are thrilling, but they don't last forever — it's important to stay alert and ready for a reversal or correction when the momentum starts to fade.
🔑 Key Indicators to Watch
During the markup phase, technical signals can help confirm that the move is real. Look for:
Rising volume — confirms genuine interest behind the breakout;
Higher highs and higher lows — a clear sign of trend formation;
Moving averages (20/50-day) — the price staying above these lines often signals trend strength;
RSI and MACD — momentum indicators showing acceleration or potential exhaustion;
Open interest and funding rates — rising figures suggest growing trader participation and leverage.
As the rally gains traction, the market enters the Acceleration Phase. This is where hype replaces logic — the charts go parabolic, social media buzzes, and new traders rush in driven by FOMO. Price action becomes almost vertical, and corrections get instantly bought up. Typical signs of this stage include overbought RSI, spiking volumes, and extreme funding rates — all pointing to overheated market sentiment. Find out what drives the market in our article here .
🪤Common Traps to Avoid
The biggest mistake traders make during these phases is confusing momentum with sustainability. Entering too late, ignoring overheated sentiment, or overleveraging during acceleration can quickly turn profits into losses. Always check whether volume supports the move and watch for sudden spikes in funding rates — they often signal that the trend is near exhaustion.
🏁Final Thoughts
Understanding where the market stands in this cycle helps traders make smarter decisions. The markup and acceleration phases can bring big opportunities, but also major risks for those entering too late. Always rely on your own analysis and use proper risk management. The market doesn’t reward emotions; it rewards patience and discipline.

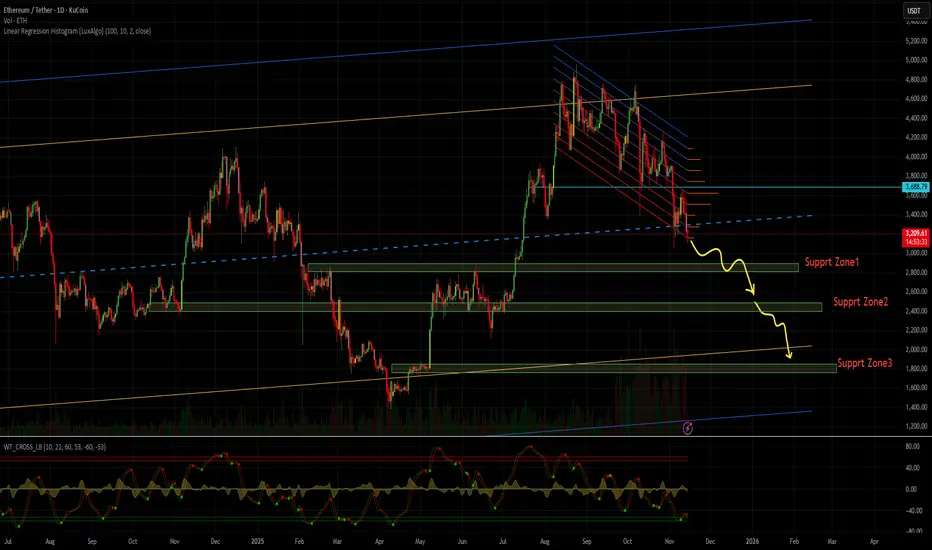
Eth/Usdt analysisI think crypto is in Downtrend mode right now.
but we have 3 support zone for ETH/USDT that shown in chart.
just wait for reverse candle in daily time frame in support zone.
support zone 2 and 3 is more safer.
Note that these support zones are good for short-term purchases and require further analysis to say the market is bullish.
ETHUSDT.P - November 14, 2025ETHUSDT.P on the 15-minute chart remains in a short-term downtrend, defined by a clear descending trendline that continues to cap price. Current price action is consolidating beneath the $3,240 resistance zone, where repeated rejections suggest sellers are still in control unless a clean breakout and retest occur above this level. Immediate support sits near $3,104; a breakdown below this shelf would likely accelerate momentum toward the broader demand zone around $2,960–$2,900. Conversely, if buyers manage to reclaim the trendline and hold above the $3,240 region, a short-term relief rally could develop, but until then the bias leans bearish within the current structure.

Ethereum touched the targetHello friends 😍
💁♂️ Ethereum mid-term analysis moved as expected and reached the $3100-$3200 area
You can see the previous analysis
⚠️ None of the analysis is a recommendation to buy or sell, but simply my personal opinions on the charts. You can use the charts and choose any that interest you and take a position if you wish.
To support me, I would appreciate it if you boost the analysis and share it with your friends so that I can analyze it with more energy for you, my dears. Thank you all. 💖

DeGRAM | ETHUSD has consolidated below the mirror📊 Technical Analysis
● ETH/USD is testing the broken dynamic support line, which now acts as resistance near $3,600. This retest aligns with the descending channel structure, confirming the dominance of sellers.
● A rejection from this level could lead to a continuation toward the $3,200–$3,100 support zone, coinciding with the previous accumulation area visible from July.
💡 Fundamental Analysis
● Ethereum faces mild pressure as risk appetite fades amid uncertainty over upcoming U.S. economic data and delayed ETF approvals, dampening short-term demand.
✨ Summary
● Resistance: $3,600. Support: $3,200. ETH remains bearish while below resistance, with potential continuation toward the next support zone.
-------------------
Share your opinion in the comments and support the idea with a like. Thanks for your support!

ETH/USDT: Bullish Breakout to $3740?BINANCE:ETHUSDT is setting up for a potential bullish breakout on the 4-hour chart , where price has formed a higher low while testing a downward trendline, converging near the good entry zone at cumulative short liquidation levels—suggesting buyers could trigger a squeeze if support holds, aiming for higher resistances. This position carries high risk, so always prioritize strict risk and capital management to avoid significant losses in volatile crypto markets.
Entry between $3370-$3417 . Target at $3740 in the take profit zone. Set a stop loss on a close below $3320 to mitigate downside. 🌟 Look for confirmation with a bullish close above the entry and surging volume, riding Ethereum's momentum amid broader crypto trends.
📝 Trade Setup:
🎯 Entry Zone: $3,370 – $3,417
💰 Target: $3,740 (Take-Profit Zone)
❌ Stop Loss: Close below $3,320
⚖️ Risk-to-Reward: Approximately 1:3, depending on entry execution and volatility
⚠️ This remains a high-risk trade setup — strict risk and capital management are essential in volatile crypto conditions.
What's your view on this high-risk setup? Drop your thoughts below! 👇

Ethereum's Updated Map: Giant Flat Correction Corrections can be complex and massive in size
On Ethereum, we have been in a major corrective structure since the strong move up of 2018-2021 completed
The structure shows two large red legs down with a green zigzag joint connecting them
The first large red leg down defines the boundaries of this Giant Flat Correction
ranging between $4,868 and $882
The current move down may mirror the structure of that first leg
potentially bouncing within the $2,500 to $3,500 zone before heading lower
This decline could revisit the $882 low or extend into a full retrace toward $82
After this completes, the second large blue leg up could begin

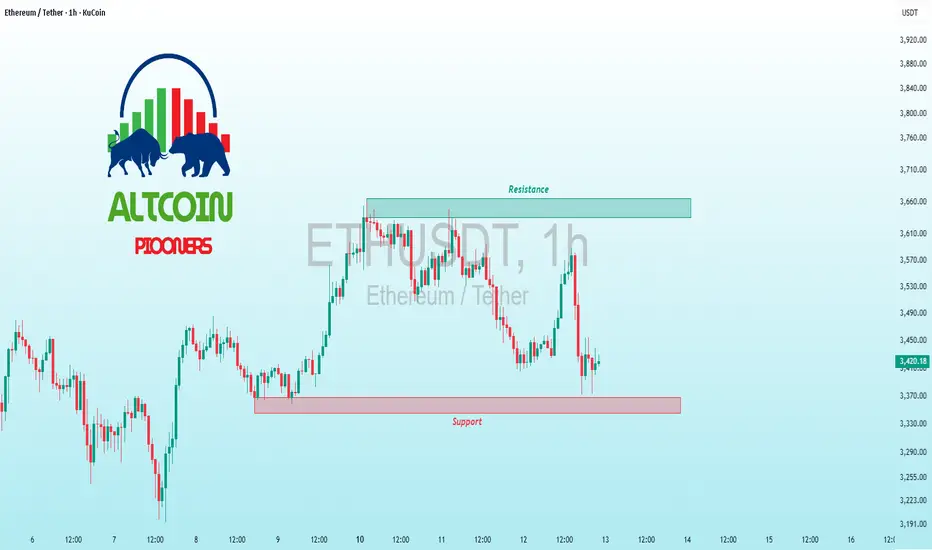
$ETH Descending Trendline Pressure – Bounce Setup?KUCOIN:ETHUSDT CRYPTOCAP:ETH Descending Trendline Pressure – Bounce Setup?
Current trend: ETH's tracing a sharp downtrend from 4K highs, now slamming the 3,176 support with a wedge-like compression—sellers dominating but volume fading hints at exhaustion 🛡️.
Hold support? Likely yes; prior lows and 200 EMA confluence could spark buyers if wicks hold.
Breakout above resistance? Watch 3,900 flip on close—could reverse to 4,100 if trendline breaks bullishly 🚀.
Dip risk? Sharp to 3,000 on breach, fueled by BTC correlation.
Target: Upside 3,500 on defense; downside 3,050 buffer.
Indicators tracking: RSI (32, oversold snap), Trendline slope, and MACD histogram curl 📉.
#ETHTrading #CryptoWedge #AltcoinPioneers

Ethereum Bear Market Is StartingHello everyone, I hope you're all doing well.
Today I'll share my long-term outlook for Ethereum's price. I expect the price has peaked and will enter a downward trend towards the targets I've listed below
This is not investment advice; please take full responsibility for your buying and selling decisions.
Warning: Be careful not to use this idea with leverage, as you could lose all your money

Long trade Pair: ETHUSDT
Date: Wed 12th Nov 25
Time: 6.30 pm
Session: Tokyo PM
Direction: Buyside
Timeframe: 15-min Execution
🔹 Trade Details
Field Value
Entry 3410.66
TP 3623.43 (+6.23%)
Stop 3368.96 (–1.23%)
RR 5.1: 1
🔹 Technical Context
Model: FVG → Inducement → BOS → Mitigation Entry
📝Higher-Timeframe Bias
The chart shows ETH sweeping a major HTF discount zone around 3200–3240, which aligns with Base Level 3244.28. This region acted as a Sell climax, Secondary test (Wyckoff Phase B/C), and Liquidity grab beneath all previous London and NY lows. FVG between ~0.62–0.70 retracement zone. It remained untouched, leaving a clear inefficiency target for a mitigation tap.
Before price tapped the FVG, ETH created:
A micro liquidity shelf and consecutive equal lows during Tokyo → London
Narrative:
Price swept the HTF base level around 3240, confirming bullish accumulation. Multiple session lows were engineered then taken (Tokyo → London → NY), creating strong sell-side liquidity. After displacement, ETH left a clean bullish FVG, whose price never fully mitigated. A shallow 0.25 pullback created inducement, ensuring weak hands entered early. Once the BOS printed, the price sharply retraced into the FVG, Discount Fib zone, Breaker block, and Tokyo PM session demand, creating an algorithm-driven entry.
🔹 Sentiment / Narrative Context
Liquidity vacuum above 3500 with clean inefficiencies makes buyside continuation likely.
Broader sentiment remains positive as the market left a re-accumulation range rather than a distribution. Volume aligned with bullish displacement — institutions supporting the move.
No major macro headwinds at this moment; volatility stable and favouring upward expansion.

Update ( ETHUSD )After the sweep of LQ we may see a run of those lows before reversing higher , we aren't gonna enter yet , not until higher time frame confirms to us that the state of dilevery has changed.


Ethereum#ETH 1H chart is showing signs of a Double Bottom forming a potential reversal structure.
If the neckline breaks and price holds above the 1h FVG zone, next target aligns with the 4h FVG area around +$3.8k.
Structure looks clean smart money might already be positioning.
Thank me later for this setup.
#Ethereum #Crypto #YodaXCalls

ETH-USDTI said yesterday that as long as it stays above 3450, the price could reach 3700 and it's moving along that path 💵💵
If the scenario changes, I’ll update you 🤩💰💰

#Ethereum BREAKOUT INCOMING!Ethereum is coiling tightly inside this symmetrical triangle.
A breakout is coming and momentum is already shifting. 🔥
Watch ETH closely… the next move could be explosive. 🚀

Ethereum updateLast night, after a rejection, the price touched a **trendline resistance** and is now bouncing back from that area. Buyers seem to be showing more strength at the moment, and it looks likely that the price could **revisit the range high** once again.

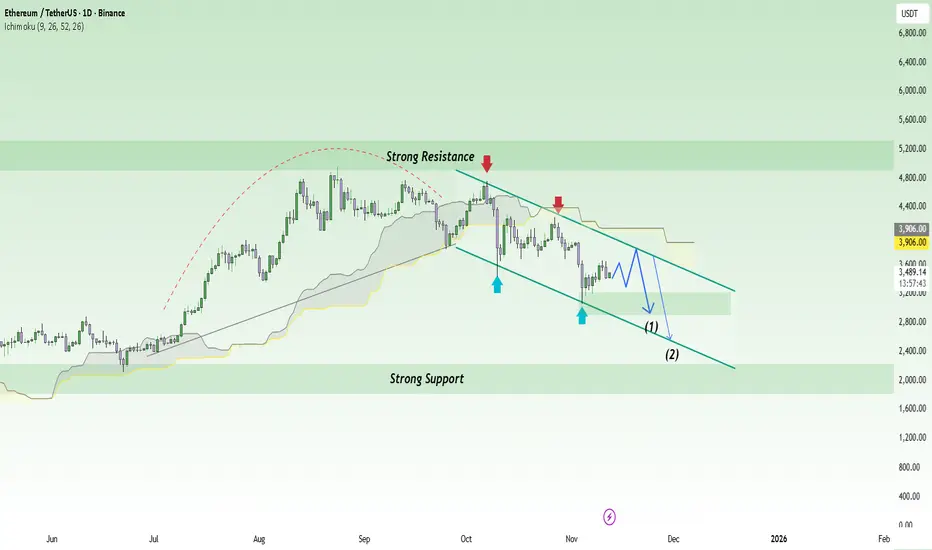
ETH Breaks Structure! Are the Bears Back in the Race?Ethereum (ETH) is entering a sensitive phase as overall market sentiment turns more cautious following recent declines across the crypto market. While it remains the leading platform for tokenization and DeFi, short-term selling pressure is becoming increasingly evident — especially as speculative capital shifts toward safer assets.
On the daily chart, ETHUSDT remains inside a medium-term descending channel , with every rebound quickly rejected at the dynamic resistance line. Price is currently trading around $3,480, signaling a weak recovery attempt while momentum remains trapped below the Ichimoku cloud.
The current scenario suggests that ETH could retest the $3,800 resistance zone before continuing its move lower toward $2,900 and $2,500 — both aligning with the lower boundary of the channel and a strong support area from previous price action.
Overall, the primary trend remains bearish , and any short-term bounce is likely just a technical pause before renewed selling pressure. In the short run, the bears are clearly still in control.
$ETH Support Test Amid Volatility – Ready for Rebound?KUCOIN:ETHUSDT CRYPTOCAP:ETH Support Test Amid Volatility – Ready for Rebound?
Current trend: ETH is grinding lower in a choppy range, now hugging the pivotal 3,370 support after a swift rejection from 3,470 highs—buyers defending hard, but volume thinning signals caution ⚡.
Hold support? Likely yes, with hammer candles forming and price stabilizing; a close above 3,390 flips bias bullish.
Breakout above resistance? Possible if BTC stabilizes—targeting 3,550 on volume surge, unlocking alt momentum.
Dip risk? Elevated to 3,300 if support cracks on weak close, especially with overbought divergence looming.
Target: Upside 3,550 short-term; deeper 3,700 if 3,470 clears decisively.
Indicators watching: RSI dipping to 40 (bounce zone), Bollinger Bands squeezing for volatility pop, and OBV for accumulation confirmation 📉.
#ETHTrading #CryptoBounce #AltcoinPioneers
ETHUSDT-LONG IDEAETHUSDT is in internal short term bearish trend very soon it is going to hit its Higher time frame support of demand area. I've market the zone if you find eth in this zone wait for LTF structure shift and Buy. This is just an idea not a Financial Advice.

Long trade
1hr TF overview
📘 Trade Journal Entry
Pair: ETHUSDT.P (Perpetual Contract)
Date: Wed 12th Nov 2025
Time: 7:00 AM
Session: London to New York Session AM
Direction: Buyside Trade
Timeframe: 15-Minute
🔹 Trade Details
Entry: 3552.98
Profit Level (TP): 3807.27 (+7.17%)
Stop Level (SL): 3530.45 (–0.63%)
Risk-Reward Ratio (RR): 11.31
🔹 Technical Context
Market Structure:
🧾Prior Consolidation Phase at top range followed by a significant markdown breaking below structural support.
🧾The secondary retest formed at the base level (3244–3200 zone) aligned with liquidity grab beneath prior lows (PDL).
🧾Subsequent shift in structure (CHOCH → BOS) on the 15M chart suggests transition from distribution to early accumulation.
Key Confluences:
🧩Fair Value Gaps (FVGs) identified within the 0.75–0.25 retracement zone, acting as re-entry and mitigation areas.
🧩Breaker Block formation confirmed following BOS, validating bullish continuation setup.
🧩Volume expansion visible around 3550 region, signalling strong buy-side interest.
🧩Kaufman Adaptive Moving Average (KAMA) providing dynamic trend support near 3475 level.
📈Target Narrative:
We assume that price aims to rebalance inefficiency toward the 3,800–3,850 liquidity zone, corresponding to prior unmitigated FVG and institutional range midpoint.
🔹 Narrative & Sentiment
The setup reflects a buyside re-accumulation model emerging from deep discount levels post-sell climax. The corrective structure within the descending wedge aligns with the Wyckoff “Spring” and “Test” phase, suggesting smart money re-entry before expansion.
Macro sentiment also supports ETH strength into mid-November amid rotational flow from BTC dominance cooldown and speculative positioning ahead of CPI data.

Ethereum analysis Hello traders,
Ethereum, based on the higher time frame (weekly) and the lower time frame (4-hour), is showing bullish potential. As you can see, after taking liquidity below the weekly level and returning to the previous range — along with a confirmed trigger candle on the 4-hour chart and RSI dropping below 30 (oversold) — I believe we could see Ethereum retest the $4,000 level.
Stay profitable!
