$ETH Bear Trap or Leg Down? Support Battle RagesKUCOIN:ETHUSDT CRYPTOCAP:ETH Bear Trap or Leg Down? Support Battle Rages
Altcoin Pioneers! 🔴 ETH/USDT 1H is in full retreat, slicing through the descending channel and probing support at ~3,000 after a brutal rejection at resistance 3,560. That red trendline from recent highs is unyielding, with volume confirming seller control – but oversold signals flashing.
Hold support? Fingers crossed; a doji at lows could spark a fakeout bounce if BTC stabilizes. Breakout above resistance? Slim, needs >3,550 close on ETF hype. Deeper dip risk? High – invalidation eyes 2,950 (Fib 0.786), alt bleed incoming.
Target: Rebound to 3,150 if holds, plunge to 2,980 on break. Eyes on: RSI divergence (at 32), VWAP for intraday bias, and ETH/BTC ratio for decoupling clues. Buckle up! ⚡📉
#ETH #CryptoMarkets #TradingSignals
Trade ideas

Ethereum Just Reclaim this Broken Trendline If Ethereum manages to reclaim this broken long-term trendline, then it can easily reach around $7,700 by December 31, 2025 . All we need is a proper reclaim of that major trendline — and it genuinely looks like Ethereum might do it in the coming days. This is a real ray of hope for us.
You already know that once Ethereum breaks above $5,000 , a full, heavy altseason is likely to get activated. So don’t lose hope — the game is not over yet. There is still a bright opportunity ahead.
Forget Bitcoin for now. Focus on Ethereum and the altcoins. They are the ones currently showing real strength.

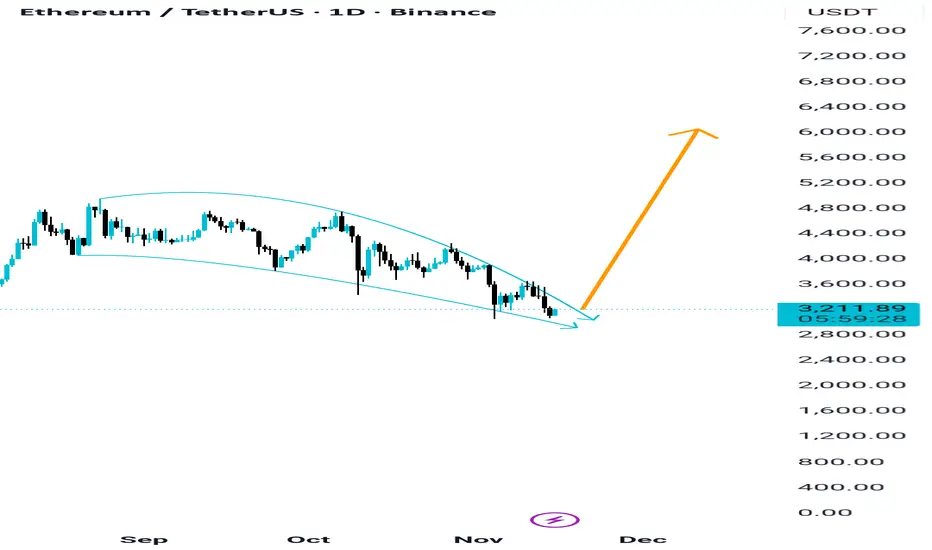
Ethereum to 6000$ if successfully Breakout this Curve If we look at Ethereum on the daily timeframe, we can clearly see that a curve-shaped pattern is forming — you can also call it a curved trendline. This type of structure usually shows a gradual shift from a slow accumulation phase into a stronger upward trend.
If Ethereum manages to break out properly above this curved trendline — with strong volume and a clean retest — then the move can easily extend toward the $6,000 to $7,000 zone. But the key condition here is a confirmed breakout, not just a wick or a temporary spike.
A successful breakout of a curved trendline often signals the start of a stronger momentum phase. And if Ethereum breaks out cleanly from this pattern, we can also expect the possibility of an altseason, because Ethereum strength usually boosts mid-caps and low-caps as liquidity rotates into the rest of the market.
So the main points are:
A curved trendline/curve pattern is developing on the daily chart
A clean breakout is required to validate this structure
If confirmed, Ethereum has room to run toward $6K–$7K
Such a breakout can also trigger a wider altseason across the market
Follow me for more useful premium updates for free
🚀🚀🚀
ETH Capital Sector. Price Slice 8008.45 K🏷 Capital Sector. Price Slice 15.11.2025
8008,45 — At the time of publication, the price had not yet been reached. ( на момент публикации цена не достигнута )
7284.29 — At the time of publication, the price had not yet been reached. ( на момент публикации цена не достигнута )
7026.69 — At the time of publication, the price had not yet been reached. ( на момент публикации цена не достигнута )
5957,54 — At the time of publication, the price had not yet been reached. ( на момент публикации цена не достигнута )
5390,34 — At the time of publication, the price had not yet been reached. ( на момент публикации цена не достигнута )
5075,09 — At the time of publication, the price had not yet been reached. ( на момент публикации цена не достигнута )
4873,69 — At the time of publication, the price had not yet been reached. ( на момент публикации цена не достигнута )
4759,55 — At the time of publication, the price had not yet been reached. ( на момент публикации цена не достигнута )
4390,43 — At the time of publication, the price had not yet been reached. ( на момент публикации цена не достигнута )
🏷 At the request of close colleagues, friends, and supporters of my work, I am publishing this analytical material in English—for the international institutional community and conscious retail market participants.
🏷 This slice reflects the logic of institutional capital movement. It is critical to understand: price is formed only when sufficient liquidity from the retail sector and sustained crowd interest are present. Without this condition, institutional interest remains potential, but unrealized.
🏷 Meanwhile, institutional capital operates on entirely different temporal and structural charts than those visible on the screens of most traders.
🏷 Therefore, a superficial view of price is doomed to distortion.
🏷 Methodology: Pre-Factum
🏷 My analytical markings are built on the principle of Pre-Factum—anticipating the fact before it manifests. This is not forecasting in the traditional sense, but identifying capital intent prior to its physical manifestation on the chart.
🏷 The central element of this method is identifying a price sector as an intention—where the instrument is striving to go—regardless of its current price action: no emotions, only cold calculation. Every price has its own timeframe.
🏷 There are three ways to interact with unfulfilled price levels:
🏷 1. Trade from the level—enter upon confirmed structural validation.
🏷 2. Wait for fulfillment—observe price movement toward the level without entering, focusing on instrument behavior.
🏷 3. Trade in the direction of the level—utilizing support/resistance levels with strict risk control.
🏷 If you choose the third path, deep understanding of market mechanics becomes mandatory. Without experience, conscious perception of liquidity behavior, and prior study of relevant materials, entering such positions is premature.
🏷 This applies equally to retail newcomers and professionals whose attention remains scattered by short-term timeframe noise.
🏷 Relevance of Markings
🏷 The levels presented here are current, fresh institutional capital markings. They do not invalidate previously identified unfulfilled prices but complement them within the context of evolving liquidity and shifting market logic.
🏷 A flag placed prior to price touch—with the publication date (level, sector—whichever you prefer)—indicates that the instrument, with high probability and regardless of current price movement, intends to execute a move toward that price.
🏷 Two examples:
🏷 Example #1 — BTC:
On the screenshot from September 26, 2025, I marked the price of 106,110 with a blue flag (color is my personal labeling). Screenshot:
The instrument subsequently deviated from this level by 15%, creating pressure: on October 10, 2025, price declined sharply, collecting all long positions.
Instrument slide:
🏷 Example #2 — ETH:
On October 12, I marked the price of 3,291.60 with a yellow flag:
On November 4, the instrument reached the marked price:
🏷 I have directed your attention to specific prices—and there are many such examples in my feed. If you study my materials, you will see: this is a new methodology, currently not demonstrated by anyone else in the world. The precise slice and price sector I have developed reveal the true mechanics of the market.
🏷 Once price reaches a flagged zone, the marking loses its original function. It must be updated to reflect the new logic of capital movement—otherwise, it becomes a misleading reference or a conventional technical analysis level.
🏷 These markings are not static. They are dynamic markers of intent, requiring constant reassessment. It is precisely these that we uncover through the method of capital anticipation.
🏷 Temporal Context
🏷 I emphasize separately: the flag carries not only a price function, but also a temporal one. The publication date is the fixed point of my observation and identification. It serves as my anchor: where and when I captured institutional intent.
🏷 My entire architecture of price sectors is systematically organized into chronological folders. I have already demonstrated this structure in one of my videos—for those who seek to think structurally, not reactively. Use translators as needed to study my demonstration.
🏷 This is not a forecast. It is a map of intent.
🏷 Read it with respect for liquidity, time, and capital intelligence.
🏷 English is not my native language. With international exposure, time will come—I will provide new reference points as needed, without compromising institutional interests or the balance of many market participants. I do not disclose the entire price sector or the skill of seeing any instrument within its price sector for security reasons. You must determine for yourself how to engage with institutional analysis.
🏷 There are traders, and there are analysts—two distinct classes. The mindset between institutional analysis and trading is fundamentally different.
🏷 As you see, I do not use indicators. This is mathematics, logic, and an intellectual system I created—my proprietary property. I have come only to help you see a different structure.
🏷 The battle of titans is a clash of attention and timing.
🏷 The question is not who is right—but who has the resources and patience to unload positions.
🏷 Who leads whom? The one who sees further and holds institutional leverage.
🏷 You have received a map. Most see an image; few read the message. The difference is not IQ, but the habit of looking toward the future—not at indicator noise.
🏷 Institutional capital meticulously crafts candles, as if scripting the narrative to suit its preferred triggers. I, operating from the shadows, read the plan: where entry points will be set, where liquidations will be scheduled, who will hold positions until the bell.
🏷 I offer possibilities, not commands. But let us acknowledge: a hint is an art—and it transforms curiosity into dependency. Do you remember the echo of these words?
🏷 I have shown you another side of analysis—I have designed what you have been waiting for, and what you have grown weary of. This is new technical analysis: to understand how to control the capital sector—study the materials. The secrets are mine. I give you part of this understanding to help you.
🏷 Not tricks, not guesses—but architecture.
🏷 Let it sound mystical—it must. A map in the hands of one who can read between the candles always appears as prophecy to those accustomed to indicator noise.
— The Architect

ETHUSDT: Price Aims For $3,500 ? Here Is Why...Hello everyone,
Lets take a grasp on ETHUSDT. Ethereum has been on bearish fall for some couple of weeks now. trending on a momentum move of lower highs and lows, in regards to this market structure and other time frames.
Presently the price is at the support zone, moving up slowly towards resistance, also as lower high.
Key points;
More confirmation above this support level, would trigger an upward rise to $3,500-$3,550 as the next partial resistance.
Happy weekend to you all.
Thanks for reading.

ETH Capital Sector. Price Slice 15.11.2025 1590.05 K🏷 ETH Capital Sector. Price Slice 15.11.2025
3035,40 — At the time of publication, the price had not yet been reached. ( на момент публикации цена не достигнута )
2872,52 — At the time of publication, the price had not yet been reached. ( на момент публикации цена не достигнута )
2772,62 — At the time of publication, the price had not yet been reached. ( на момент публикации цена не достигнута )
2575,43 — At the time of publication, the price had not yet been reached. ( на момент публикации цена не достигнута )
2332,65 — At the time of publication, the price had not yet been reached. ( на момент публикации цена не достигнута )
1927,44 — At the time of publication, the price had not yet been reached. ( на момент публикации цена не достигнута )
1590.05 — At the time of publication, the price had not yet been reached. ( на момент публикации цена не достигнута )
🏷 At the request of close colleagues, friends, and supporters of my work, I am publishing this analytical material in English—for the international institutional community and conscious retail market participants.
🏷 This slice reflects the logic of institutional capital movement. It is critical to understand: price is formed only when sufficient liquidity from the retail sector and sustained crowd interest are present. Without this condition, institutional interest remains potential, but unrealized.
🏷 Meanwhile, institutional capital operates on entirely different temporal and structural charts than those visible on the screens of most traders.
🏷 Therefore, a superficial view of price is doomed to distortion.
🏷 Methodology: Pre-Factum
🏷 My analytical markings are built on the principle of Pre-Factum—anticipating the fact before it manifests. This is not forecasting in the traditional sense, but identifying capital intent prior to its physical manifestation on the chart.
🏷 The central element of this method is identifying a price sector as an intention—where the instrument is striving to go—regardless of its current price action: no emotions, only cold calculation. Every price has its own timeframe.
🏷 There are three ways to interact with unfulfilled price levels:
🏷 1. Trade from the level—enter upon confirmed structural validation.
🏷 2. Wait for fulfillment—observe price movement toward the level without entering, focusing on instrument behavior.
🏷 3. Trade in the direction of the level—utilizing support/resistance levels with strict risk control.
🏷 If you choose the third path, deep understanding of market mechanics becomes mandatory. Without experience, conscious perception of liquidity behavior, and prior study of relevant materials, entering such positions is premature.
🏷 This applies equally to retail newcomers and professionals whose attention remains scattered by short-term timeframe noise.
🏷 Relevance of Markings
🏷 The levels presented here are current, fresh institutional capital markings. They do not invalidate previously identified unfulfilled prices but complement them within the context of evolving liquidity and shifting market logic.
🏷 A flag placed prior to price touch—with the publication date (level, sector—whichever you prefer)—indicates that the instrument, with high probability and regardless of current price movement, intends to execute a move toward that price.
🏷 Two examples:
🏷 Example #1 — BTC:
On the screenshot from September 26, 2025, I marked the price of 106,110 with a blue flag (color is my personal labeling). Screenshot:
The instrument subsequently deviated from this level by 15%, creating pressure: on October 10, 2025, price declined sharply, collecting all long positions.
Instrument slide:
🏷 Example #2 — ETH:
On October 12, I marked the price of 3,291.60 with a yellow flag:
On November 4, the instrument reached the marked price:
🏷 I have directed your attention to specific prices—and there are many such examples in my feed. If you study my materials, you will see: this is a new methodology, currently not demonstrated by anyone else in the world. The precise slice and price sector I have developed reveal the true mechanics of the market.
🏷 Once price reaches a flagged zone, the marking loses its original function. It must be updated to reflect the new logic of capital movement—otherwise, it becomes a misleading reference or a conventional technical analysis level.
🏷 These markings are not static. They are dynamic markers of intent, requiring constant reassessment. It is precisely these that we uncover through the method of capital anticipation.
🏷 Temporal Context
🏷 I emphasize separately: the flag carries not only a price function, but also a temporal one. The publication date is the fixed point of my observation and identification. It serves as my anchor: where and when I captured institutional intent.
🏷 My entire architecture of price sectors is systematically organized into chronological folders. I have already demonstrated this structure in one of my videos—for those who seek to think structurally, not reactively. Use translators as needed to study my demonstration.
🏷 This is not a forecast. It is a map of intent.
🏷 Read it with respect for liquidity, time, and capital intelligence.
🏷 English is not my native language. With international exposure, time will come—I will provide new reference points as needed, without compromising institutional interests or the balance of many market participants. I do not disclose the entire price sector or the skill of seeing any instrument within its price sector for security reasons. You must determine for yourself how to engage with institutional analysis.
🏷 There are traders, and there are analysts—two distinct classes. The mindset between institutional analysis and trading is fundamentally different.
🏷 As you see, I do not use indicators. This is mathematics, logic, and an intellectual system I created—my proprietary property. I have come only to help you see a different structure.
🏷 The battle of titans is a clash of attention and timing.
🏷 The question is not who is right—but who has the resources and patience to unload positions.
🏷 Who leads whom? The one who sees further and holds institutional leverage.
🏷 You have received a map. Most see an image; few read the message. The difference is not IQ, but the habit of looking toward the future—not at indicator noise.
🏷 Institutional capital meticulously crafts candles, as if scripting the narrative to suit its preferred triggers. I, operating from the shadows, read the plan: where entry points will be set, where liquidations will be scheduled, who will hold positions until the bell.
🏷 I offer possibilities, not commands. But let us acknowledge: a hint is an art—and it transforms curiosity into dependency. Do you remember the echo of these words?
🏷 I have shown you another side of analysis—I have designed what you have been waiting for, and what you have grown weary of. This is new technical analysis: to understand how to control the capital sector—study the materials. The secrets are mine. I give you part of this understanding to help you.
🏷 Not tricks, not guesses—but architecture.
🏷 Let it sound mystical—it must. A map in the hands of one who can read between the candles always appears as prophecy to those accustomed to indicator noise.
— The Architect

ETHUSDT.P LongLets wait for the price to break above the trendline with bullish momentum and retest our entry zone with bullish candles pattern only than enter in the trade.
The tp1 and tp2 has been marked.
At tp1 always take out 50% profit and rest bring the s.l to the entry.
keep following and if you want signals on daily basis dm me here

ETHUSDT.P - November 15, 2025The price is currently below the trendline and seems to be consolidating. If the price breaks upwards 3,276.75, consider buying long with the first target at 3,441.72. Partial profits can be taken at this level, and the stop loss should be adjusted to break-even.
If the price breaks below 3,168.65, consider entering a short position, with the next potential target near 3,100.

Ethereum Trade IdeaThe recent volatility has pushed Ethereum and the entire altcoin market lower than expected, but this is exactly where disciplined traders find their edge. The setup on the chart shows a fresh order block with clear upside targets (TP1–TP4), offering a structured path for potential recovery. Stay focused, stay patient, and remember capital preservation is your strongest weapon. Only risk what you’re comfortable losing, trust your process, and let the market come to you. Smart risk management will carry you farther than any single trade.

ETH Key Levels and possible wave countsQuick and simple analysis.
We have some key Fibonacci level coming up, if all of them failed, we are likely to go back to the bottom of the channel.
Watch for small bounces between those level. I suspected that we are in Wave A of the ABC corrective structure, the next run up could be a Wave B correction that goes up, then we will come down again. Trade with caution!


$ETH's Fragile Floor: 3.16K Bounce or Liquidation AvalancheKUCOIN:ETHUSDT CRYPTOCAP:ETH 's Fragile Floor: 3.16K Bounce or Liquidation Avalanche to 2.95K? 📉🟣
ETHUSDT 1H flashing red flags—price hugging 3.16K support with 2.73B long liqs looming if it snaps.
Weak volume on rebounds, bearish channel intact; resistance at 3.6K a distant dream.
Deeper dip to 2.95K likely on break, but watch for RSI rebound & MACD histogram flip.
HODL tight or hedge! ⚠️
#ETH #AltcoinDip #TradingView

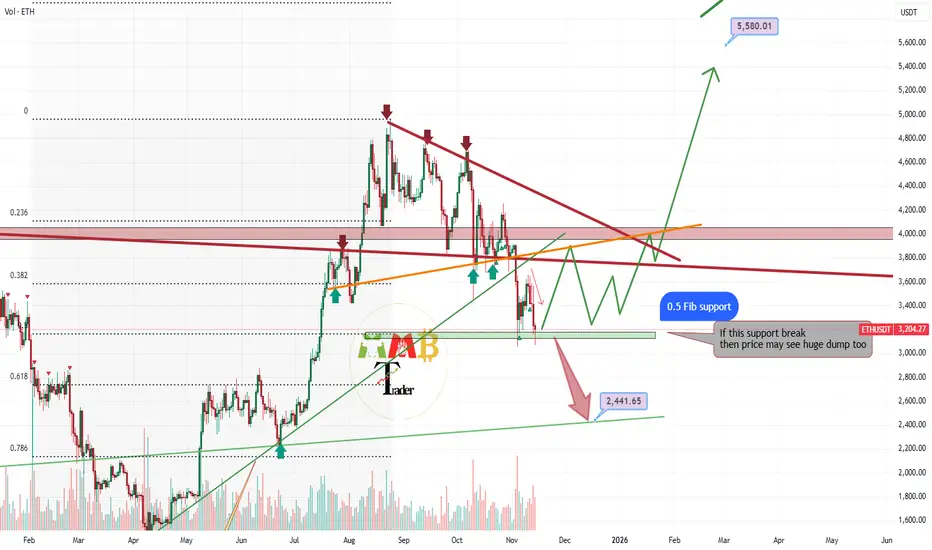
ETH 50% Fibonacci support level hold strong ---> PUMPAs observed on the chart, the descending trendline has exerted significant downward pressure on Ethereum's price. The asset is now testing the critical 0.5 Fibonacci retracement level, which is demonstrating notable support characteristics. Should this technical foundation hold, we anticipate potential strength accumulation sufficient to challenge and potentially break above the key trendline resistance. A confirmed breakout would signal renewed bullish momentum, establishing conditions favorable for a potential ascent toward higher price levels, possibly testing previous significant highs.
DISCLAIMER: ((trade based on your own decision))
<<press like👍 if you enjoy💚
ETH: Fade the FearTrade Setup
Position: Long (2–3x leverage max)
Entry Zone: 3,741–3,591
Stop Loss: 3,325
Targets:
TP1: 5,190
TP2: 5,561
TP3: 5,836
This setup enters on the completion of Wave 4 and the beginning of a final impulsive Wave 5, with ETH reclaiming prior ATH resistance near 4,868 into a final euphoric Q4.
Macro Context
1. Rate Cuts and End of QT:
The Fed continues to signal a move toward easier policy. As rate cuts proceed and quantitative tightening winds down, risk assets tend to rally. Crypto often lags equities by a few weeks, meaning ETH could soon benefit from these liquidity shifts.
3. Liquidity Flow from Gold:
Crypto will steal liquidity from gold sellers as liquidity rotates.
3. Volatility Positioning:
DVOL data shows implied volatility hovering around 43–44, indicating that institutional players are not aggressively hedging downside. Such volatility compression often precedes a major directional move, typically upward during liquidity expansions
Technical Confluences
1. Wave Structure:
ETH appears to be finalizing Wave 4, setting up for a higher-low structure that leads into Wave 5. The MACD on the 3D timeframe is reversing, supporting bullish continuation.
2. Golden Pocket Retrace:
The current pullback perfectly aligns with the 0.618 Fibonacci retracement zone between 3,741 and 3,591.
4. Bull Market Support Band:
The 20W SMA and 21W EMA continue to hold as dynamic support.
5. Funding Rate Sentiment:
Funding rates across major exchanges remain neutral to slightly negative. This shows that short positions are piling in near support, which is typical during the final stages of a corrective phase before a squeeze higher.
DO NOT BE COMPLACENT.

Don’t Miss the Wave: Navigating the Markup & Acceleration PhasesEvery strong rally begins with a period of quiet buildup. The price moves sideways, creating a base, while smart money quietly accumulates. Then, at a certain point, something shifts. The Markup Phase begins, and soon after, the market enters the Acceleration Phase — a fast-paced, FOMO-driven surge that catches everyone’s attention. Understanding these phases is key to riding the wave before it crashes.
How to Trade the Markup and Acceleration Phases?
During the Markup Phase, many traders look for opportunities to enter positions gradually, avoiding the temptation to chase after the rapid price movement. A more strategic approach is to scale in on retests of breakout zones or key support levels, which can provide better entry points with lower risk.
As the market moves into the Acceleration Phase, the price tends to surge rapidly, often with little to no pullback. At this stage, it's crucial to protect profits and manage risk. Traders often trail stop-loss orders to lock in gains or take partial profits as the price continues to climb. Parabolic moves are thrilling, but they don't last forever — it's important to stay alert and ready for a reversal or correction when the momentum starts to fade.
🔑 Key Indicators to Watch
During the markup phase, technical signals can help confirm that the move is real. Look for:
Rising volume — confirms genuine interest behind the breakout;
Higher highs and higher lows — a clear sign of trend formation;
Moving averages (20/50-day) — the price staying above these lines often signals trend strength;
RSI and MACD — momentum indicators showing acceleration or potential exhaustion;
Open interest and funding rates — rising figures suggest growing trader participation and leverage.
As the rally gains traction, the market enters the Acceleration Phase. This is where hype replaces logic — the charts go parabolic, social media buzzes, and new traders rush in driven by FOMO. Price action becomes almost vertical, and corrections get instantly bought up. Typical signs of this stage include overbought RSI, spiking volumes, and extreme funding rates — all pointing to overheated market sentiment. Find out what drives the market in our article here .
🪤Common Traps to Avoid
The biggest mistake traders make during these phases is confusing momentum with sustainability. Entering too late, ignoring overheated sentiment, or overleveraging during acceleration can quickly turn profits into losses. Always check whether volume supports the move and watch for sudden spikes in funding rates — they often signal that the trend is near exhaustion.
🏁Final Thoughts
Understanding where the market stands in this cycle helps traders make smarter decisions. The markup and acceleration phases can bring big opportunities, but also major risks for those entering too late. Always rely on your own analysis and use proper risk management. The market doesn’t reward emotions; it rewards patience and discipline.

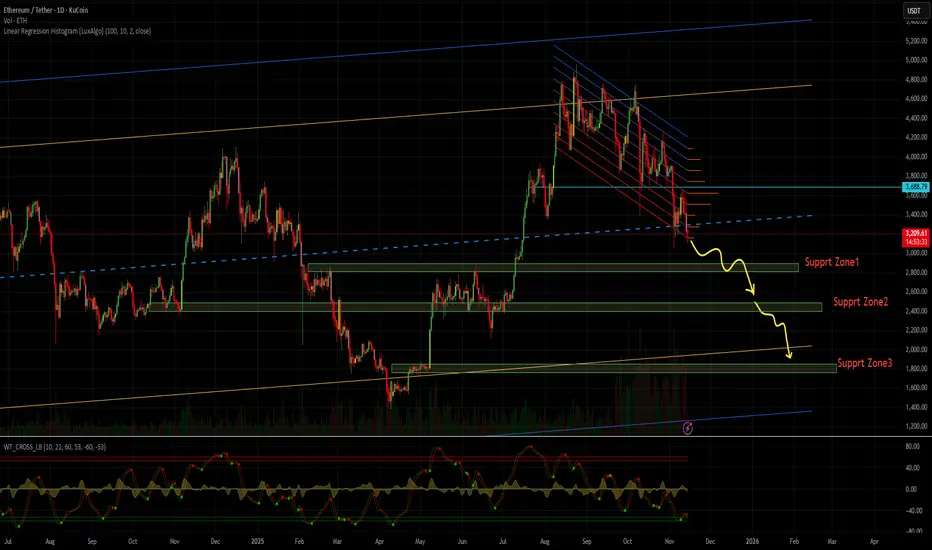
Eth/Usdt analysisI think crypto is in Downtrend mode right now.
but we have 3 support zone for ETH/USDT that shown in chart.
just wait for reverse candle in daily time frame in support zone.
support zone 2 and 3 is more safer.
Note that these support zones are good for short-term purchases and require further analysis to say the market is bullish.
ETHUSDT.P - November 14, 2025ETHUSDT.P on the 15-minute chart remains in a short-term downtrend, defined by a clear descending trendline that continues to cap price. Current price action is consolidating beneath the $3,240 resistance zone, where repeated rejections suggest sellers are still in control unless a clean breakout and retest occur above this level. Immediate support sits near $3,104; a breakdown below this shelf would likely accelerate momentum toward the broader demand zone around $2,960–$2,900. Conversely, if buyers manage to reclaim the trendline and hold above the $3,240 region, a short-term relief rally could develop, but until then the bias leans bearish within the current structure.

Ethereum touched the targetHello friends 😍
💁♂️ Ethereum mid-term analysis moved as expected and reached the $3100-$3200 area
You can see the previous analysis
⚠️ None of the analysis is a recommendation to buy or sell, but simply my personal opinions on the charts. You can use the charts and choose any that interest you and take a position if you wish.
To support me, I would appreciate it if you boost the analysis and share it with your friends so that I can analyze it with more energy for you, my dears. Thank you all. 💖

DeGRAM | ETHUSD has consolidated below the mirror📊 Technical Analysis
● ETH/USD is testing the broken dynamic support line, which now acts as resistance near $3,600. This retest aligns with the descending channel structure, confirming the dominance of sellers.
● A rejection from this level could lead to a continuation toward the $3,200–$3,100 support zone, coinciding with the previous accumulation area visible from July.
💡 Fundamental Analysis
● Ethereum faces mild pressure as risk appetite fades amid uncertainty over upcoming U.S. economic data and delayed ETF approvals, dampening short-term demand.
✨ Summary
● Resistance: $3,600. Support: $3,200. ETH remains bearish while below resistance, with potential continuation toward the next support zone.
-------------------
Share your opinion in the comments and support the idea with a like. Thanks for your support!

ETH/USDT: Bullish Breakout to $3740?BINANCE:ETHUSDT is setting up for a potential bullish breakout on the 4-hour chart , where price has formed a higher low while testing a downward trendline, converging near the good entry zone at cumulative short liquidation levels—suggesting buyers could trigger a squeeze if support holds, aiming for higher resistances. This position carries high risk, so always prioritize strict risk and capital management to avoid significant losses in volatile crypto markets.
Entry between $3370-$3417 . Target at $3740 in the take profit zone. Set a stop loss on a close below $3320 to mitigate downside. 🌟 Look for confirmation with a bullish close above the entry and surging volume, riding Ethereum's momentum amid broader crypto trends.
📝 Trade Setup:
🎯 Entry Zone: $3,370 – $3,417
💰 Target: $3,740 (Take-Profit Zone)
❌ Stop Loss: Close below $3,320
⚖️ Risk-to-Reward: Approximately 1:3, depending on entry execution and volatility
⚠️ This remains a high-risk trade setup — strict risk and capital management are essential in volatile crypto conditions.
What's your view on this high-risk setup? Drop your thoughts below! 👇

Ethereum's Updated Map: Giant Flat Correction Corrections can be complex and massive in size
On Ethereum, we have been in a major corrective structure since the strong move up of 2018-2021 completed
The structure shows two large red legs down with a green zigzag joint connecting them
The first large red leg down defines the boundaries of this Giant Flat Correction
ranging between $4,868 and $882
The current move down may mirror the structure of that first leg
potentially bouncing within the $2,500 to $3,500 zone before heading lower
This decline could revisit the $882 low or extend into a full retrace toward $82
After this completes, the second large blue leg up could begin

$ETH Descending Trendline Pressure – Bounce Setup?KUCOIN:ETHUSDT CRYPTOCAP:ETH Descending Trendline Pressure – Bounce Setup?
Current trend: ETH's tracing a sharp downtrend from 4K highs, now slamming the 3,176 support with a wedge-like compression—sellers dominating but volume fading hints at exhaustion 🛡️.
Hold support? Likely yes; prior lows and 200 EMA confluence could spark buyers if wicks hold.
Breakout above resistance? Watch 3,900 flip on close—could reverse to 4,100 if trendline breaks bullishly 🚀.
Dip risk? Sharp to 3,000 on breach, fueled by BTC correlation.
Target: Upside 3,500 on defense; downside 3,050 buffer.
Indicators tracking: RSI (32, oversold snap), Trendline slope, and MACD histogram curl 📉.
#ETHTrading #CryptoWedge #AltcoinPioneers

Ethereum Bear Market Is StartingHello everyone, I hope you're all doing well.
Today I'll share my long-term outlook for Ethereum's price. I expect the price has peaked and will enter a downward trend towards the targets I've listed below
This is not investment advice; please take full responsibility for your buying and selling decisions.
Warning: Be careful not to use this idea with leverage, as you could lose all your money
